Here is the puzzle every Bitcoin trader is staring at this Monday morning: price just ripped 4.16% higher to $63,239, but the daily Relative Strength Index is still pinned at 26.36, the kind of reading you normally only see at capitulation lows. So which signal is lying? The green candle on your screen, or the momentum gauge that says sellers have already done most of their damage?
That tension is the whole story of BTCUSD today analysis. A daily change of +$2,524 looks bullish at a glance, but zoom out and the structure tells a more cautious tale. The daily trend strength still reads a brutal 96% to the downside, the daily MACD remains negative below its signal line, and the overall daily algorithmic signal is a clean SELL (0 buy votes, 8 sell votes). What we have, in plain trader language, is a sharp relief bounce inside a confirmed downtrend, not a confirmed reversal. Big difference. Knowing which one you are trading is the difference between catching a falling knife and catching a real bottom.
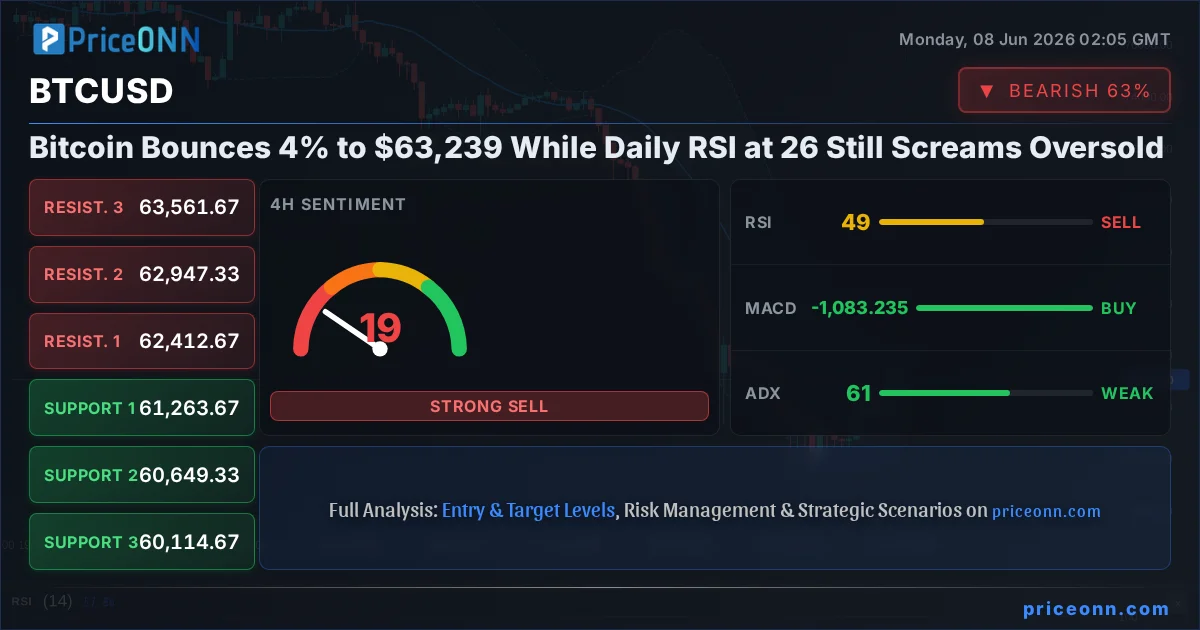
- BTCUSD is trading at $63,239, up 4.16% (+$2,524) on the day, rebounding off a $60,432 daily low.
- The daily RSI at 26.36 and daily Stochastic at K=17.66 / D=12.10 both flag deep oversold conditions, the typical zone where relief bounces are born.
- Price is fighting directly at daily resistance of $63,241 (R2); a daily close above it is the first thing bulls must prove.
- The daily trend remains 96% bearish with a SELL signal, so this is a counter-trend bounce until the chart says otherwise.
- A rising DXY at 99.81 (+0.63%) and a 4% Nasdaq100 drop frame a risk-off macro backdrop that crypto is bouncing against, not with.
Time Horizon: This analysis is built around the intraday and multi-day swing window, blending the 1H, 4H, and daily charts.
Why the $63,241 Daily Line Is the Whole Ballgame for BTCUSD
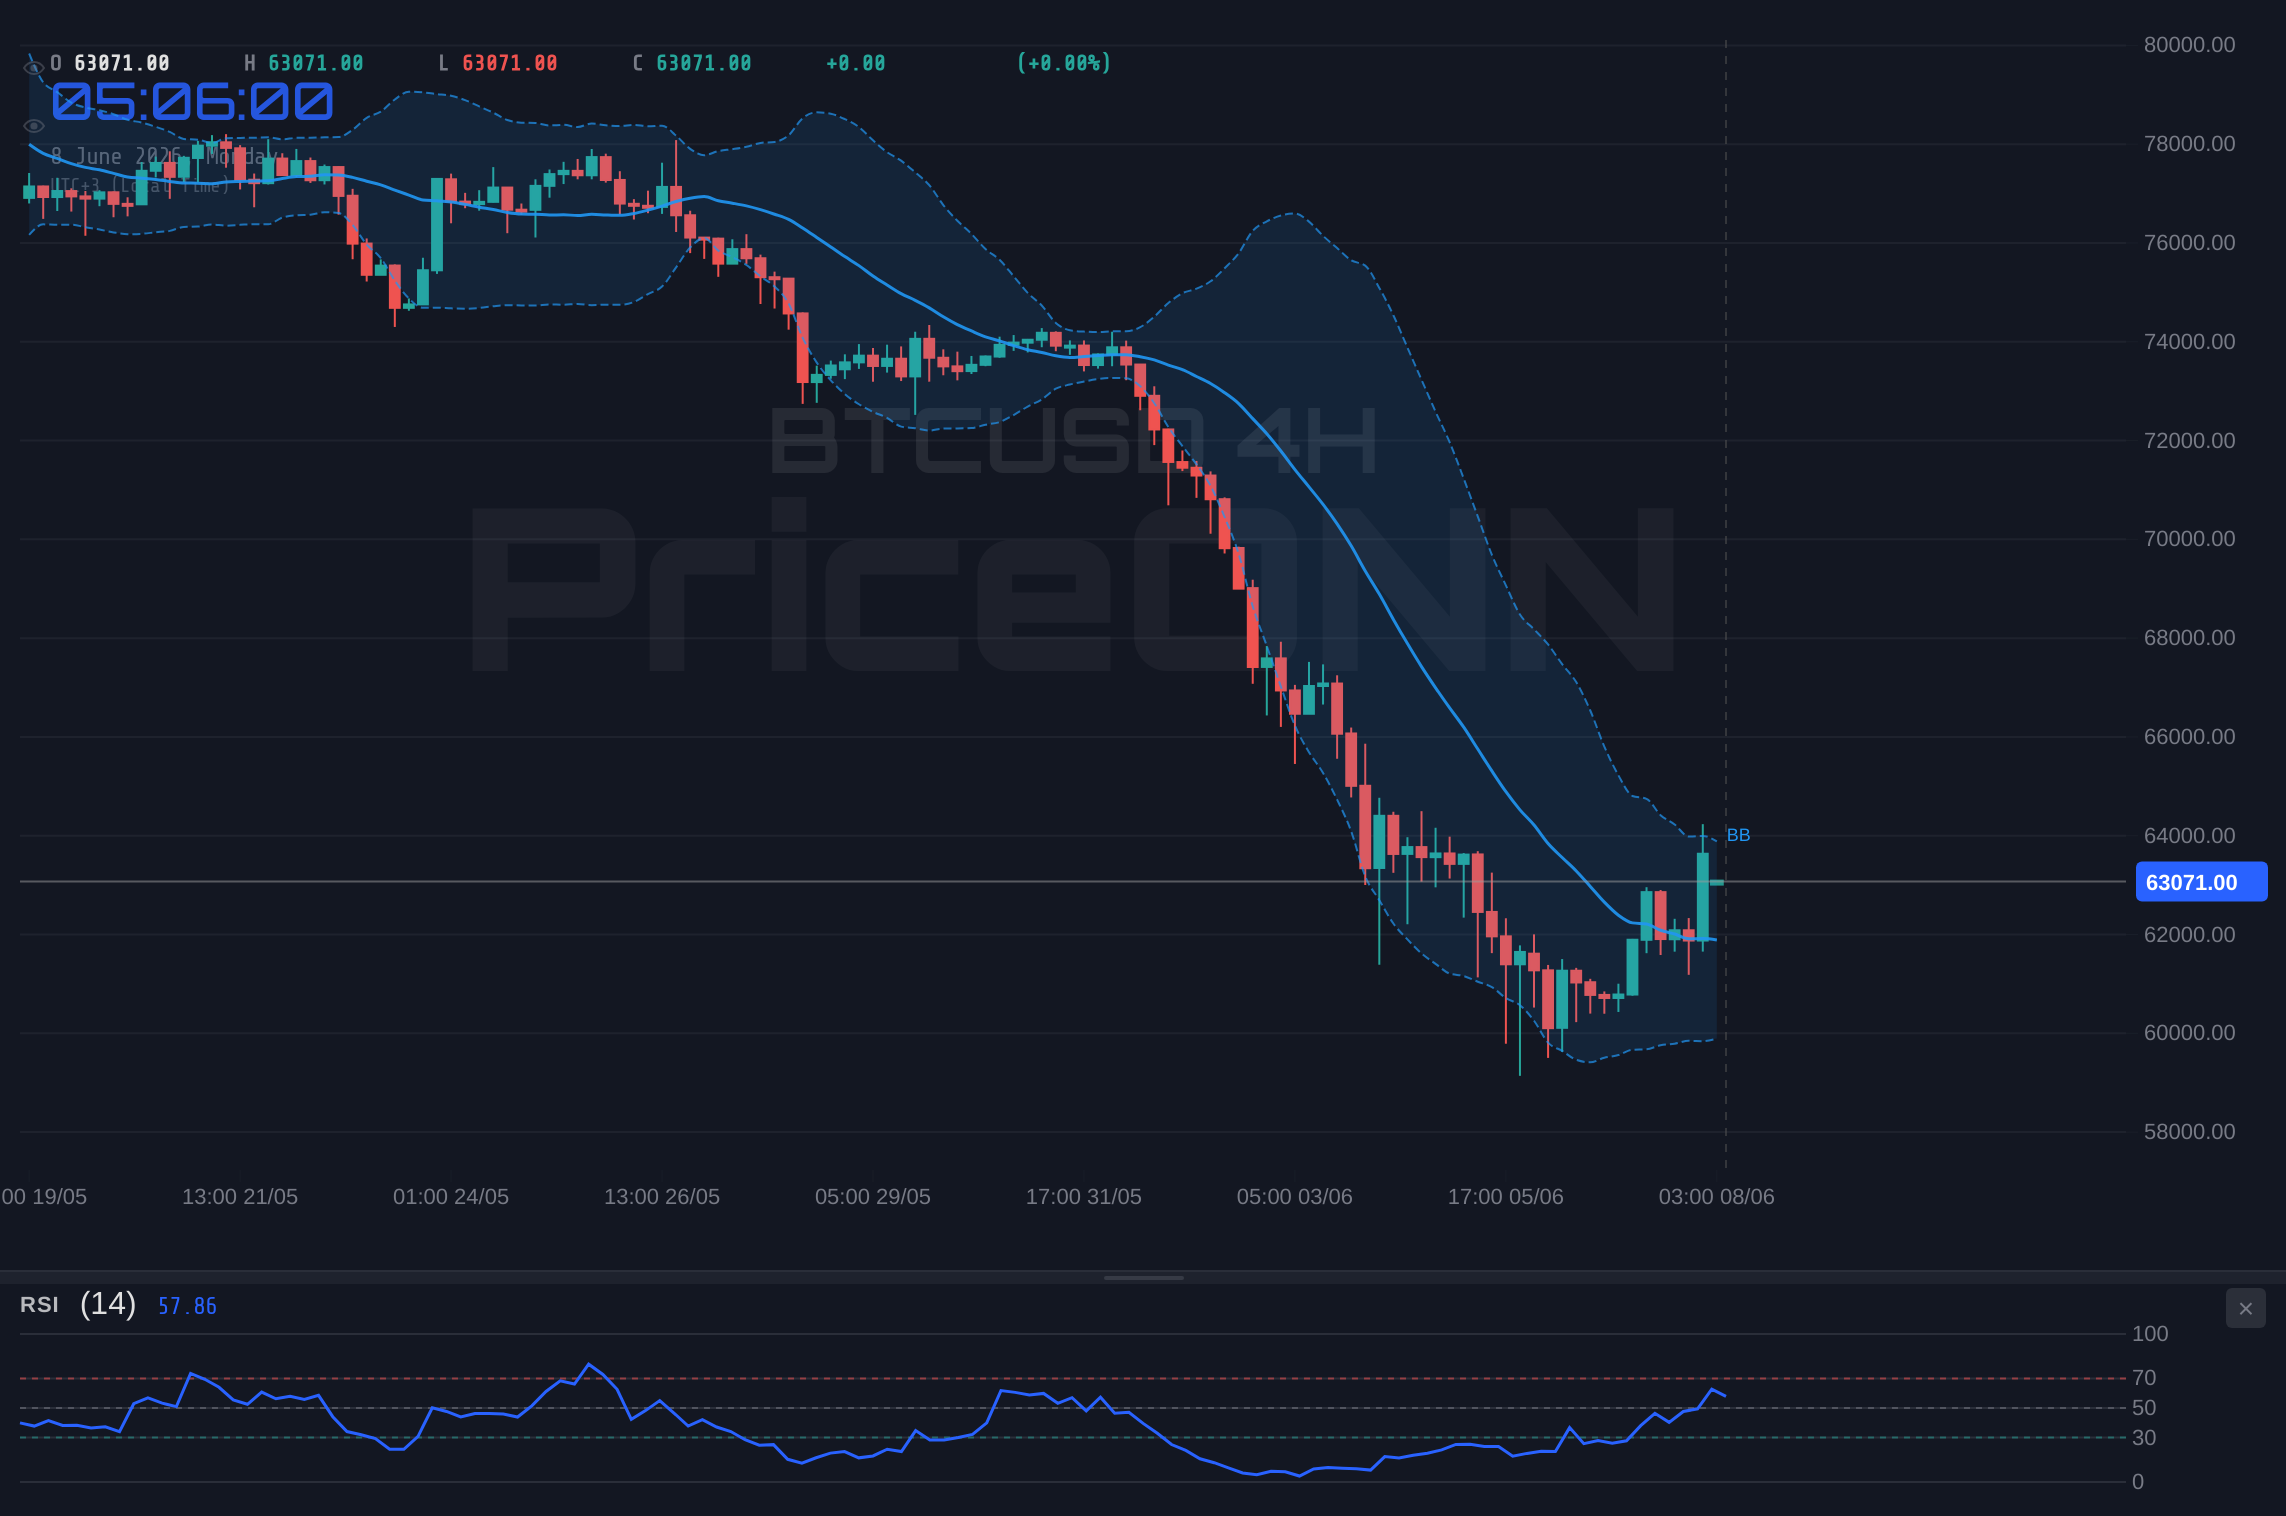
Let me explain why that one number matters so much. On the daily chart, resistance stacks at $61,978 (R1), $63,241 (R2), and $64,479 (R3). Bitcoin is currently changing hands at $63,239, which means price is sitting almost exactly on the R2 level to the cent. That is not a coincidence the chart shrugs off. It is a battle line. Bulls have already reclaimed R1, which is constructive, but they are now pressing their nose against the next ceiling with the broader trend leaning against them.
This is exactly where you need to pay attention. A daily close that holds above $63,241 would open the door toward the $64,479 daily resistance, and crucially it would start to argue that the deeply oversold RSI reading was an early warning of exhaustion rather than just a pause. Fail here, get rejected, and print a daily close back below $61,978, and the bounce gets reclassified as a liquidity grab that swept the lows before resuming the downtrend. Same chart, two completely different stories, and the resolution comes at one level.
The intraday picture is friendlier. On the 1H chart the trend is up with 83% strength, the MACD is positive and riding above its signal line, and the structure shows higher support at $63,229.67, $62,824.33, and $62,507.67. The Stochastic at K=72.75 over D=53.32 confirms short-term buyers are in control. Short-term, bulls have the wheel. The problem is that the 1H trend is a fast-moving tactical read, and it is swimming against a daily current that has not turned.
What the RSI and Stochastic Tell Us About BTCUSD Trend Analysis
Now this is where it gets interesting. Look at how the momentum picture fractures across timeframes, because that fracture IS the trade.
On the daily, RSI at 26.36 is firmly in oversold territory. Historically, when RSI on BTCUSD drops into the mid-20s, it signals that selling pressure has become statistically stretched and a mean-reversion bounce becomes more probable. That is precisely what the 4.16% pop is. But oversold is not the same as bottomed. In a strong downtrend, RSI can hug the oversold band for days while price grinds lower, punishing every trader who buys the dip too early. The daily Stochastic backs this caution, sitting at K=17.66 and D=12.10, also buried near the floor.
Step down to the 4H and the read turns murky. RSI there is a neutral 49.82, the Stochastic has rolled over to a bearish cross with K=69.46 falling below D=74.82, and here is the eyebrow-raiser: the 4H ADX prints 60.75, an extremely powerful trend reading that the data still tags as downside-aligned. An ADX that high tells you the prevailing move has serious force behind it, so a bounce into 4H resistance at $62,412.67, $62,947.33, and $63,561.67 has real overhead to chew through. Price is already poking through that band, which is encouraging, but the momentum behind the move needs to keep feeding it.
The 1H ADX at 25.85 confirms a genuine short-term uptrend with the RSI at 62.12 leaving room before overbought. So the honest synthesis is this: short-term momentum is bullish, intermediate momentum is neutral-to-heavy, and the higher-timeframe trend is oversold-but-still-bearish. When timeframes disagree this loudly, the professional move is not to force a position. It is to demand confirmation. A simplistic 'RSI 26 equals buy' call ignores that the same indicator can stay oversold while a 96%-strength daily downtrend keeps doing its work.
An oversold RSI in a confirmed downtrend is a setup condition, not a green light. This bounce thesis weakens fast if BTCUSD prints a daily close back below the $61,978 daily resistance-turned-pivot, which would suggest the rally was a liquidity sweep rather than a base.
The Macro Backdrop: Strong Dollar, Cracking Tech, and a Crypto Decoupling
Bitcoin is not bouncing in a vacuum, and the macro tape this week is anything but calm. The Dollar Index is up 0.63% to 99.81, with a daily RSI at 65.42 and a clean 8-of-8 daily BUY signal. A strengthening dollar is a textbook headwind for risk assets, and the fact that BTCUSD and ETHUSD are rallying anyway hints at a short-term decoupling driven by crypto-specific positioning rather than broad risk appetite.
Because make no mistake, broad risk appetite is wobbling. The Nasdaq100 is down a hard 4% to 29,121.76, and per the latest market headlines, equities ended the week defensive as the AI trade cracked, Fed risks rose, and Middle East tensions around the Strait of Hormuz escalated. Reuters-tracked reporting noted tanker traffic through Hormuz has collapsed by an estimated 90% to 95% versus pre-conflict levels, keeping a geopolitical risk premium alive across markets. The SP500 managed a 0.74% gain to 6,572.87 on the intraday tape, but its daily structure still flashes a SELL with a 100%-strength daily downtrend, so the index strength is shallow.
Against that backdrop, the more compelling intermarket clue is Ethereum. ETHUSD is screaming higher by 8.48% to $1,687.25, roughly double Bitcoin's percentage gain, with its own daily RSI at 28.94 also oversold. When ETH outperforms BTC off a washed-out low, it often marks short-covering and bottom-fishing flowing back into the highest-beta corners of crypto first. That is a sentiment tell worth respecting, even if it is not yet a trend.
The Economic Calendar Wildcard Hanging Over Crypto
The week ahead carries real event risk that can override any chart. The economic calendar flags high-impact USD releases, including an inflation print with a 0.3 forecast against a 0.2 prior, a consumer sentiment-style read forecast at 95 versus a previous 115, and an unemployment figure holding at a 4.3 forecast. The standout, per economics desk previews, is U.S. May CPI, with renewed upward pressure expected and some estimates calling for a 0.5% monthly rise.
Why does this matter for a BTCUSD breakout attempt? Because a hotter-than-expected CPI would reinforce the very dollar strength already pressuring risk, likely capping this bounce right at the daily resistance shelf. A cooler print, on the other hand, would ease the DXY bid and could be the catalyst that converts an oversold bounce into a genuine base. Until that data resolves, demanding patience is simply good risk management. The market always gives a second entry once the catalyst is on the tape.
How to Trade the BTCUSD Setup: A Watch Zone, Not a Chase
So what is the actionable read across trader profiles? For the scalper, the 1H uptrend, positive MACD, and rising support at $63,229.67 offer a tactical playground, but tight risk is non-negotiable with the daily trend still bearish. For the swing trader, this is a watch zone. The condition that would create a valid swing setup is straightforward: a daily close above $63,241, ideally followed by a successful retest that holds, would shift the structure and put $64,479 in focus. Until that close prints, chasing strength into stacked resistance with a 96%-bearish daily backdrop is low-quality risk.
For the longer-term position trader, the deeply oversold daily RSI and Stochastic are worth logging, because these are the zones where durable bottoms eventually form. But 'eventually' is the operative word. The smart approach is to let the chart confirm: a reclaimed daily level plus an RSI that climbs back above 30 and holds would be far stronger evidence than a single green candle. The confluence to wait for is price, momentum, and a friendly macro catalyst lining up together.
Three Scenarios for BTCUSD From Here
Rejection at Resistance: The Bounce Fades
50% ProbabilityRange Squeeze: Digesting the Pop
30% ProbabilityOversold Reversal Confirms
20% Probability| Indicator | Value | Signal | Interpretation |
|---|---|---|---|
| RSI (Daily) | 26.36 | Oversold | Stretched selling, bounce-prone but not confirmed |
| RSI (1H) | 62.12 | Bullish | Short-term momentum up with room to run |
| MACD (Daily) | Negative | Bearish | Below signal line, downtrend intact |
| Stochastic (Daily) | 17.66 / 12.10 | Oversold | Deep low, watching for upward cross |
| ADX (Daily) | 42.76 | Strong | Powerful prevailing downtrend |
| Overall (Daily) | 0 Buy / 8 Sell | Sell | Counter-trend bounce until reclaimed |
Frequently Asked Questions: BTCUSD Analysis
What happens if BTCUSD breaks above $63,241 resistance?
A confirmed daily close above the $63,241 daily resistance would shift the short-term structure and put the $64,479 daily level in focus. It would also support the case that the oversold daily RSI of 26.36 marked exhaustion rather than a pause, though follow-through volume is needed to validate the move.
Is the daily RSI at 26.36 a buy signal for BTCUSD right now?
Not on its own. An RSI of 26.36 confirms oversold conditions, but in a 96%-strength daily downtrend the indicator can stay suppressed for days while price grinds lower. The higher-probability approach is to wait for the RSI to climb back above 30 alongside a reclaimed daily level before treating it as a buy trigger.
Should I chase BTCUSD at current levels of $63,239?
Chasing into stacked resistance at $63,241 and $63,951.67 while the daily trend is still bearish is low-quality risk. This is a watch zone: the cleaner setup forms on a daily close above $63,241 followed by a successful retest, with invalidation on a close back below $61,978.
How will the upcoming U.S. CPI release affect BTCUSD this week?
A hotter-than-expected CPI, with some estimates near 0.5% monthly, would likely reinforce the DXY strength at 99.81 and cap this bounce at resistance. A cooler print would ease the dollar bid and could be the catalyst that turns the oversold bounce into a more durable base near $63,239.
The chart is handing you a clean if-then question rather than a verdict: reclaim $63,241 on a daily close and the oversold bounce earns a second look toward $64,479; lose $61,978 and the 96%-bearish daily trend likely reasserts itself toward $59,477. Volatility creates opportunity, and the traders who wait for confirmation here, rather than guessing at the bottom, will be the ones positioned when the market finally tips its hand.
Track markets in real-time
AI-powered analysis, technical indicators and real-time price data.
Join Our Telegram Channel
Breaking market news, AI analysis and trading signals instantly.
Join Channel