Three pressures landed on risk assets in the final stretch of last week, and Bitcoin sat directly in the path of all of them. A blowout US jobs report rebuilt the case for Fed patience, the dollar index pushed back toward triple digits, and the AI-led equity trade cracked hard enough to drag the Nasdaq 100 down a brutal 5.41% on the day. When the macro tide turns risk-off this fast, crypto rarely gets a hall pass, and the weekly candle on BTCUSD shows it.
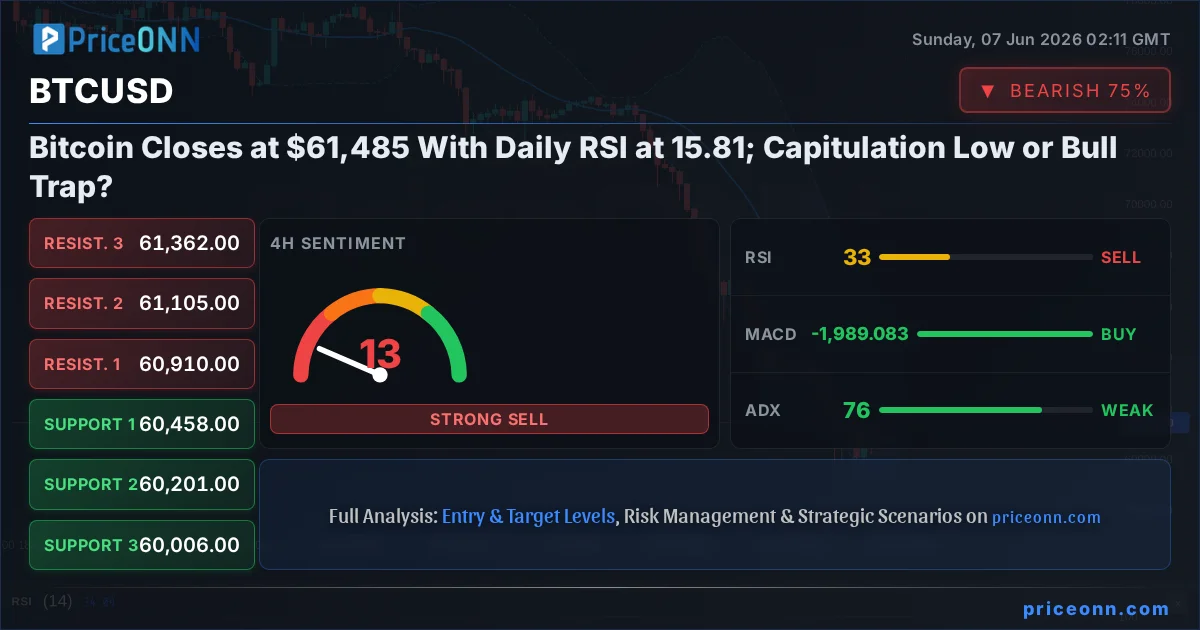
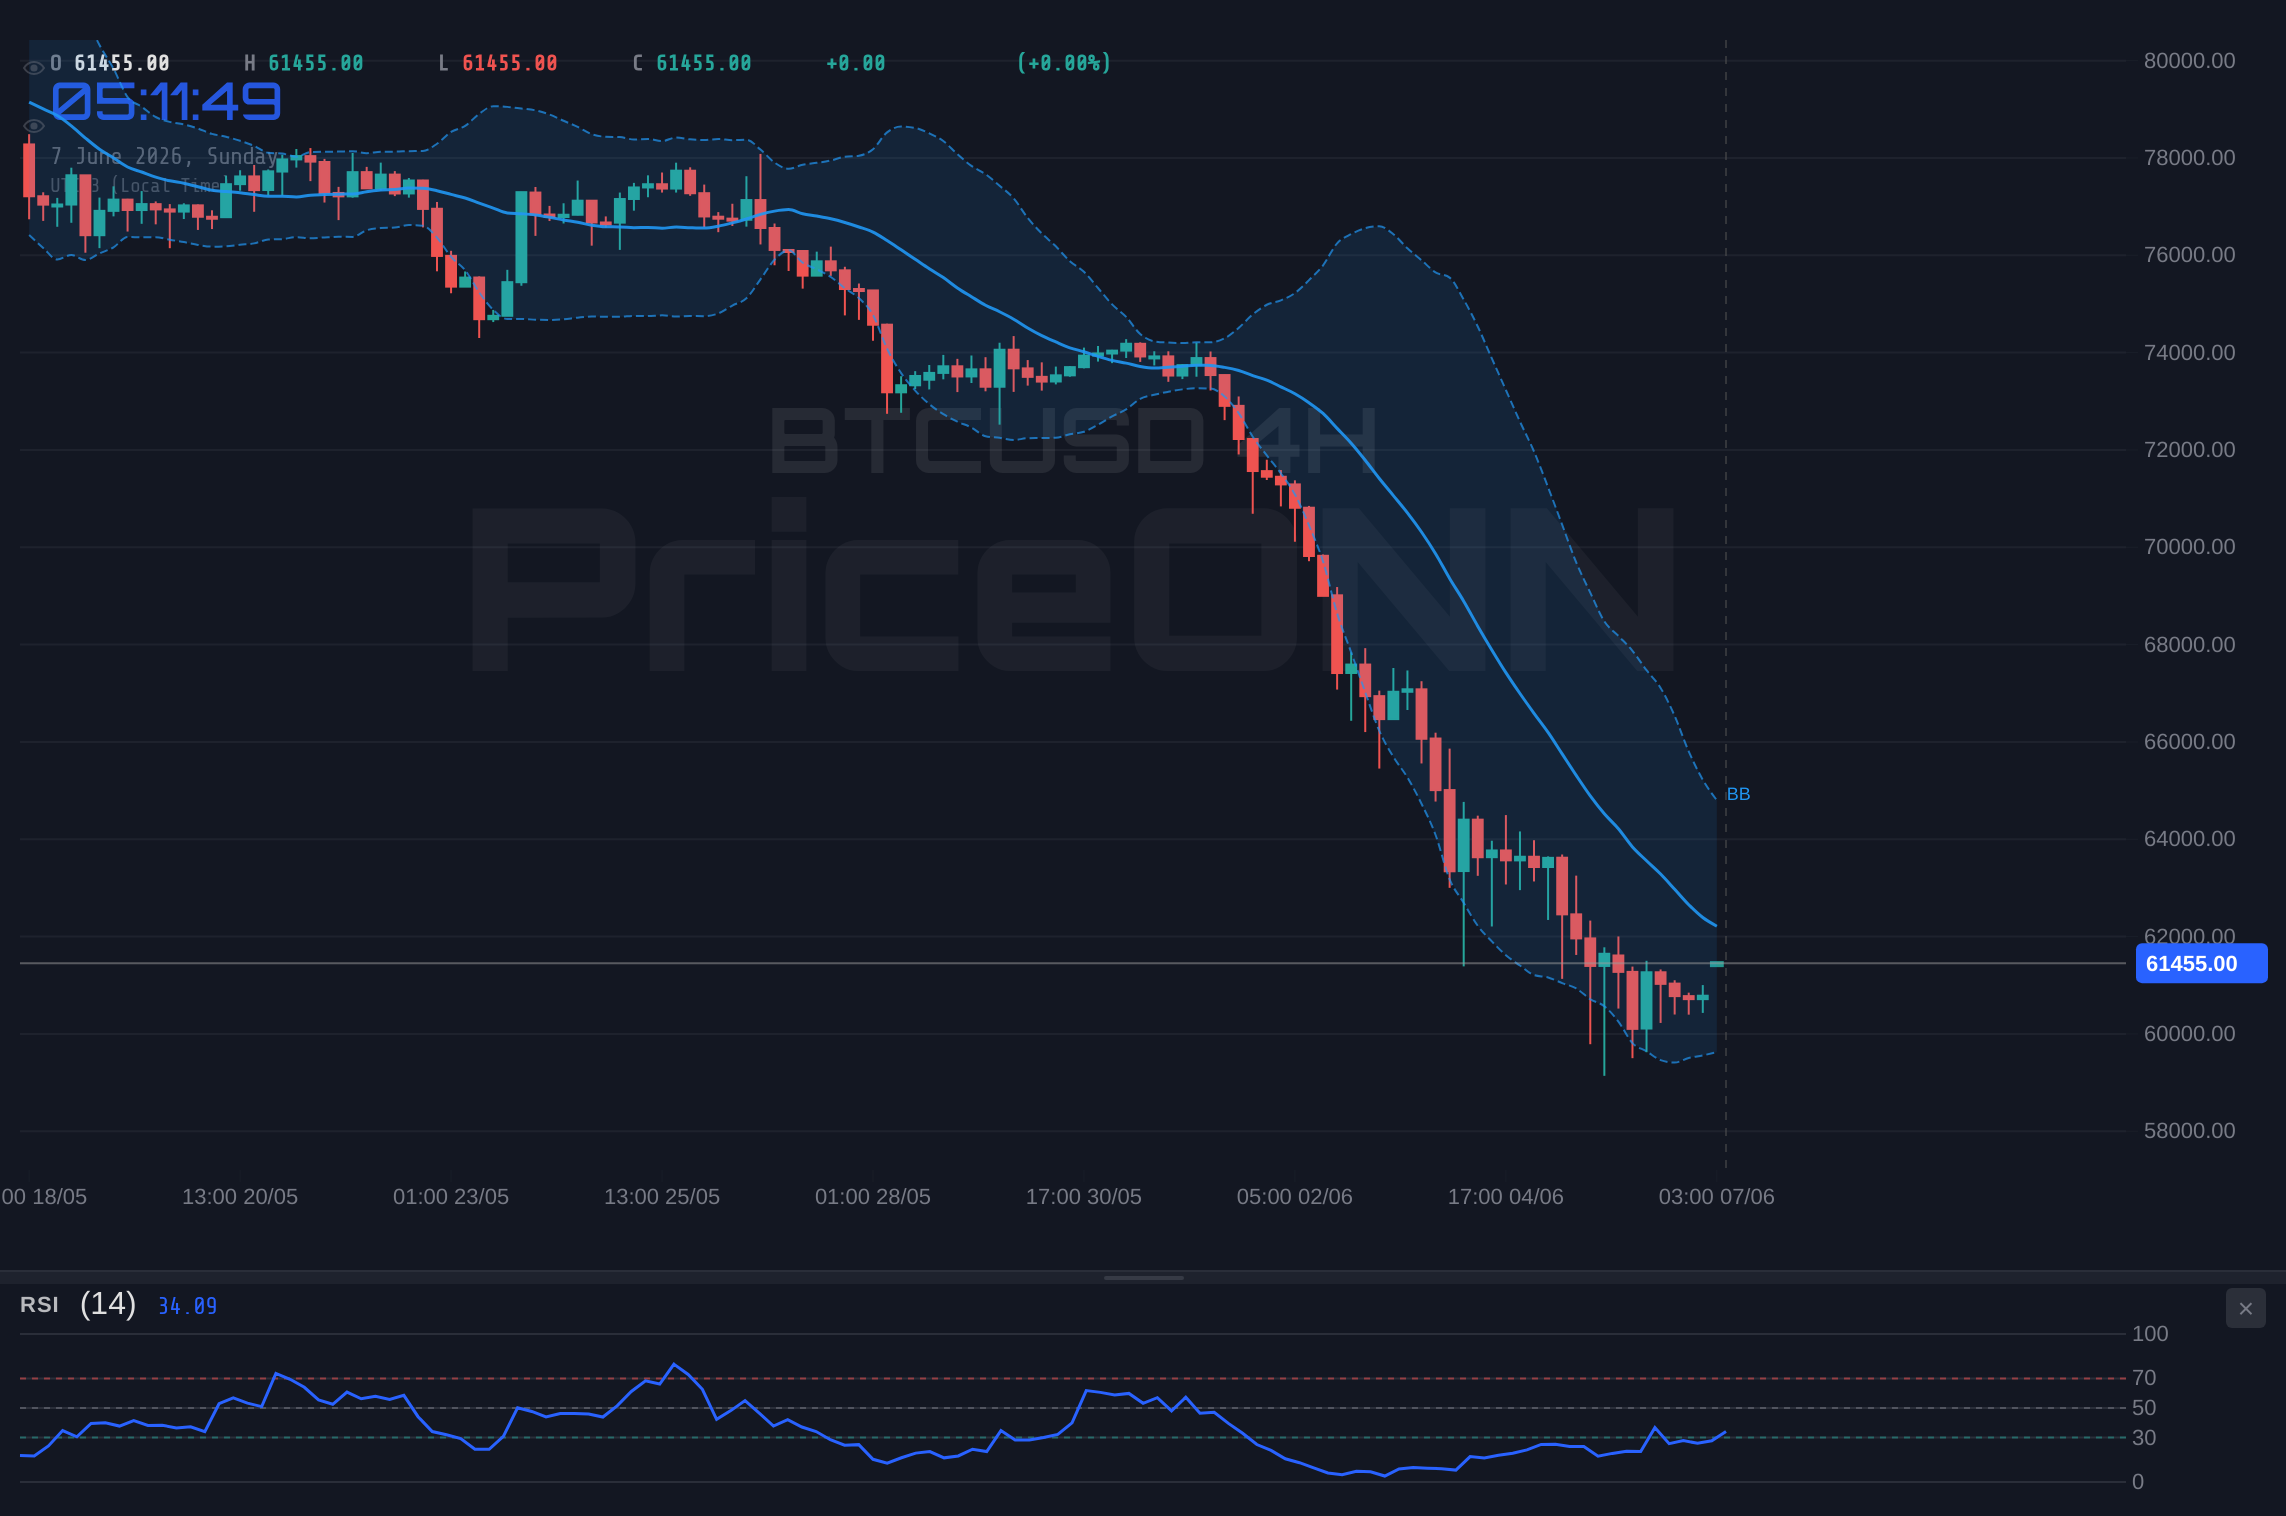
BTCUSD weekly outlook starts in an uncomfortable place: last Friday's close printed at $61,485, down 0.26% (-162 points) on the session, after the pair carved out a daily range between $59,502 and $62,003. That intraday sweep below $60,000 and the recovery back above it tells you most of what you need to know about where the battle lines now sit. This is a weekend review, the order books are quiet, and that is exactly the moment to step back and read the chart without the noise of live ticks.
- BTCUSD closed last week at $61,485, with the daily RSI at a deeply oversold 15.81 and daily Stochastic at K=15.4 / D=12.69, the kind of reading that historically precedes relief bounces.
- The 4-hour ADX at 75.73 signals an extraordinarily strong downtrend; momentum has not flipped, so oversold does not yet mean bottom.
- Critical weekly support sits at $59,197, with deeper shelves at $56,747 and $54,355; first major resistance is $64,039.
- A surging dollar index at 99.80 (+0.56%) and a 5.41% Nasdaq 100 collapse drove the risk-off purge that pulled Bitcoin lower into the close.
Time Horizon: This is a weekend weekly review of BTCUSD, framed for swing traders and position holders planning the week ahead, not for live intraday execution.
Why a Strong US Jobs Report Sent BTCUSD Lower
The catalyst chain last week ran through the dollar. According to a Reuters report from June 5, the dollar strengthened broadly after a much stronger-than-expected US employment report reinforced confidence that the Federal Reserve can afford to stay patient, and USD/JPY cleared the 160 handle in the process. For Bitcoin, this is the part that matters: when payrolls come in hot, rate-cut bets get pushed further out, real yields firm up, and the dollar index climbs. Each of those is a headwind for a non-yielding, risk-on asset like BTC.
You can see the dollar's grip directly in the data. The dollar index closed the week at 99.80, up 0.56%, after trading a daily range of 98.90 to 99.27 and breaking higher. On the hourly chart the DXY RSI sat at a scorching 79.59, firmly in overbought territory, with a strong uptrend reading. That is the textbook inverse pressure on crypto: a dollar pressing into the 99.80 zone with that kind of momentum leaves Bitcoin fighting a current it did not create. The historical Bitcoin-dollar relationship is not mechanical day to day, but across a week where DXY rises more than half a percent and crypto bleeds, the correlation does most of the explaining.
Layer in the equity story. The Nasdaq 100 cratered 5.41% to 28,791.34, with its hourly RSI collapsing to 13.09 and the daily ADX at a heavy 37.21 confirming a strong down-leg. As one widely circulated market note put it last Friday, markets ended the week in a far more defensive mood than they began, with the AI trade cracking, Fed risk rising, and an escalating Iran conflict adding a geopolitical premium. When the highest-beta corner of equities loses more than five percent in a session, Bitcoin tends to get treated as just another risk asset to de-gross. That is precisely what played out into the $61,485 close.
The week ahead brings Fed Chair Warsh's first meeting into focus, and economists are flagging renewed upward pressure in US inflation, with May CPI expectations around a hot 0.5% month over month. A sticky CPI print would reinforce the dollar strength that pressured BTCUSD last week. This is the single biggest macro variable for crypto over the next seven sessions.
What the Daily RSI at 15.81 Tells Us About BTCUSD Trend Analysis
Here is where it gets interesting. The same selloff that punished Bitcoin also stretched it into genuinely rare oversold territory on the higher timeframe. The daily RSI closed at 15.81. Readings below 20 on the daily are uncommon, and they do not appear in healthy trends; they show up after capitulative flushes. The daily Stochastic agrees, pinned in the basement at K=15.4 and D=12.69, and price closed below the lower Bollinger band, which marks a statistically stretched move away from the mean.
So is this the bottom? Not so fast. This is exactly the trap that catches knife-catchers. An oversold oscillator describes how far and how fast price has fallen; it says nothing about when the selling exhausts. The real tell sits in the trend-strength gauges. On the 4-hour chart, the ADX reads an enormous 75.73, an aberration that signals one of the most powerful downtrends you will ever see on that timeframe. The daily ADX at 41.06 backs it up as a strong, committed move. When ADX is screaming trend that loudly, fading it purely because RSI is low has historically been a fast way to get run over.
The conflict between signals is the whole story for BTCUSD trend analysis right now. Oversold momentum points to a bounce; dominant trend strength points to continuation. The tiebreaker is structure, and structure is not yet broken in the bulls' favor. Notice the contradiction even inside the lower timeframes: the 1-hour RSI recovered to 56.97 with a positive MACD and a Stochastic %K back up at 76.97, hinting at a short-term reflex rally, while the 4-hour RSI at 33.15 and daily MACD below its signal line keep the dominant bias pointed down. Short bursts of strength inside a strong downtrend are normal. They become meaningful only when they reclaim a level the bears are defending.
When daily RSI prints sub-16 but 4-hour ADX is above 70, the highest-probability path is often a sharp relief bounce that fails at prior support-turned-resistance, not an immediate trend reversal. The level to respect on any bounce is the $64,039 daily resistance. Reclaiming it changes the conversation; rejecting it confirms the bears still own the tape.
The Levels That Held and Broke During the Week
Price action is a story of defended lines, and last week's range gives a clean read on which ones mattered. The daily low at $59,502 is the key reference. Bears pushed price under the round $60,000 figure intraday, sweeping liquidity that had built up beneath it, before buyers dragged the close back to $61,485. That wick is a liquidity grab, not yet a reversal, but it shows there is real demand stacked just below 60k.
The structure on the weekly map is straightforward. The first line of defense, the support that buyers must protect this week, sits at $59,197. That level is the gateway. Below it, the air gets thin quickly: the next shelf is down at $56,747, and beneath that a deeper capitulation pocket at $54,355. On the 4-hour timeframe the more immediate supports cluster at $60,458, $60,201 and $60,006, which is why the $60,000 zone acted like a magnet during Friday's flush.
To the upside, the bears have planted their flag. The first meaningful resistance is $64,039 on the daily, and that single number is the line in the sand for this entire setup. Above it, the next hurdles stand at $66,431 and $68,881. Until BTCUSD can put a daily close above $64,039, every bounce should be treated as a counter-trend move inside a downtrend, not the start of a new leg higher. On the 4-hour, the nearer caps at $60,910, $61,105 and $61,362 are the micro-levels that defined Friday's chop, and price closed wedged right in that congestion.
On-Chain and Crypto-Specific Context Behind the Move
Technical levels tell you where, but crypto fundamentals tell you why the floor sits where it does. A weekly flush like this one is where the composition of holders matters most. When price wicks below psychological round numbers such as $60,000, the typical pattern is that leveraged longs get liquidated while exchange inflows spike, as short-term holders capitulate and move coins to venues to sell. The recovery back to $61,485 into the close suggests that wave of forced selling found absorbing bids rather than a vacuum, which is constructive even within a downtrend.
Bitcoin dominance is the other lens. Notice how Ethereum fared worse on the relative-stress gauges: ETHUSD closed at $1,589.72, down 0.73%, but its daily RSI sank to 14.37, even more oversold than Bitcoin's 15.81, with a very strong daily ADX of 51.57 confirming the down-leg. When the second-largest asset bleeds harder on the oscillators than BTC during a risk-off purge, it typically means capital is rotating defensively up the quality curve inside crypto, supporting Bitcoin dominance even as the whole complex falls. That is a classic late-correction signature: altcoins underperform, dominance grinds higher, and BTC becomes the relative safe haven of a risky neighborhood.
For traders watching exchange flows and whale behavior, the tell to monitor this week is whether the sub-$60,000 wicks keep getting bought. Repeated defenses of the $59,197 shelf with shrinking downside follow-through would hint that larger holders are accumulating into weakness. A clean daily close below $59,197, by contrast, would suggest that absorption is failing and that the $56,747 pocket is the next magnet. This is the on-chain question that price alone cannot answer until the candles resolve it.
Multi-Timeframe Analysis: Reading the Conflict Across Charts
One of the cleaner ways to cut through a noisy tape is multi-timeframe analysis, and BTCUSD is handing us a textbook divergence between its short and higher timeframes right now. Walk it from the bottom up. The 1-hour is the most constructive: RSI at 56.97, MACD positive and above its signal line, price poking above the upper Bollinger band, and a Stochastic %K at 76.97 leading %D at 49.85. That is short-term momentum trying to turn up off the oversold flush.
Step up to the 4-hour and the picture darkens. Trend reads as a 100%-strength downtrend, RSI sits at 33.15, MACD remains negative, and that monstrous ADX of 75.73 dwarfs everything. The 4-hour Stochastic shows %K at 49.29 crossing above %D at 38.83, a faint bullish flicker, but it is a candle in a hurricane while ADX is that elevated. The daily timeframe is where the bears are most entrenched: a 100%-strength downtrend, RSI at 15.81, MACD below signal, price under the lower band, ADX at 41.06, and an aggregate signal reading of two buys against six sells.
What this stack tells a swing trader is simple: do not confuse a 1-hour bounce for a daily trend change. The lower timeframe can rip ten percent and still leave the daily structure intact and bearish. The reconciliation point, again, is $64,039. A relief rally that stalls there keeps all three timeframes aligned bearish once the dust settles. A daily close back above it would be the first genuine crack in the higher-timeframe down-structure, and only then does the oversold RSI become a reversal signal rather than a falling-knife warning.
Different trader profiles should watch different things this week. Scalpers can play the 1-hour bounce off the $60,000 zone but must respect the $61,362 micro-cap. Swing traders need a daily close above $64,039 before trusting any reversal. Position holders should treat a decisive break below $59,197 as the signal that the deeper $56,747 and $54,355 shelves are in play.
The Setup That Would Turn This Oversold Read Into a Real Opportunity
This is a watch-zone, not a green light, and the discipline is to wait for the chart to do the work first. The condition that would convert the deeply oversold daily RSI of 15.81 into a tradable long thesis is a structural one, not just an oscillator one. A daily close above $64,039 would open the door for a momentum shift toward $66,431 and potentially $68,881, because it would mean buyers reclaimed the level the bears are defending and the 4-hour ADX downtrend has finally broken its grip. Until that happens, the oversold reading is a reason to watch closely, not a reason to step in front of a 75-ADX downtrend.
On the flip side, the bearish continuation thesis stays valid as long as price trades below $64,039 and, more urgently, holds beneath the $61,362 4-hour resistance band. A daily close below $59,197 would invalidate the bounce narrative and shift focus to the deeper supports. The honest read is that the higher-timeframe trend still belongs to the bears; the oversold extremes simply raise the odds of a sharp counter-trend bounce inside that downtrend. Patience here is not passivity, it is risk management. The market has given a deeply stretched tape, and the smart move is to let it prove direction at $64,039 or $59,197 before committing.
Three Paths for BTCUSD in the Week Ahead
Trend Continuation: Bears Press the Flush
55% ProbabilityOversold Chop: Range Repair Above 60k
30% ProbabilityOversold Reversal: Bulls Reclaim the Line
15% ProbabilityEconomic Calendar: What Could Move BTCUSD Next Week
The macro calendar is the wildcard, and this week it is loaded. The dominant event is US inflation. Economists are penciling in a May CPI rise near 0.5% month over month, a number that, if confirmed, would mark renewed upward pressure on prices. A hot reading would almost certainly extend the dollar strength that pressured BTCUSD into Friday's close, because it pushes Fed easing expectations further out and lifts real yields. A cooler print would do the opposite, taking pressure off the DXY and giving Bitcoin's oversold bounce room to breathe toward that $64,039 test.
On the labor side, upcoming US data carries a forecast of 211 versus a previous 215, alongside an unemployment-rate forecast holding at 4.3%. After last week's much stronger-than-expected payrolls reinforced Fed patience, any further labor strength feeds the same risk-off, strong-dollar narrative that weighed on crypto. The first meeting under Fed Chair Warsh is the other gravity well; markets will parse every signal for whether the hot data shifts the policy tone more hawkish. For a non-yielding asset like Bitcoin, the rates path is the master variable, and it gets recalibrated with each of these prints.
The geopolitical layer is not background noise either. The escalating Iran conflict flagged in last week's coverage adds a risk premium that cuts both ways for crypto: it can spark safe-haven flows that occasionally spill into Bitcoin, but in an acute risk-off purge it more often triggers broad de-risking that drags BTC down with equities, exactly the dynamic that played out alongside the 5.41% Nasdaq 100 drop.
Bitcoin Market Sentiment and the Week Ahead
Pulling the threads together, BTCUSD market sentiment heading into the new week is bruised but stretched. The close at $61,485 leaves price coiled in a tight zone between the $59,197 support that buyers must hold and the $64,039 resistance that bears must defend. The deeply oversold daily RSI of 15.81 and Stochastic at 15.4 say the rubber band is pulled tight; the 4-hour ADX of 75.73 says the hand pulling it is still strong. That tension is the entire setup.
The roadmap from here is clean, even if the outcome is not yet decided. Watch the dollar index at 99.80, watch the CPI print, and watch the two lines that frame the range. A daily close above $64,039 flips the script toward the oversold-reversal path. A daily close below $59,197 confirms the bears and opens $56,747. Anything in between is range repair, and the patient approach is to let price choose. Corrections like this one are where the next leg is built, and disciplined traders who wait for the level to confirm rather than guessing the bottom tend to be the ones still standing when the trend finally turns.
Frequently Asked Questions: BTCUSD Analysis
What happens if BTCUSD breaks above $64,039 resistance?
A daily close above $64,039 would be the first real crack in the higher-timeframe downtrend and would open the door toward $66,431 and potentially $68,881. It would also turn the deeply oversold daily RSI of 15.81 from a falling-knife warning into a genuine reversal signal, since buyers would have reclaimed the level the bears are defending.
Is the daily RSI at 15.81 a buy signal for BTCUSD right now?
Not on its own. An RSI of 15.81 confirms BTCUSD is deeply oversold, but the 4-hour ADX at 75.73 shows an extraordinarily strong downtrend that can keep pushing price lower despite the stretched reading. The oversold level raises the odds of a counter-trend bounce, but a daily close above $64,039 is needed before treating it as a reversal rather than a dip in a downtrend.
Should I buy BTCUSD at current levels of $61,485?
This is a watch-zone, not a confirmed setup. The condition that would justify a long is a daily close above $64,039, which would signal the downtrend is breaking; alternatively, a clear defense of the $59,197 support with shrinking downside follow-through. A daily close below $59,197 would invalidate the bounce thesis and point toward $56,747.
How will next week's US CPI affect BTCUSD?
May CPI is expected near 0.5% month over month, and a hot print would likely extend the dollar strength from DXY at 99.80 that pressured Bitcoin into Friday's close, keeping BTCUSD capped below $64,039. A softer-than-feared reading would ease dollar pressure and give the oversold bounce room to test that resistance.
The next several sessions will resolve a rare standoff between a deeply oversold tape and a stubborn downtrend, and the levels are drawn clearly enough that traders do not need to guess. Volatility creates opportunity, and those who wait for $64,039 or $59,197 to confirm direction will be the ones positioned correctly when Bitcoin finally picks a side.
Track markets in real-time
AI-powered analysis, technical indicators and real-time price data.
Join Our Telegram Channel
Breaking market news, AI analysis and trading signals instantly.
Join Channel