Here is the uncomfortable truth most people scrolling through green candles tonight will miss: Bitcoin can rally 4% in a single session and still be sitting in one of the most bearish daily structures it has printed in months. That is exactly where BTCUSD finds itself at $63,309.
BTCUSD today analysis is a study in contradiction. On the intraday charts, the bulls grabbed the wheel and pushed price up +4.27% (+2,594 points), with the day's range stretching from 60,432 all the way to 62,958 before the close pushed even higher. On the daily chart, the trend reading is still down with a 96% strength score and an RSI buried at 26.63, deep in oversold territory. Both of those things are true at the same time, and reconciling them is the whole game right now.
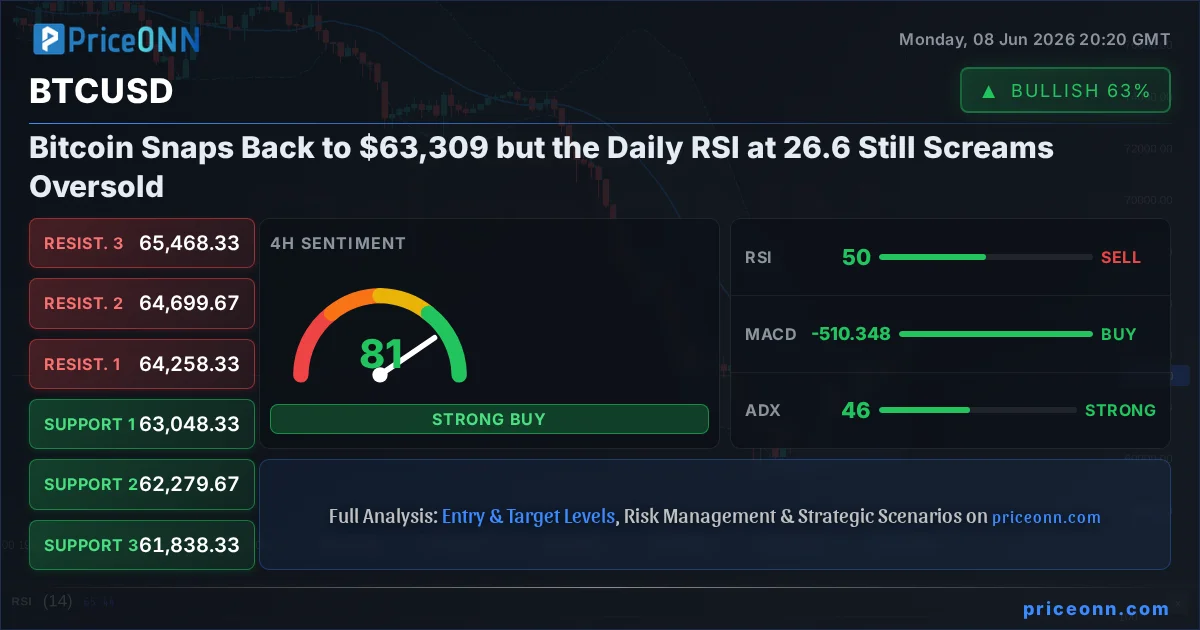
- BTCUSD bounced +4.27% to $63,309 intraday, but the daily RSI at 26.63 confirms the broader move is still an oversold slide, not a confirmed reversal.
- The 4-hour ADX at 46.4 is the standout reading: it signals a genuinely strong, committed trend rather than random chop, which is why this bounce has teeth.
- First resistance sits at 63,663 (1H) with the real ceiling at 64,258 and 64,479; lose 63,048 on the 4H and the air gets thin down to 62,280.
- Risk-off flows dominate: DXY firmed +0.58% to 99.77 and Iran-Israel headlines drove safe-haven demand, leaving crypto caught between deleveraging and a bargain-hunting bid.
Time Horizon: This commentary is geared toward swing traders working the 4-hour and daily charts over the coming sessions, not intraday scalpers.
Why the 4-Hour ADX at 46.4 Changes the Whole Conversation
Let me be direct: most relief bounces in a downtrend are noise. They fade as fast as they appear, trapping anyone who chased the candle. This one is different, and the reason is buried in a single number that most retail traders never look at.
The 4-hour ADX is reading 46.4. That is not a casual number. Anything above 25 tells you a trend has conviction, and a print in the mid-40s means the current directional push is strong and committed. Pair that with the 4-hour MACD sitting in positive momentum above its signal line, and the Stochastic at K=76.25 over D=71.66 flashing a bullish cross, and you get a coherent picture on that timeframe: buyers stepped in with force, not hesitation. The 4-hour signal tally backs it up at 6 buy against 2 sell. This is what a real bounce looks like under the hood, which is precisely why BTCUSD trend analysis demands you respect it even if your bias is bearish.
But here is where multi-timeframe analysis earns its keep. Zoom out to the daily and the story flips. The daily ADX at 42.71 is also strong, except it is measuring strength of the downtrend, not the bounce. Same indicator, two timeframes, opposite directions. That is the tension every BTCUSD trader has to price in tonight.
When the 4H trend and the daily trend point opposite ways, you are trading a counter-trend bounce. These pay well when they work and punish hard when they fail. Position size accordingly, because the daily structure has not flipped yet.
What the Oversold Daily RSI Really Tells Us About BTCUSD
An RSI of 26.63 on the daily chart is the kind of reading that makes contrarians lean in. Historically, when momentum gets stretched this far below the 30 line, the rubber band tends to snap back, and today's +4.27% candle is arguably that snapback beginning. The daily Stochastic agrees, pinned at K=17.82 and D=12.12, both deep in oversold mud.
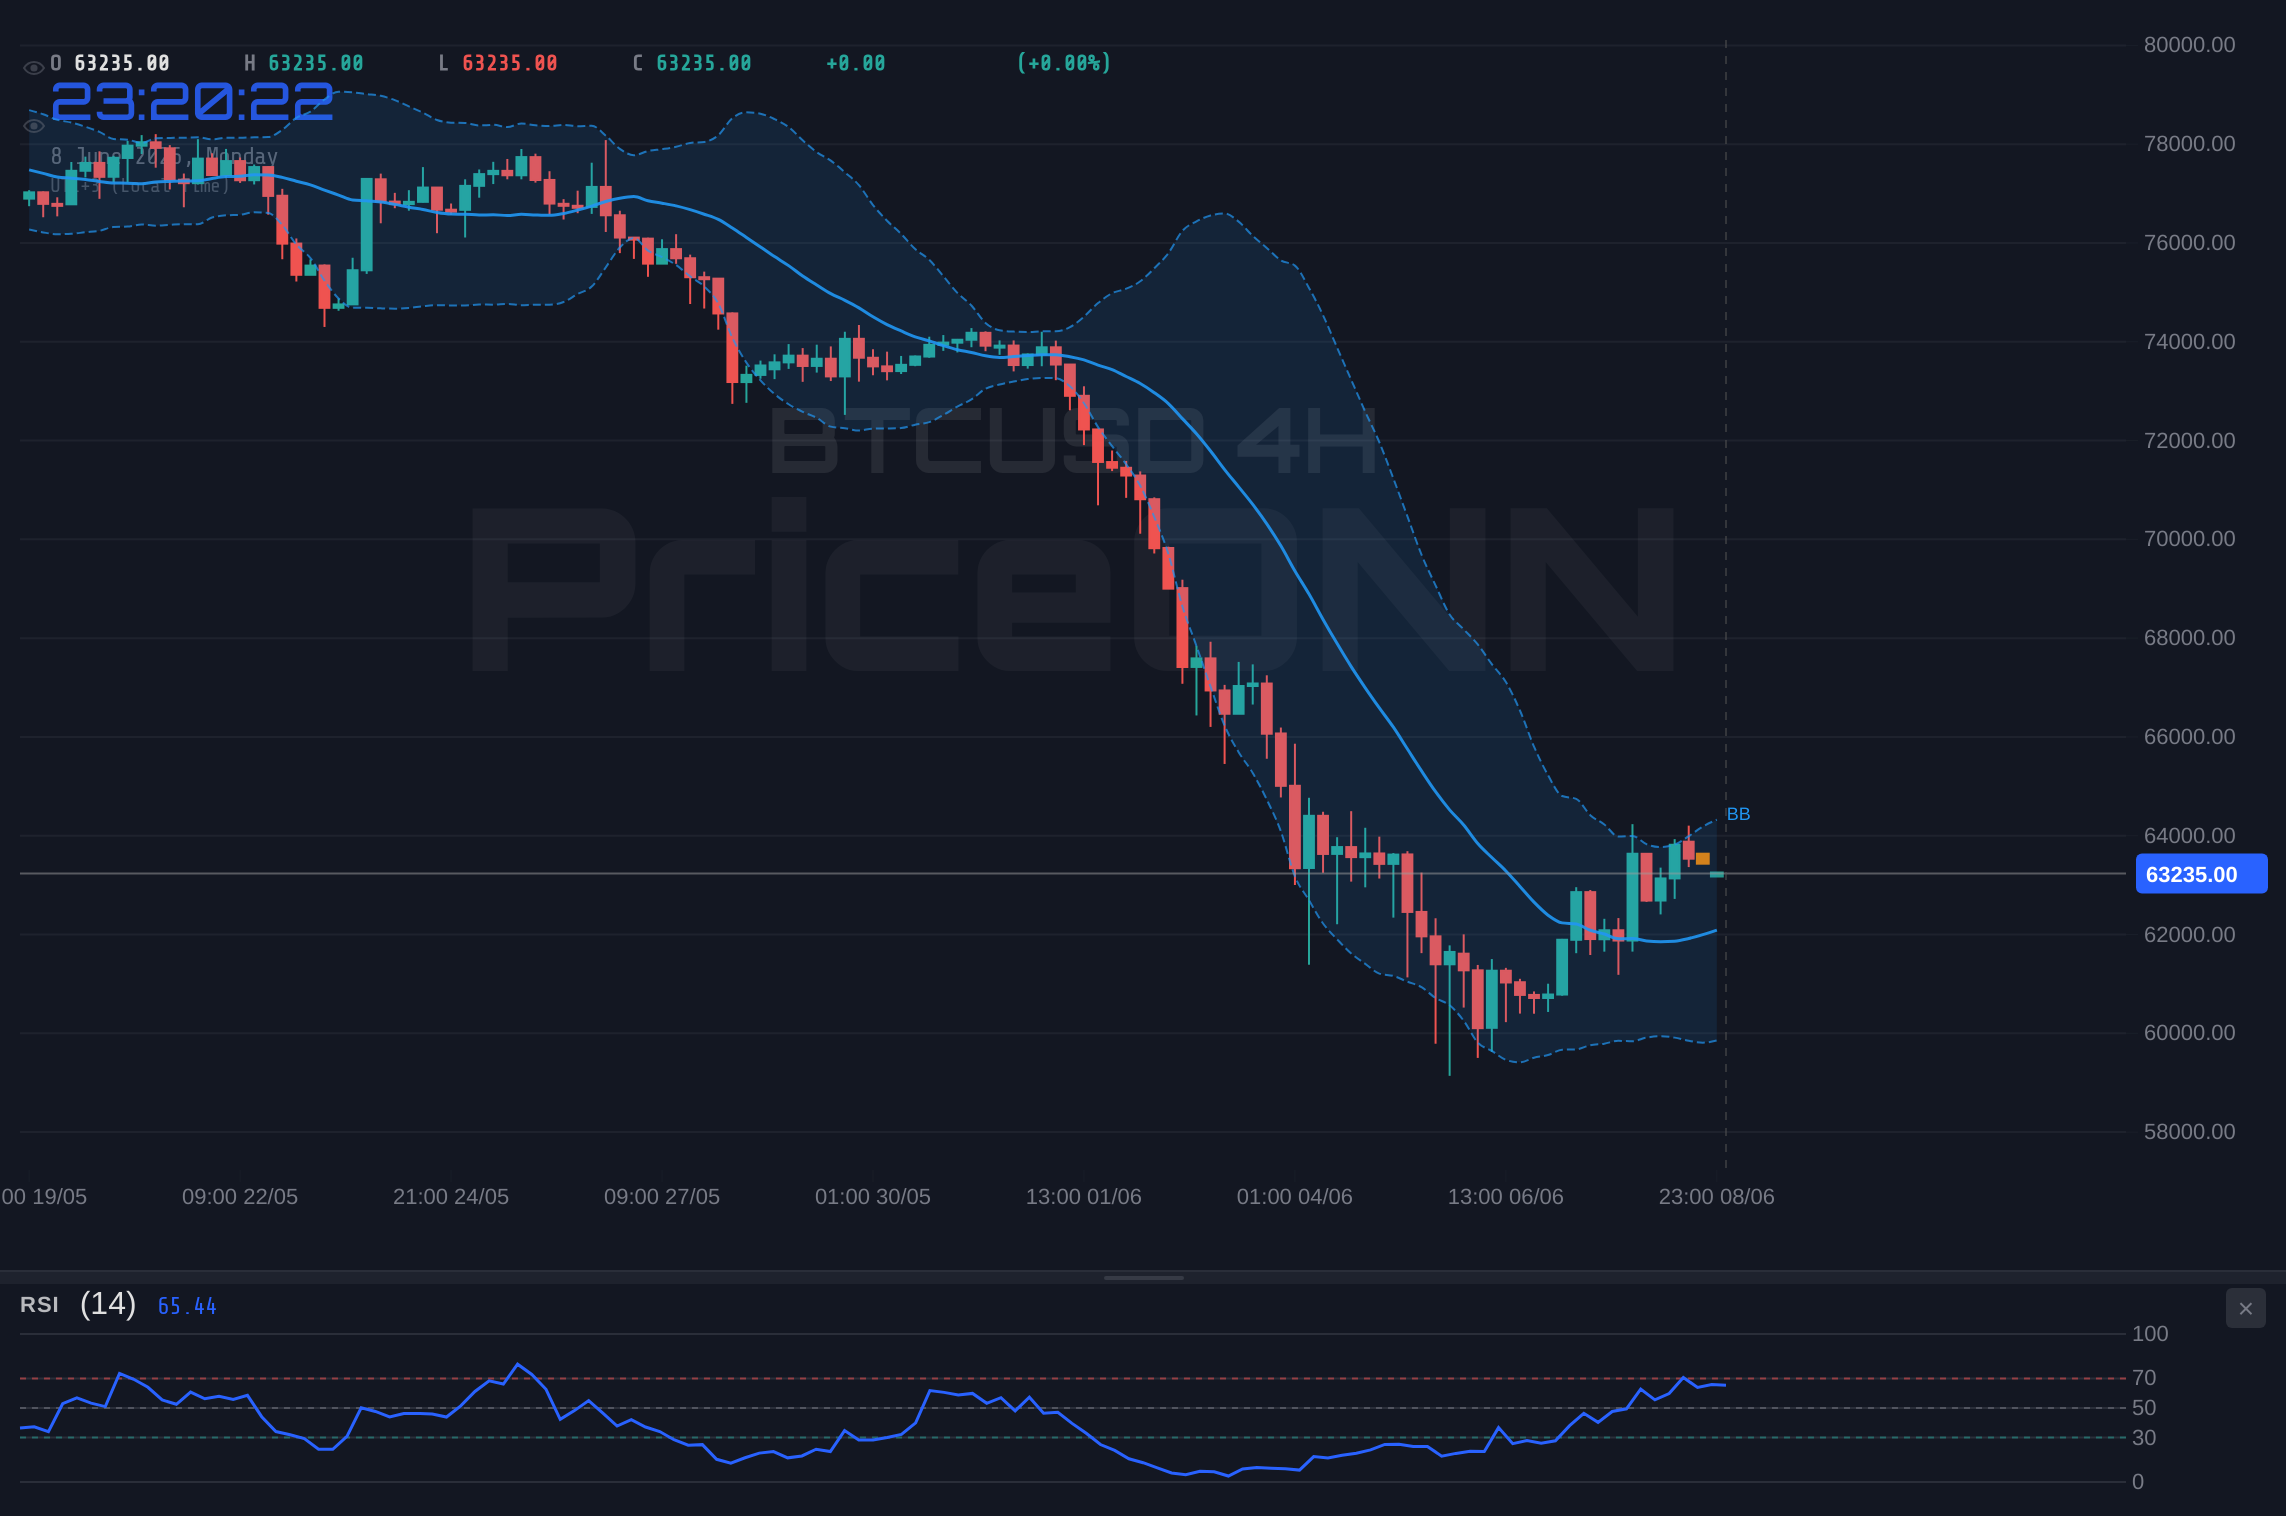
Now this is where you need to pay attention, because oversold does not mean buy. It means stretched. In a strong downtrend, RSI can sit oversold for days while price keeps grinding lower, punishing everyone who confused a cheap chart for a cheap entry. The daily MACD is still in negative momentum below its signal line, and price is hugging the lower half of the daily Bollinger structure. So what we have is a market that is oversold and bouncing, but has not yet produced the higher high or the daily close above resistance that would confirm a trend change.
The honest read on BTCUSD RSI right now: the daily 26.63 is a green flag for a bounce, not a green light for a trend reversal. Those are two very different trades with two very different risk profiles.
The Levels That Actually Matter for BTCUSD Support and Resistance
Strip away the noise and the map is clean. On the 1-hour chart, immediate support is stacked tightly at 63,308, 63,146, and 62,953, which tells you buyers are defending right under the current price. Drop to the 4-hour and the structural floor is 63,048, then 62,280, then 61,838. Lose that 4H zone on a closing basis and the oversold daily supports at 59,477 come into play fast.
On the upside, the first hurdle is 63,663 (1H resistance), and clearing it opens the door to the heavier confluence at 64,258 (4H) and 64,479 (daily). That 64,258 to 64,479 band is the line in the sand. A 4-hour close above it would be the first real evidence that the daily downtrend is being challenged rather than just paused. Until then, every push into that zone is a place where sellers can reload.
BTCUSD News Impact: Why This Bounce Is Tangled Up in Geopolitics
You cannot read Bitcoin's tape in isolation tonight, because the entire risk complex is being pushed around by the same forces. According to reporting circulating Monday, markets found temporary relief after Iran's military declared the first wave of its strikes against Israel complete, yet the open question of a second wave is keeping a lid on risk appetite. That on-again, off-again fear is exactly the kind of environment that produces violent two-way moves in crypto.
The dollar tells the story cleanly. The Dollar Index firmed +0.58% to 99.77, with its daily trend reading up at 90% strength and RSI at 64.99. A strengthening dollar is normally a headwind for Bitcoin, yet BTCUSD rallied anyway, which is notable. When an asset rises against a rising dollar, it often signals that dedicated buyers are stepping in for their own reasons rather than simply riding a weak-dollar tailwind.
Equities, meanwhile, are a mess of crosscurrents. The S&P 500 closed up +0.74% at 6,572, but the Nasdaq 100 cratered -3.05% to 29,411. That divergence, a heavy tech selloff alongside a firmer broad index, screams rotation and risk reduction rather than clean risk-on. Coverage this week framed the Nasdaq's slide as the possible start of a correction after the Fed's rate move, and the macro calendar is stacked: US CPI leads a high-stakes week with Fed hike expectations building. For BTCUSD, a hotter CPI print that cements hike bets would strengthen the dollar further and pressure this bounce. That is the catalyst risk sitting directly in front of us.
Notice the crypto internals. Ethereum exploded +8.19% to $1,682 today, outrunning Bitcoin's +4.27%. When the higher-beta asset leads a bounce this hard, it usually marks a sharp short-covering and bargain-hunting episode rather than a slow, steady accumulation base. Treat the move with the respect a squeeze deserves, and the skepticism a squeeze earns.
BTCUSD Trading Signals: How Different Traders Should Play This
This is where the multi-timeframe split becomes actionable instead of academic. The right move depends entirely on which clock you trade.
For the Swing Trader
Your battleground is the 64,258 to 64,479 resistance band. A clean 4-hour close above it, ideally with the daily RSI climbing back through 35 to 40, would be your confirmation that the oversold bounce is maturing into something more durable. Front-running it here, while the daily MACD is still negative, is a lower-probability bet. Patience looks like it will be rewarded if you wait for that close.
For the Range Trader
The 4-hour structure between 63,048 support and 64,258 resistance is a defined box. As long as price respects those edges, fading the extremes with tight invalidation is viable. The moment a 4-hour candle closes outside the box, the range trade is dead and you stand aside.
For the Longer-Term Investor
The daily RSI at 26.63 marks the zone where long-term accumulators historically get interested, but the disciplined approach is to scale rather than lunge. The daily downtrend at 96% strength has not been broken. Building a position in tranches into the 59,477 area, while keeping powder dry, respects both the opportunity and the very real risk that oversold gets more oversold.
BTCUSD Price Forecast: Three Scenarios Into the CPI Print
Given the strong-but-conflicting trend readings and the CPI catalyst dead ahead, here is how the probabilities stack up. Note the bearish tilt: the daily structure still has the heavier vote.
Bearish: Downtrend Reasserts on a Hot CPI
45% ProbabilityBullish: Oversold Snapback Extends
35% ProbabilityNeutral: Coiling Beneath Resistance
20% ProbabilityUS CPI headlines a high-stakes week with Fed hike expectations building. A surprise in either direction can override the technical map in seconds. Size positions with the print in mind, and do not marry a bias going into the release.
The One Thing to Watch Right Now
Forget the noise of the next few hourly candles. The single most important tell for BTCUSD over the coming sessions is whether buyers can produce a 4-hour close above the 64,258 to 64,479 band. That is the level where this oversold bounce either graduates into a genuine challenge of the daily downtrend, or gets rejected and folds back toward 62,280. Everything else is secondary. Mark that zone, set your alerts, and let price tell you which trade is real.
Frequently Asked Questions: BTCUSD Analysis
What happens if BTCUSD breaks above the $64,479 resistance?
A clean 4-hour close above 64,479 would be the first real evidence that the daily downtrend at 96% strength is being challenged rather than paused, opening targets at 64,699 and 65,468. Until that close prints, the zone remains a spot where sellers can reload.
Is the daily RSI at 26.63 a buy signal for BTCUSD right now?
An RSI of 26.63 is deeply oversold and supports a bounce, which today's +4.27% move to $63,309 delivered, but in a strong downtrend RSI can stay oversold for days. Wait for a daily RSI recovery through 35 to 40 plus a close above resistance before treating it as a trend-change buy.
Why is the 4-hour ADX at 46.4 important for BTCUSD?
An ADX of 46.4 confirms the 4-hour bounce is a strong, committed trend rather than chop, backed by positive 4H MACD and a bullish Stochastic cross at K=76.25 over D=71.66. The catch is that the daily ADX at 42.71 measures downtrend strength, so the two timeframes conflict.
How will this week's US CPI affect BTCUSD?
CPI leads a high-stakes week with Fed hike expectations building, and a hotter print would likely firm the dollar above 99.77 and pressure Bitcoin back toward 62,280. A softer print could extend the snapback toward 64,479 and beyond, so expect volatility to spike around the release.
Volatility like this is not the enemy; it is the opportunity, provided you let the market come to your level instead of chasing it. The daily chart is bruised and the 4-hour chart is bouncing, and that split is precisely why discipline beats conviction here. Mark 64,479 to the upside and 63,048 to the downside, wait for your confirmation, and remember that the market almost always offers a second entry to those patient enough to wait for it.
Track markets in real-time
AI-powered analysis, technical indicators and real-time price data.
Join Our Telegram Channel
Breaking market news, AI analysis and trading signals instantly.
Join Channel