Here is the uncomfortable question every BTCUSD trader carried into the weekend: when the daily RSI prints 15.47, are you looking at a bottom or a bear trap? Bitcoin settled Friday's close at $61,071, down 4.04% on the day and roughly 1,700 dollars below where it changed hands at the start of the session. The chart is screaming oversold across nearly every timeframe. The trend, meanwhile, is screaming the opposite: a 4-hour ADX reading of 73.94 is one of the most aggressive trend strengths you will ever see, and it points straight down.
That tension is the whole story for BTCUSD this week. This BTCUSD weekly outlook is not about picking a direction and marrying it. It is about mapping the exact levels that decide which way the next leg breaks, and being honest about the odds.
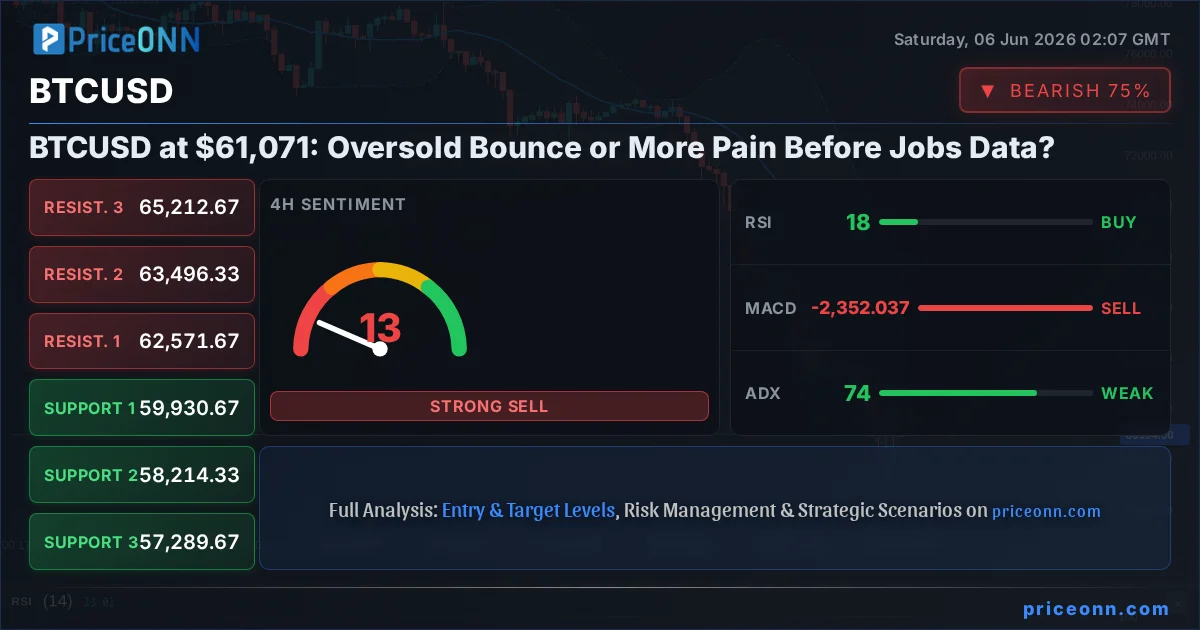
- BTCUSD closed the week at $61,071, a 4.04% drop, with the daily range spanning 59,139 to 63,981.
- The daily RSI sits at 15.47 and the 4-hour RSI at 18.10: both deeply oversold, yet the 4-hour ADX at 73.94 confirms an extremely strong downtrend still in control.
- The line in the sand is the 4-hour pivot zone at 62,571.67. A reclaim opens room toward 65,873.33; failure keeps 59,155.67 and 57,289.67 in play.
- Ethereum's 10.73% collapse to 1,582.42 and a stronger dollar (DXY at 99.80) framed a clean risk-off week, with Nasdaq 100 down 5.37% reinforcing the correlation.
Time Horizon: This is a weekend weekly review with a focus on the coming week. Markets were closed at the time of writing, so all levels reference Friday's close, not live prices.
What Last Week Actually Did to BTCUSD
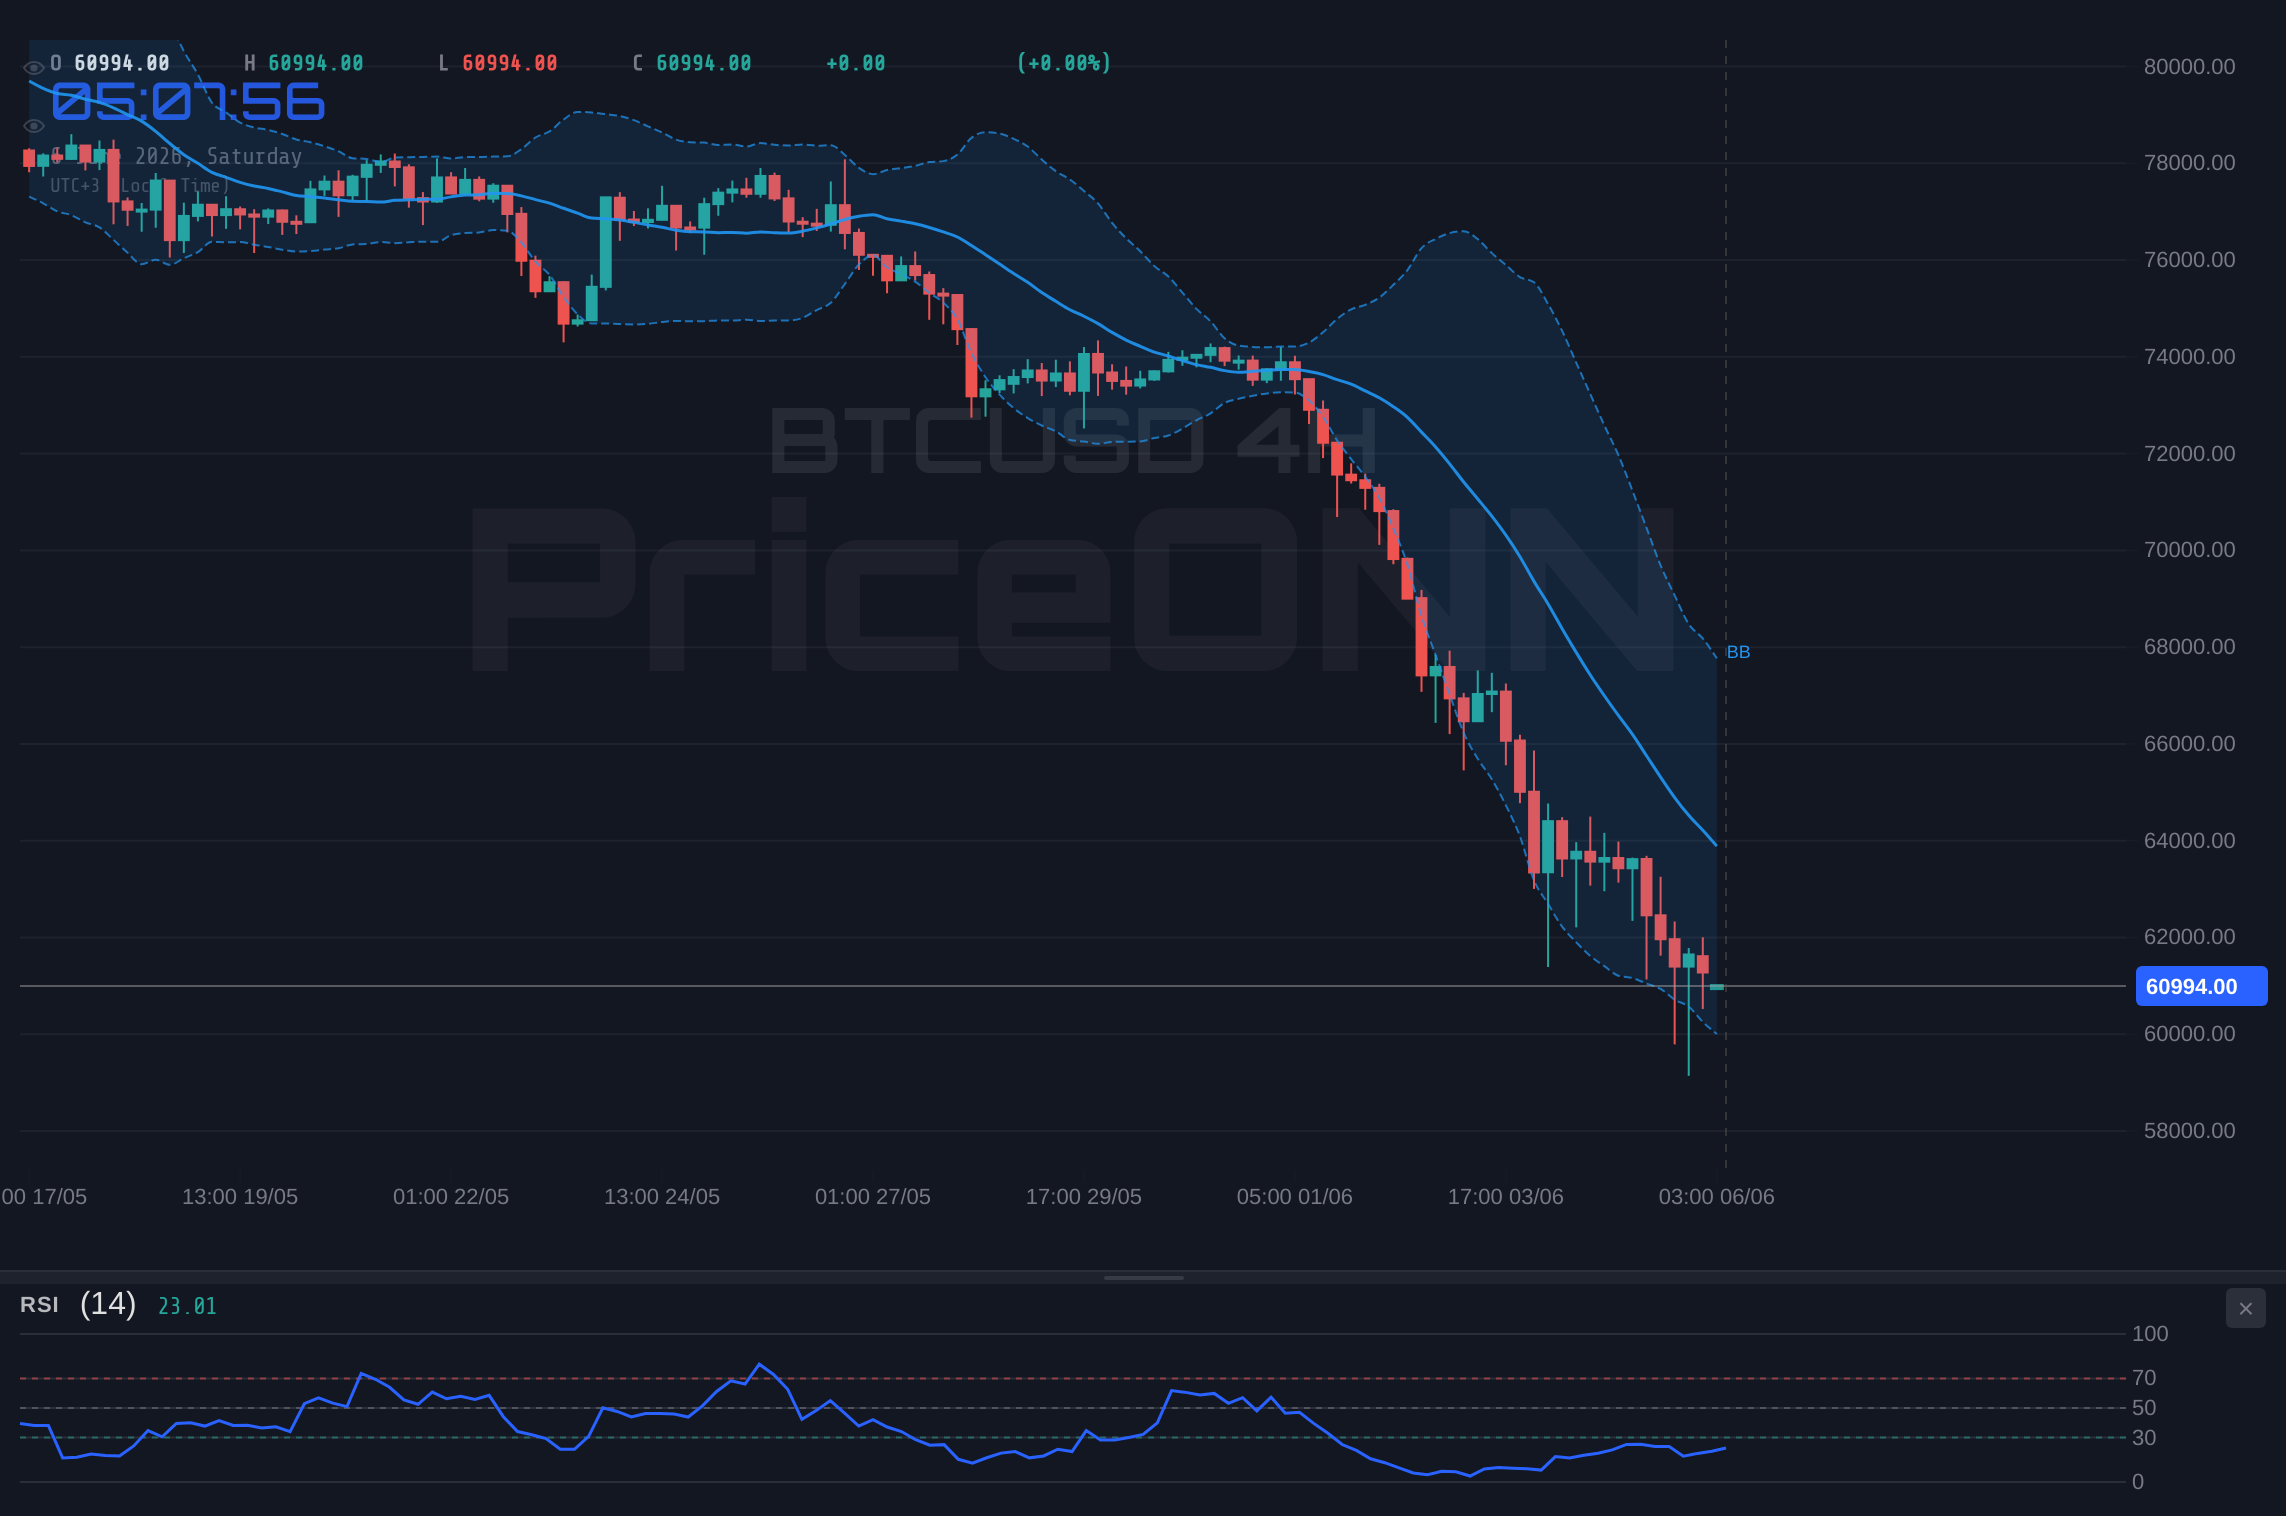
Rewind the tape. BTCUSD spent the early part of the week trying to defend the low-64,000s, and by Friday it had given up nearly 2,900 dollars from the session high of 63,981 to print a low of 59,139 before clawing back to 61,071. That is not orderly profit-taking. That is a liquidity grab that swept stops below 60,000 and then pulled price back above it, which is exactly why the 1-hour structure looks less broken than the higher timeframes.
The bigger context matters here. This was a broad risk-off week, and crypto did not sell off in a vacuum. The dollar index strengthened to 99.80, up 0.57%, after a much stronger-than-expected US employment report. As Reuters reported, the dollar rose broadly as strong payrolls reinforced Fed patience, with USD/JPY clearing the 160 handle. When the dollar is bid and the Fed-cut narrative gets pushed further out, the highest-beta corners of the market feel it first. Bitcoin is still one of those corners.
And the equity tape confirmed the mood. The Nasdaq 100 closed down 5.37% at 28,804.39, a brutal session for high-multiple tech. The S&P 500 actually finished green at 6,572.87, up 0.74%, which tells you the damage was concentrated in growth and risk rather than the whole market. Bitcoin traded like a Nasdaq cousin this week, not like digital gold. That correlation is the single most important fundamental backdrop for the coming sessions.
When BTCUSD trades in lockstep with the Nasdaq during a dollar-strength week, oversold readings can stay oversold. A 15.47 daily RSI is rare, but in a confirmed downtrend it is a sign of momentum, not an automatic buy signal.
The Crypto-Specific Picture: It Was Not Just Bitcoin
If you only watched BTCUSD, you missed how violent the rotation was underneath it. Ethereum cratered 10.73% to 1,582.42, more than double Bitcoin's percentage loss. When ETH bleeds nearly three times harder than BTC, capital is not rotating within crypto: it is leaving the asset class. That kind of move mechanically lifts Bitcoin dominance, because BTC holds value relatively better in a flush. A rising dominance reading during a selloff is the classic signature of a risk-reduction phase, where traders trim altcoin exposure first and ask questions later.
On the flow side, the read is straightforward even without a fresh on-chain print in hand: a 4%-plus daily drop on Bitcoin with a 10%-plus drop on Ethereum is consistent with leveraged long liquidations and defensive exchange inflows rather than spot accumulation. When coins move toward exchanges during a slide, it usually signals intent to sell, and that pressure tends to cluster around the same support shelves the technicals are flagging. Until we see that flow reverse, with coins draining back off exchanges into cold storage, the path of least resistance stays heavy.
There was a constructive headline in the mix. Bloomberg-tracked reporting noted that Tether, the largest stablecoin issuer, is backing a major investment in Georgia and plans to launch a local digital currency initiative. Stablecoin expansion and issuer balance-sheet growth are quietly bullish for the long-term plumbing of the market, because stablecoin supply is the dry powder that eventually buys dips. But let us be clear: that is a structural story, not a this-week catalyst. It does not stop a momentum-driven slide, and pretending it does would be wishful thinking.
Why $62,571 Is the Line in the Sand
Every multi-scenario map needs an anchor, and for BTCUSD that anchor is the 4-hour pivot at 62,571.67. Price closed the week below it at 61,071, which means the bears own the near-term structure. Above that level, the bulls get a seat at the table. Below the immediate support shelf, the sellers press their advantage. Let me walk through the three ways this resolves, with the exact triggers for each.
Before the scenarios, the indicator confluence deserves a clear-eyed read, because the signals conflict and that conflict is the entire setup. On the daily, RSI at 15.47 and Stochastic at 9.66/13.74 are about as oversold as Bitcoin ever gets. The 4-hour RSI at 18.10 echoes it. Normally that screams mean-reversion bounce. But the 4-hour ADX at 73.94 and the daily ADX at 38.26 confirm a powerful, committed downtrend, and MACD remains negative and below its signal line on both the daily and 4-hour. The one flicker of life: the 1-hour MACD has turned positive, hinting at a short-term momentum stabilization right at the lows. So the honest interpretation is this: oversold plus strong-trend equals coiled spring, but the spring needs a trigger before you trust it. Oversold alone, in an ADX-73 environment, has burned every knife-catcher who ignored the trend.
| Indicator | Value | Signal | Interpretation |
|---|---|---|---|
| RSI (14) Daily | 15.47 | Oversold | Stretched to the downside, bounce risk rising |
| RSI (14) 4H | 18.10 | Oversold | Confirms exhaustion on the intraday tape |
| ADX 4H | 73.94 | Very strong trend | Downtrend is dominant, not fading yet |
| MACD Daily | Negative | Below signal | Momentum still favors sellers |
| Stochastic Daily | 9.66 / 13.74 | Oversold | No bullish cross confirmed yet |
| MACD 1H | Positive | Above signal | Early sign of short-term stabilization |
The Bull's Roadmap: What a Reclaim Would Take
Here is where it gets interesting for the dip-buyers. The bullish case does not start with the oversold RSI. It starts with price action. The first hurdle is the 1-hour resistance at 61,519, then the cluster at 61,763 and 61,993. None of that matters in the bigger picture until BTCUSD reclaims the 4-hour pivot at 62,571.67 on a closing basis. That is the trigger that flips the near-term structure.
IF Bitcoin can close a 4-hour candle back above 62,571.67, THEN the door opens toward 63,496.33 and the heavier 4-hour resistance at 65,212.67, which lines up neatly with the daily resistance at 65,873.33. That confluence zone in the high-65,000s is the real bull target, because it is where the 4-hour and daily resistance shelves overlap. A daily close above 65,873.33 would be the signal that the oversold bounce has matured into a genuine trend reversal rather than a relief rally.
The fuel for this scenario is the oversold confluence: when daily RSI is at 15.47 and Stochastic is curling near 9.66, the market is one catalyst away from a violent short-covering squeeze. A softer US inflation print next week, a stabilizing Nasdaq, or simply a pause in dollar strength from the 99.80 DXY level could light that fuse. This is the patience-rewarded setup: you do not chase it, you wait for the 62,571.67 reclaim to confirm it. The market always gives a second chance, and forcing a long before the trigger is how oversold turns into more oversold.
Where Bears Take Control: The Downside Map
Now flip it. The bearish path is, frankly, the one the trend-following indicators favor right now. The immediate support stack on the 1-hour sits at 60,815 and then 60,571. Below that, the 4-hour support at 59,930.67 is the gateway to the danger zone. That level held as the rough area of Friday's recovery, so losing it on a closing basis would signal the dip-buyers have failed.
IF BTCUSD breaks and closes below 59,930.67, THEN the next magnets are the daily support at 59,155.67 and the 4-hour support at 58,214.33. A sustained break there exposes the deeper shelf at 57,289.67 and the daily support at 56,923.33. That is roughly a 7% downside from Friday's close, and in an ADX-73.94 environment, those moves can happen fast once the level cracks. The 4-hour ADX is the tell: trends this strong do not usually reverse on the first oversold reading, they reverse after a divergence forms and momentum visibly stalls. We do not have that divergence confirmed yet.
The macro backdrop reinforces this scenario. With the dollar index at 99.80 and the 1-hour DXY RSI at an extreme 80.95, the dollar is itself overbought and could pause, which would help Bitcoin. But the daily DXY signal is still a clean buy with all eight signals bullish, so betting on dollar weakness is a counter-trend wager of its own. As long as the dollar stays firm and the Nasdaq stays heavy after its 5.37% drop, the macro wind blows against BTCUSD.
The 56,923.33 to 59,155.67 zone is where this entire selloff gets decided. That is the daily support band. If buyers are going to make a stand and turn the deeply oversold readings into a reversal, that is the logical battleground. Lose it on a daily close, and the structure shifts from correction to something more serious.
The Waiting Game: What Keeps Price Stuck
There is a third path, and it might be the most likely of all in the immediate term: chop. After a 4% flush that already swept the lows, BTCUSD could simply consolidate between the 4-hour support at 59,930.67 and the 4-hour pivot at 62,571.67. In this range-bound squeeze, the oversold indicators slowly reset higher, the MACD compresses back toward its signal line, and the market coils while it waits for a macro catalyst.
This is what a healthy basing process looks like after a capitulation candle. The 1-hour MACD already turning positive supports the idea that the very-short-term selling has paused. A few days of sideways grind would let the daily RSI lift off 15.47 without price having to rally hard, which actually sets up a cleaner launch later. The catch: range-bound conditions punish impatient traders on both sides, chopping up anyone who treats every poke at the edges as a breakout. In this scenario, the right move is to do nothing until price commits beyond one of the two boundaries.
Three Roads, Side by Side
Bearish: The Trend Wins (Lower Lows)
50% ProbabilityNeutral: The Coiling Range
30% ProbabilityBullish: Oversold Snaps Back
20% ProbabilityWhich Scenario Is Most Likely, and Why
Putting weight on it: the bearish-to-neutral outcomes carry the higher probability into the new week, call it a combined 80% between the two, with a clean bullish reversal the lower-odds path at roughly 20%. That is not pessimism, it is respect for the data. You do not fade an ADX of 73.94 on the 4-hour with anything less than a confirmed trigger. The single most likely near-term path is actually the range, because markets that just swept a major round number tend to digest before they decide. But the directional risk, if the range breaks, leans down while the dollar holds firm and equity risk appetite stays fragile after the Nasdaq's 5.37% hit.
The honest caveat: this entire bearish lean fails if BTCUSD reclaims 62,571.67 and holds it, because the oversold fuel underneath is genuinely explosive. A 15.47 daily RSI does not stay there forever. When it unwinds, it can unwind fast. That is precisely why this is a WATCH_ZONE and not a sell-at-market call. The setup is not ripe in either direction until price picks a side of the 59,930.67 to 62,571.67 box.
A daily close back above 62,571.67, ideally paired with a Stochastic bullish cross out of the 9.66 oversold zone and the daily MACD curling toward its signal line, would be the confluence that opens the door for a move toward 65,873.33. Until that close prints, the deeply oversold RSI is a warning of stretched conditions, not a green light.
The Macro Calendar: Why Next Week's Data Is the Real Catalyst
Technicals set the levels, but macro decides which way they break. Last week's much-stronger-than-expected US jobs report already did its damage: it firmed the dollar, reinforced Fed patience, and pushed rate-cut hopes further down the road. That is the backdrop crypto inherits. As one widely-followed week-ahead preview framed it, the Fed countdown is now on, with US inflation data the next major hurdle and geopolitical risk still simmering in the background.
For BTCUSD, the read is simple. A hotter inflation print next week would extend dollar strength and keep the Nasdaq correlation working against Bitcoin, favoring the bearish map toward 59,155.67 and below. A cooler print would do the opposite, taking pressure off the 99.80 DXY and giving the oversold bounce the catalyst it needs to challenge 62,571.67. The high-importance USD events on the calendar, including the forecasts pointing to readings around 110, 50.9, and a 4.3 unemployment figure, are the data points that will resolve this standoff. Until that data lands, caution is the disciplined stance.
This is also where the different trader profiles diverge. The scalper cares about the 1-hour box between 60,571 and 61,519 and the early-stabilization MACD flip, trading the edges with tight risk. The swing trader is sitting on hands, waiting for the 4-hour close above 62,571.67 or below 59,930.67 to define the next multi-day leg. The long-term accumulator sees a daily RSI at 15.47 and a deeply discounted price relative to recent ranges, and treats the 56,923.33 to 59,155.67 daily support band as a zone to scale into, not a place to panic-sell. Same chart, three completely different jobs.
Key Levels for the Week Ahead
What I'm Watching This Week
- The 62,571.67 reclaim: A 4-hour close back above this pivot is the single most important bullish trigger. No close, no trend change.
- The 59,930.67 floor: Lose it on a closing basis and the daily support band at 59,155.67 down to 56,923.33 comes into focus quickly.
- US inflation data and the dollar: With DXY at 99.80 and its 1-hour RSI overbought at 80.95, watch for any dollar pause. The inflation release is the catalyst that resolves the oversold standoff.
Frequently Asked Questions: BTCUSD Analysis
What happens if BTCUSD breaks above the $62,571.67 pivot?
A 4-hour close above 62,571.67 would flip the near-term structure bullish and open the door toward 63,496.33 and the daily resistance confluence at 65,873.33. Until that close prints, the deeply oversold daily RSI of 15.47 is a sign of stretched conditions, not a confirmed reversal.
Is the daily RSI at 15.47 a buy signal for BTCUSD right now?
Not on its own. An RSI of 15.47 is deeply oversold, but the 4-hour ADX at 73.94 confirms a very strong downtrend, and trends this powerful rarely reverse on the first oversold reading. The valid long setup requires a reclaim of 62,571.67 plus a Stochastic bullish cross to confirm momentum has actually turned.
Where is the key support if BTCUSD keeps falling from $61,071?
The first defensive shelf is the 4-hour support at 59,930.67, followed by the daily support at 59,155.67. A break of those exposes 58,214.33 and the deeper daily band at 57,289.67 to 56,923.33, which is the zone where buyers would need to make a stand.
How will next week's US inflation data affect BTCUSD?
A hotter inflation print would likely extend dollar strength from the 99.80 DXY level and keep Bitcoin's Nasdaq correlation bearish, favoring a test of 59,155.67. A cooler print could relieve dollar pressure and give the oversold bounce the fuel to challenge 62,571.67. The data is the catalyst that resolves the current standoff.
The setup into the new week is a classic coiled spring: maximum oversold pressure pressing against a still-dominant downtrend, with the dollar and a fragile equity tape tipping the odds slightly toward the bears until proven otherwise. Volatility like this creates opportunity for those who wait for confirmation instead of guessing the turn. Watch 62,571.67 and 59,930.67, let the inflation data do the heavy lifting, and let price tell you which scenario won before you commit. The market always gives a second chance to the patient.
Track markets in real-time
AI-powered analysis, technical indicators and real-time price data.
Join Our Telegram Channel
Breaking market news, AI analysis and trading signals instantly.
Join Channel