Is this rally real, or are bulls walking into a trap? With Nasdaq100 today analysis pointing to a tense standoff at $29,345.50 after a sharp 1.88% intraday surge, the central question is whether the index can push through the critical $29,867.11 daily resistance level - or whether the building tide of Fed rate hike expectations will crush the move before it even gets started.
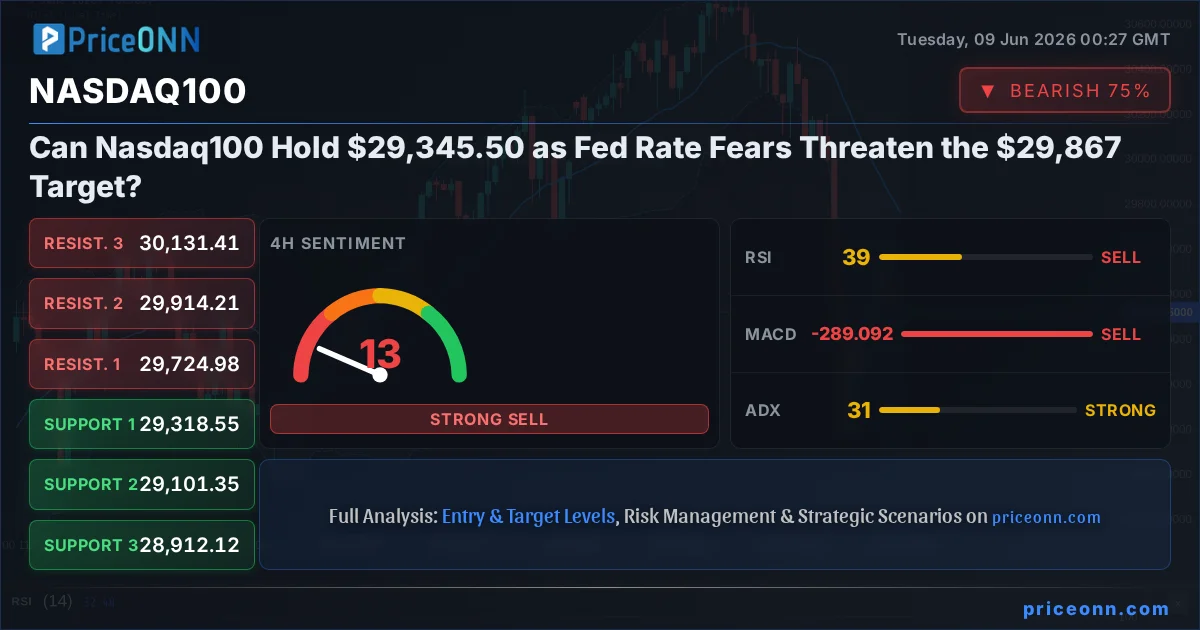
- Nasdaq100 surged 1.88% to $29,345.50, approaching the key daily resistance at $29,867.11 - a level bulls must clear to signal a genuine trend reversal.
- RSI on the 4-hour chart sits at 38.85, suggesting the index was approaching oversold territory before today's bounce, but MACD remains in negative territory - momentum has not fully confirmed the move.
- ADX at 31.49 on the 4H timeframe signals strong trend conditions, but that trend has been bearish in recent sessions - the bull case requires a sustained hold above $29,444.86 resistance.
- Fed rate hike expectations are building ahead of a critical US CPI release, making this rally particularly vulnerable to a sharp reversal if inflation data disappoints.
Time Horizon: This analysis focuses on the short-to-medium term outlook with primary emphasis on the 1H, 4H, and Daily timeframes over the next 2-5 trading sessions.
The Fed is the Elephant in the Room
Let us be direct about what is really driving markets this week. The week ahead is dominated by a single overriding question: how much of the recent oil shock and strong employment data has already been priced into Federal Reserve rate expectations? Bloomberg and CNBC analysts have been flagging this tension for days, and Friday's jobs report appears to have settled the debate - the US labor market remains stubbornly resilient, and that means the Fed's hands are far from tied when it comes to further tightening.
Strong US employment data raised rate fears sharply heading into this week. When jobs numbers come in hotter than expected, it does not just affect the dollar - it sends a direct message to equity markets that borrowing costs are likely to stay elevated for longer. For the Nasdaq100, which is disproportionately weighted toward high-growth, high-valuation technology companies, this is about as unfavorable a backdrop as you can find. These are businesses whose future earnings get discounted at higher rates, meaning every tick higher in rate expectations chips away at their theoretical fair value.
And yet, here we are: looking at a nearly 2% rally on a day when rate fears are very much alive. Something interesting is happening beneath the surface, and the Nasdaq100 price forecast depends entirely on understanding what that something is.
Why Today's 1.88% Rally Deserves Scrutiny
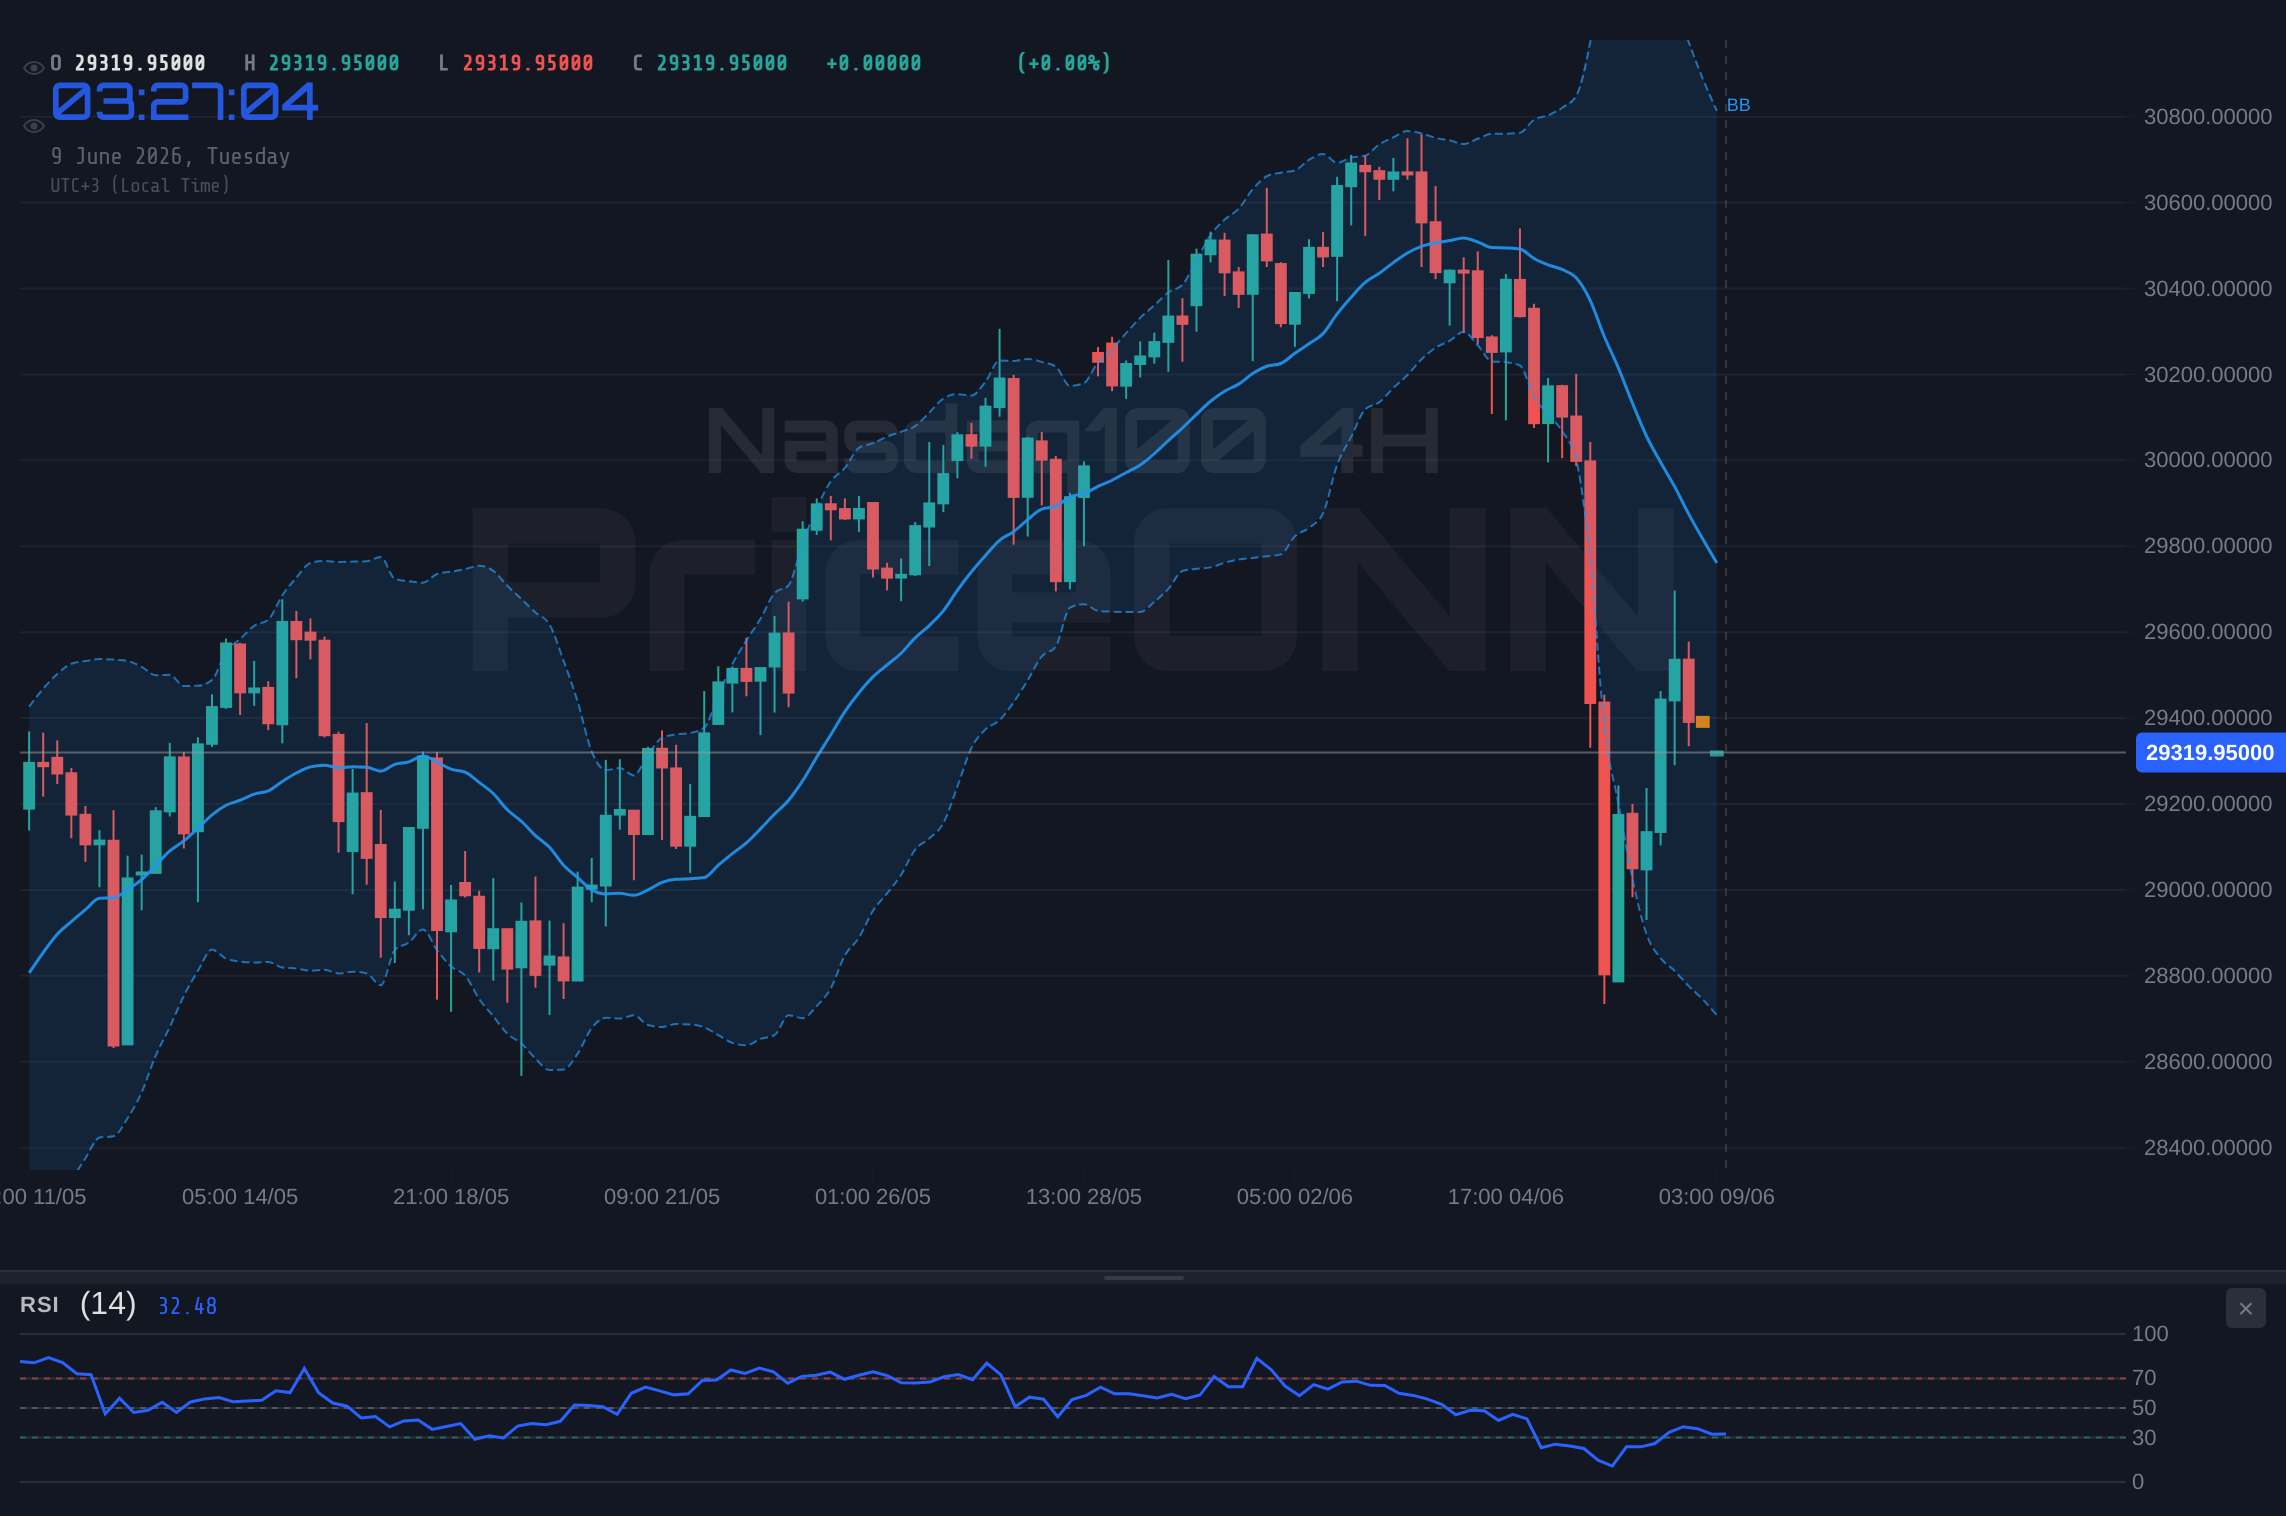
The Nasdaq100 trend analysis across multiple timeframes reveals a genuinely conflicting picture. The daily chart shows a bullish trend with 93% strength - meaning the longer-term structural uptrend remains intact on paper. But zoom in to the 4-hour chart, and you see a completely different story: neutral trend, negative MACD momentum, and a signal score of 6 out of 8 indicators pointing to further selling. Even the 1-hour chart is calling this a sell with 6 bearish signals against just 2 bullish ones. This is not the kind of alignment that tends to precede sustained breakouts.
So what is really happening? The most likely explanation is a technical bounce from near-oversold conditions. On the 4-hour chart, RSI had been grinding toward 38.85 - not yet at extreme oversold levels, but low enough to attract bargain hunters and trigger short-covering. The 4H Stochastic shows K at 48.19 crossing above D at 28.40, which is a textbook bullish crossover from a depressed zone. This combination - RSI approaching oversold, Stochastic turning up from low levels - is exactly the kind of setup that triggers short-covering rallies, even in established downtrends. The bounce is technically justified. Whether it is sustainable is a separate question entirely.
A short-covering rally and a genuine trend reversal are very different things. One is mechanical, the other is fundamental. Right now, the evidence points more toward the former than the latter. Nasdaq100 market sentiment is cautiously optimistic at best, not decisively bullish - and that distinction matters enormously when sizing positions.
The $29,867 Level and Why It Defines This Market
There is one number that matters above everything else in this analysis: $29,867.11. That is the first major daily resistance level, sitting roughly 1.8% above the current price of $29,345.50. Reaching that level from here would represent a meaningful continuation of today's rally. Breaking through it cleanly would be an entirely different signal - one that could accelerate momentum toward the $30,930.67 secondary resistance and potentially the $31,496.89 zone beyond that.
The significance of $29,867.11 is not just about the number itself. It represents the area where sellers previously stepped in with conviction. In markets, price has memory. The same institutional players who sold at that level once are likely watching it again, and they will need a compelling reason - either a clear shift in macro fundamentals or overwhelming buying volume - to step aside and allow bulls to clear it decisively. Without that catalyst, selling pressure at this zone is likely to reassert itself.
With US CPI data looming and Fed expectations in flux, that compelling reason is not yet apparent. This is precisely why the Nasdaq100 support and resistance picture looks so uncertain right now. Bulls need a macro tailwind; they cannot simply push through a major resistance level on the basis of a short-covering bounce alone.
On the way up to $29,867.11, there are two nearer-term resistance levels to navigate first. The 1H chart shows immediate resistance at $29,444.86, followed by $29,504.70. The 4H timeframe then puts a more substantial wall at $29,724.98 before the daily level comes into view. A clear hourly close above $29,444.86 would be the first positive signal that the bounce has genuine substance. Failure there would suggest the rally has already run its course for the session.
Multi-Timeframe Conflicts and What They Mean for Different Traders
One of the most instructive aspects of Nasdaq100 volatility analysis right now is how dramatically different timeframes are telling different stories. The daily chart maintains bullish trend structure with ADX at 35.24 - a reading that would normally be quite positive. But that ADX strength has been accompanying a bearish correction: the daily MACD histogram remains negative, price is trading below the Bollinger middle band, and the daily Stochastic K at 31.55 has crossed below D at 72.30 - a classic death cross in the oscillator that has historically preceded further weakness on the Nasdaq100 during correction phases.
Meanwhile, on the 1-hour chart, price has recovered above the Bollinger middle band - a short-term positive. MACD on the 1H is showing positive momentum, which at least confirms the immediate buying pressure is genuine rather than a complete fake-out. But ADX at 26.80 with bearish bias on the 1H suggests the short-term trend remains pointed lower even as price rebounds. The AI technical analysis picture here is one of a market in genuine transition, not one with a clean directional bias.
For different types of traders, this creates very different playbooks. A scalper looking at 1H charts sees a bounce in progress but should be watching the $29,444.86 resistance closely - failure there is an immediate warning sign. A swing trader focused on 4H charts should be waiting for either a confirmed break above $29,724.98 or a definitive failure of today's bounce before committing to a position. A longer-term investor looking at daily charts sees price below the Bollinger middle band with negative MACD, suggesting patience is still warranted. Every timeframe is telling a coherent story; they are just different stories.
The Nasdaq100 MACD signal is perhaps the single most important indicator to watch right now. Until the 4H or daily MACD crosses back into positive territory, every rally attempt should be treated with appropriate skepticism from a trend-following perspective. Multi-timeframe analysis at this confluence demands both technical discipline and macro awareness working in tandem.
Geopolitical Wildcards Adding to an Already Complex Picture
The technical picture does not exist in a vacuum, and the macro backdrop right now is genuinely complicated. According to recent energy sector reporting, Brent crude - currently at $96.56 - climbed after Houthi forces in Yemen targeted Israeli vessels in the Red Sea. This development has a double impact on Nasdaq100 sentiment. Higher energy costs feed directly into inflationary pressures that keep the Fed in hawkish mode, while outright geopolitical escalation triggers risk-off behavior that historically punishes high-growth technology equities with extreme velocity.
Reuters reported that Iran completed its first wave of strikes against Israel - and markets initially breathed a sigh of relief when a second wave did not immediately follow. This kind of event-driven volatility explains much of the choppy intraday price action visible in today's session range of $28,785.32 to $29,697.01 - a spread of nearly $912 points. Technology stocks were caught in the crossfire as investors weighed geopolitical risk against rate risk in real time, creating the kind of explosive intraday swings that make directional trading genuinely difficult.
The DXY (Dollar Index) provides critical additional context. Currently trading at 99.79, the dollar is in a mild pullback from recent highs, but its 4H chart shows bullish trend strength at 93% with ADX at 25.38. A stronger dollar is generally negative for risk assets including Nasdaq100, but the current pause in dollar strength is giving equities temporary breathing room. Watch the $100.13 level closely - if DXY breaks above that daily resistance, it would likely put fresh pressure on technology stocks and cap any Nasdaq100 rally attempt in the near term.
What the Nasdaq100 RSI and MACD Signals Are Actually Telling You
The RSI reading of 38.85 on the 4H chart deserves a nuanced interpretation beyond the simple "approaching oversold" label. This level is not deeply oversold - it is approaching oversold, which is enough to attract tactical buyers but not enough to generate the kind of powerful snap-back rallies you see when RSI drops to 25 or below. Today's 1.88% move fits this profile: a meaningful bounce, but not a capitulation reversal. The difference matters because capitulation reversals tend to produce sustained trend changes, while near-oversold bounces more often produce a temporary correction of the correction before the downtrend resumes.
On the daily chart, RSI at 52.31 is hovering near the critical 50 midline. This line acts as a trend dividing line: sustained readings above 50 indicate bull control, below 50 indicate bear control. The fact that daily RSI is essentially neutral - right at the fence - tells you exactly where the broader market stands. Neither side has full control yet, and the next meaningful catalyst will determine which side wins the argument. A close above 55 on the daily RSI would be a genuinely constructive development; a rollover back toward 40 would signal the correction has further to run.
The Nasdaq100 MACD signal adds yet another layer of complexity. On both 4H and daily timeframes, the histogram remains in negative territory. This means the 12-period EMA has not yet crossed back above the 26-period EMA - the technical definition of negative momentum. Price bouncing while MACD stays negative is a momentum divergence, and on the Nasdaq100, these divergences during corrections have more often than not been resolved in favor of the prevailing trend. That means the burden of proof is on the bulls: they need to demonstrate follow-through, not just one strong session.
US CPI data is due this week and represents a significant binary risk event for Nasdaq100. The previous reading came in at 0.4%, and if the upcoming release surpasses that, Fed rate hike expectations could spike sharply - potentially reversing today's entire rally in a single session. Position sizing should reflect this event risk, and fully committed directional positions before the CPI release carry outsized downside exposure.
Three Scenarios That Will Define Nasdaq100 This Week
Given the conflicting signals across timeframes and the macro uncertainty, here are the three scenarios Nasdaq100 trading signals are pointing toward, with realistic probability estimates based on the current technical picture. These probabilities reflect the weight of evidence and are not predictions - conditions can change rapidly with incoming data:
Bearish Scenario; Correction Deepens Toward $28,912
45% ProbabilityNeutral Scenario; Range Consolidation Between $29,101 and $29,725
35% ProbabilityBullish Scenario; Rally Extension Reaches $29,867
20% ProbabilityNasdaq100 Key Levels at a Glance
Frequently Asked Questions: Nasdaq100 Analysis
What happens if Nasdaq100 breaks above the $29,867 daily resistance?
A confirmed daily close above $29,867.11 would represent a significant technical development and would likely accelerate momentum toward the $30,930.67 secondary resistance zone. However, with ADX at 31.49 still reflecting strong trend conditions and MACD negative on both 4H and daily charts, this level requires meaningful catalyst support - most likely a softer-than-expected CPI print or a dovish surprise from Fed communications. Traders should wait for a confirmed close rather than chasing any intraday spike through the level.
Should I buy Nasdaq100 at $29,345 given the 4H RSI reading of 38.85?
RSI at 38.85 on the 4H chart confirms the index was approaching oversold territory, supporting today's 1.88% bounce. However, buying a bounce in a downtrend requires strict risk management: a reasonable long entry would look for a sustained hold above $29,303.76 with a stop positioned below $29,101.35. The current macro environment - with Fed hike expectations rising and CPI data pending - makes this a higher-risk setup than the RSI reading alone would suggest, and position sizing should reflect that uncertainty.
Is the negative MACD on the 4H chart a warning sign despite today's Nasdaq100 rally?
Yes, the negative MACD histogram on the 4H chart is a meaningful caution flag. When price rises but MACD remains in negative territory, it typically indicates the bounce lacks the institutional buying conviction needed to sustain a genuine trend reversal. This type of divergence - price recovering while MACD stays negative - has historically on the Nasdaq100 preceded failed rallies during bearish corrections. Confirmation of a genuine reversal would require the MACD histogram to cross back into positive territory on at least the 4H timeframe before calling this a trend change.
How will the upcoming US CPI data affect Nasdaq100 this week?
US CPI is the most critical near-term catalyst for Nasdaq100 this week. A hotter-than-expected reading above the previous 0.4% would reinforce Fed rate hike expectations and could reverse today's gains, with $29,101.35 and $28,912.12 as likely downside targets. Conversely, a softer print could give bulls the green light toward $29,724.98 and potentially the key $29,867.11 resistance. Given previous CPI-driven Nasdaq100 volatility this cycle, reducing position sizes ahead of the release is prudent risk management for both bulls and bears.
The Nasdaq100 breakout thesis depends on one condition above all others: the 4H MACD needs to confirm positive momentum. Until that happens, every rally attempt should be treated with healthy skepticism. The $29,867.11 level is the line that separates a genuine recovery from a prolonged corrective phase, and clearing it will require a macro catalyst - not just oversold technicals. Price action analysis at this juncture demands patience over conviction.
Track markets in real-time
AI-powered analysis, technical indicators and real-time price data.
Join Our Telegram Channel
Breaking market news, AI analysis and trading signals instantly.
Join Channel