Forget the headline payroll number for a second. The real story from last week was not just that US jobs data held up, it was that the Dollar Index refused to hand back a single point even while the AI-led tech trade was cracking and oil was bleeding more than 6%. DXY today analysis shows the greenback finishing the week pinned near $99.80, up 0.56% on the day, and reclaiming a pivot zone that had capped it for sessions. Markets are closed now, so this is the moment to step back and ask the question that matters for the week ahead: is this dollar strength the start of something, or a reflex that fades the moment May CPI hits the tape?
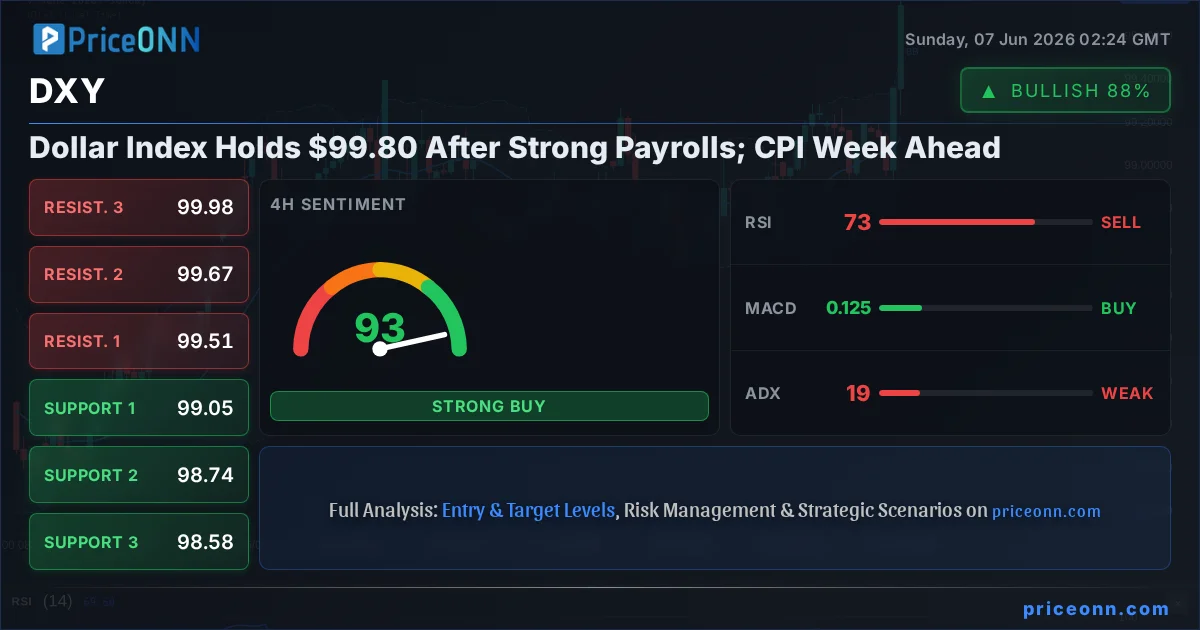
- DXY closed last week at $99.80, up 0.56% (+0.56), after a stronger-than-expected US payrolls print reinforced the Fed-patience narrative.
- Momentum is stretched: the 1-hour RSI sits at 79.59 and the daily RSI at 65.25, with daily Stochastic %K at 84.14 flashing overbought conditions into the weekend.
- The 99.38 daily pivot (former resistance) is now the line in the sand; immediate intraday resistance stacks at 99.86, 99.91 and 99.98.
- The daily ADX at just 20.18 says this uptrend is moderate at best, not a runaway move; the week's direction likely hinges on May CPI, seen rising 0.5% month over month.
Time Horizon: This is a weekend weekly review and market-outlook piece covering last week's price action and the multi-day setup into the new week.
The Week the Dollar Quietly Took Control
Last week began with traders sitting on their hands and ended with the dollar firmly in the driver's seat. The catalyst was Friday's US employment report. According to the early-session reaction reported across forex desks, the dollar strengthened broadly after a much stronger-than-expected jobs print, and that single release reframed the entire week. The payrolls figure was tracked against a forecast near 211,000 versus a prior reading around 215,000, while the unemployment rate was expected to hold steady at 4.3%. Average hourly earnings, pencilled in at 0.3% against a previous 0.2%, added a wage-inflation wrinkle that the bond market did not ignore.
The takeaway from the data was not the absolute number, it was what it did to rate expectations. A labor market that refuses to roll over hands the Federal Reserve cover to stay patient rather than rush into easing. That is precisely the framing one forex report used: strong payrolls reinforce Fed patience. When the market pushes out the timing of rate cuts, the dollar's yield advantage holds, and DXY trend analysis turns constructive almost mechanically.
You could see the read-through everywhere. USD/JPY cleared the psychologically loaded 160 handle and was last trading around 160.24, a move that tells you carry and yield differentials are back in focus. EUR/USD slipped 0.65% to about 1.1521 despite a relatively hawkish European Central Bank backdrop, and GBP/USD shed 0.59% to roughly 1.3335. When the dollar rises against both the euro and the pound on the same session, that is broad-based strength, not a one-pair story.
What Strong Payrolls Did to DXY Trend Analysis
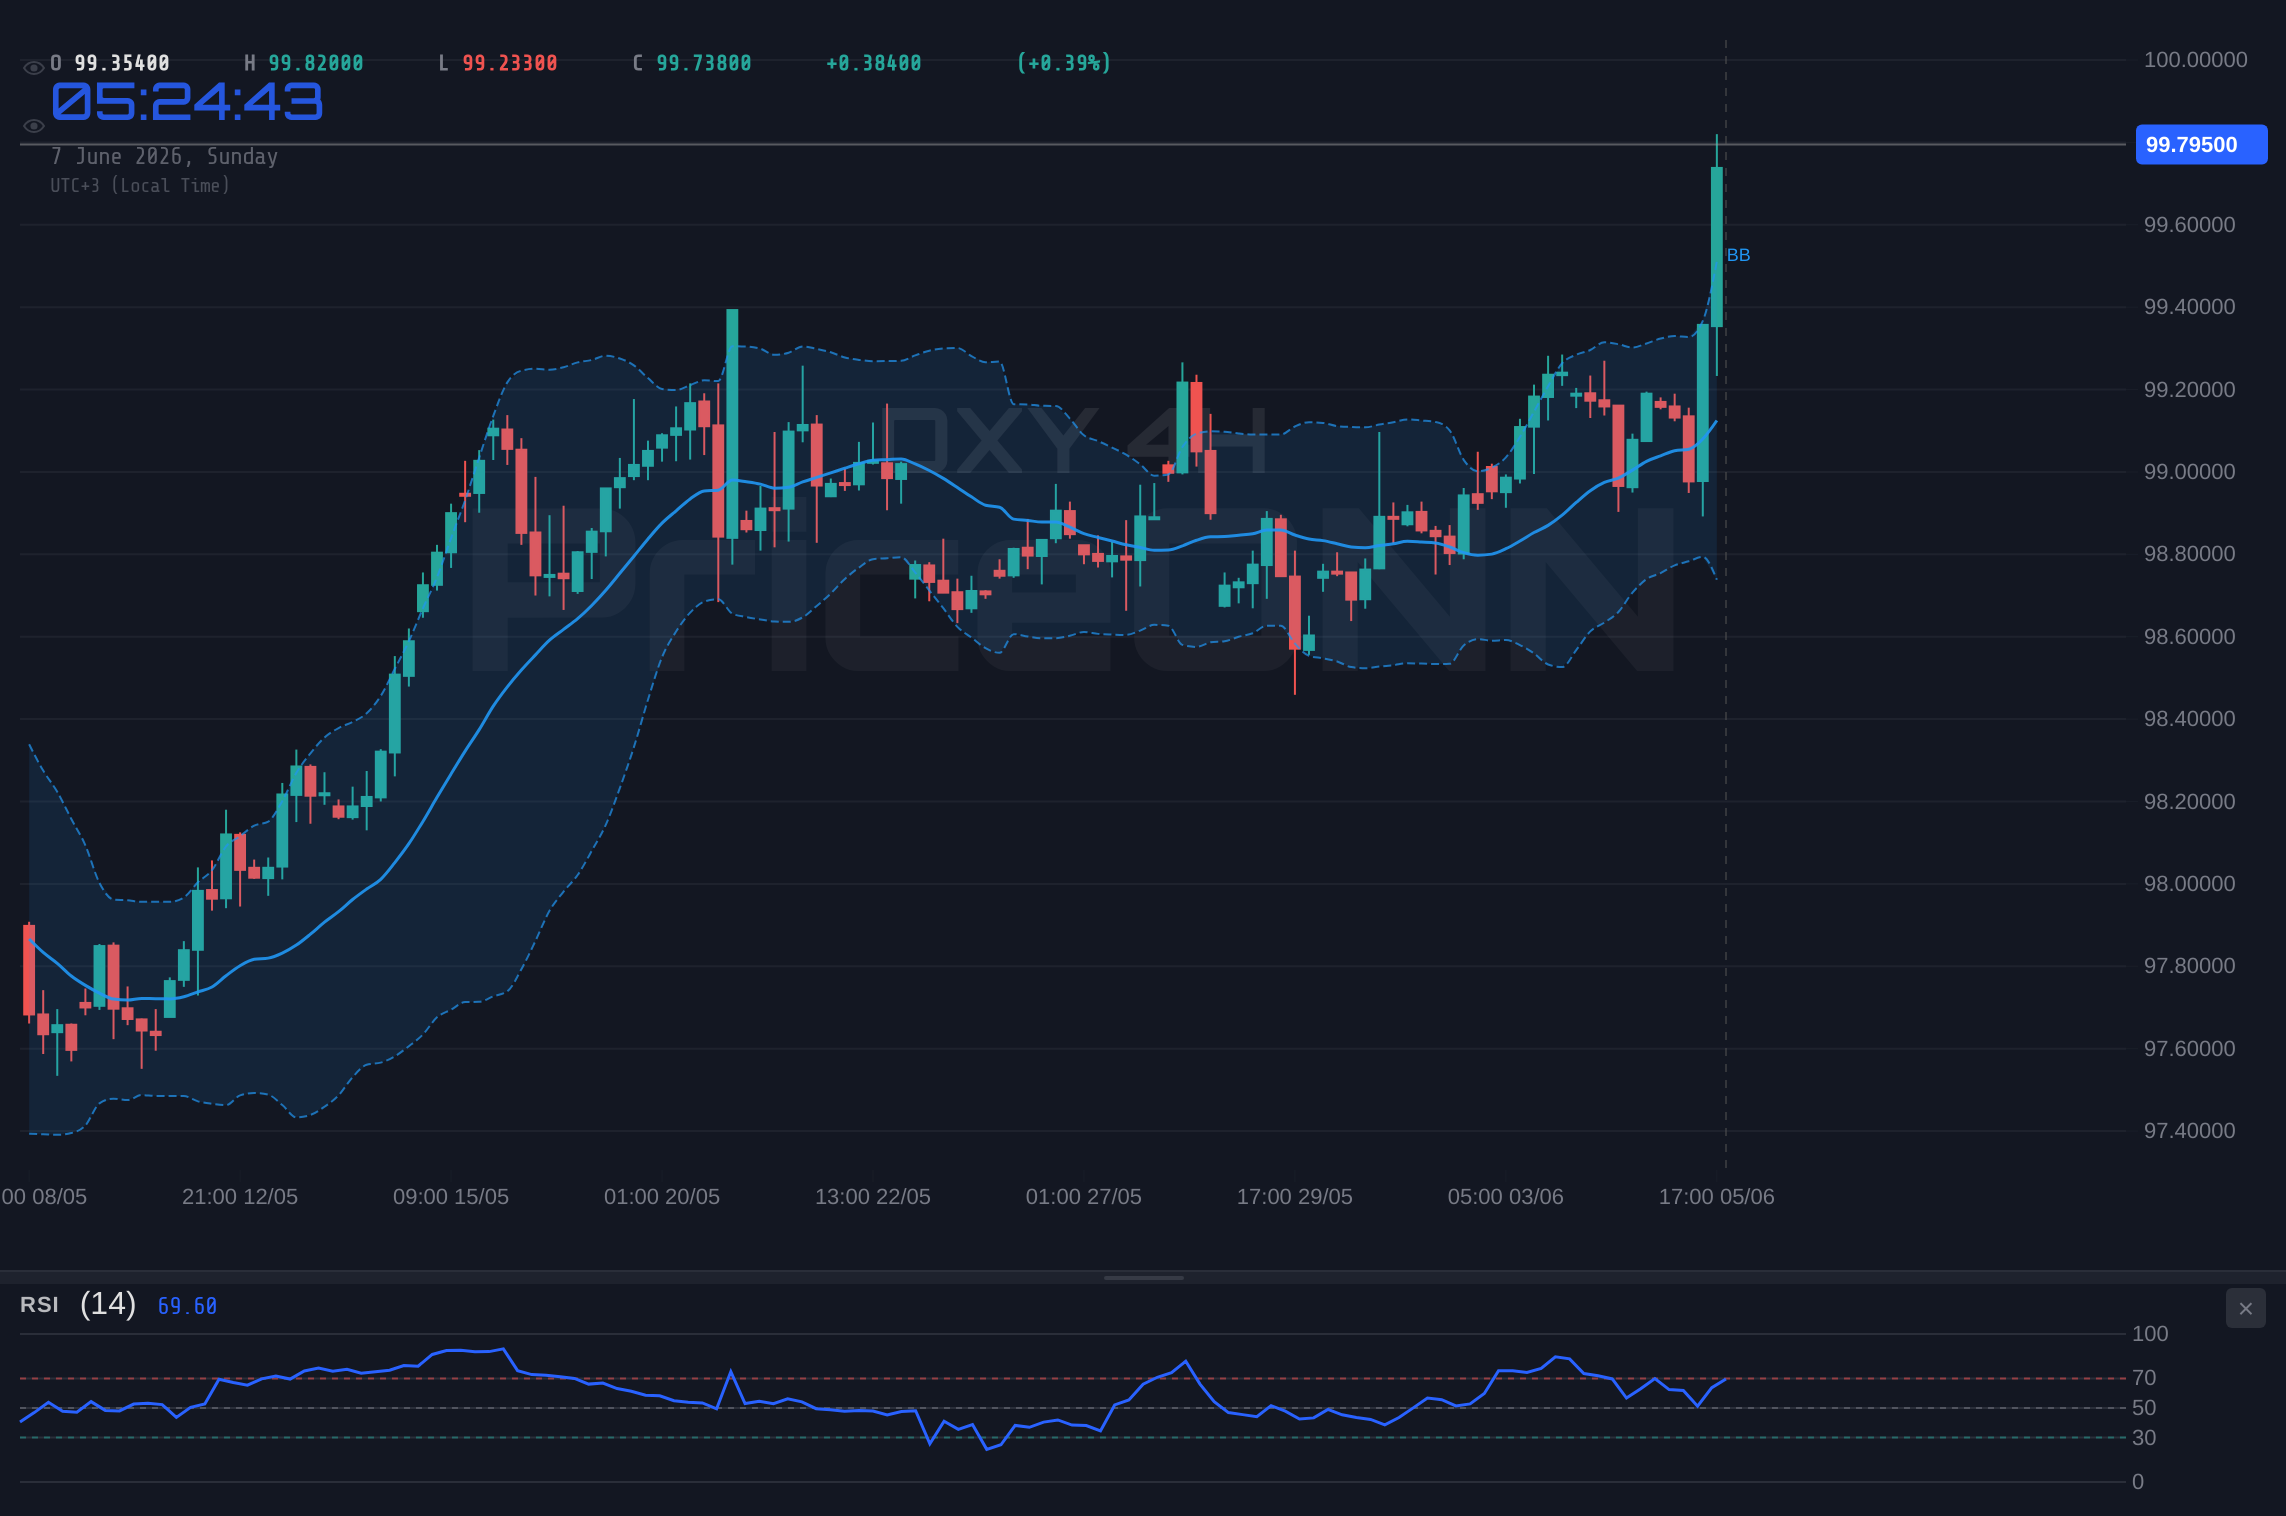
Here is where it gets interesting. The dollar's strength was not uniform across timeframes, and that nuance is the whole game right now. On the 1-hour chart the trend reads as a full-throttle uptrend, scored at 100% strength, with the index camped above its mid Bollinger band and the general signal flashing BUY. Drop to the 4-hour and the picture stays bullish at 85% strength, with price pushing above the upper Bollinger band, a classic sign that buyers got aggressive into the Friday close.
But the daily timeframe is where caution creeps in. The daily trend is labelled neutral at 50% strength, even though every individual daily indicator leans long and the daily signal still prints BUY (8 buy signals, 0 sell). That apparent contradiction is the honest version of this market: short-term momentum is hot, but the bigger structure has not yet committed to a new trending phase. This is exactly the kind of multi-timeframe analysis that separates a durable breakout from a Friday-afternoon liquidity grab.
The ADX readings make the point sharper. On the 1-hour, ADX at 35.49 confirms a genuinely strong short-term trend. Yet the 4-hour ADX of 19.42 and the daily ADX of 20.18 both sit in weak-to-moderate territory. A trend reading like that is the real tell: the higher-timeframe move has not fully ignited. The dollar is strong today, but the structure is still asking for confirmation rather than handing it over.
When the 1-hour RSI is at 79.59 and 1-hour Stochastic %K is at 94.03, the index is not just overbought, it is sprinting. Stretched momentum into a weekend close often invites Monday profit-taking, especially when the higher-timeframe ADX has not confirmed the move.
Reading the DXY RSI and MACD Signal Across Timeframes
Let's talk indicators properly, because the DXY RSI picture is doing a lot of the heavy lifting here. The 1-hour RSI at 79.59 is deep in overbought territory, the kind of reading that historically precedes at least a pause or a shallow pullback rather than a clean vertical extension. The 4-hour RSI at 72.5 echoes that warning, while the daily RSI at 65.25 is the calm one in the room, bullish but with room left before it gets uncomfortable. That spread between an overheated short-term RSI and a still-reasonable daily RSI is the textbook signature of a strong push that may need to digest before it continues.
The DXY MACD signal is cleaner and more uniformly constructive. Across the 1-hour, 4-hour and daily, MACD shows positive momentum with the line above its signal line. That is genuine bullish confirmation and it is the single most consistent bullish thread running through this dataset. When MACD agrees across three timeframes, you respect the direction even if you fade the entry.
Stochastic is where the conflict screams loudest. The 1-hour Stochastic at K=94.03, D=91.39 and the daily K=84.14, D=44.82 are both elevated, with the daily showing %K racing well above %D. Overbought Stochastic does not mean sell on its own, that is the rookie mistake. It means the easy part of the move is likely behind us and the next push needs fresh fuel, probably from an actual data catalyst, to justify itself. Put the pieces together and you get a market that is bullish in direction (MACD), stretched in momentum (RSI, Stochastic), and only moderately committed at the structural level (ADX). That is a watch-and-wait setup, not a chase.
Why $99.38 Became the Line in the Sand for DXY Support and Resistance
Every weekly review needs a level that actually means something, and for the Dollar Index that level is 99.38. On the daily chart, 99.38 had been acting as a resistance cap, and reclaiming it on the back of the jobs data is what gives last week's close at $99.80 its significance. A former ceiling that price now trades above tends to flip into a floor, and that is how this DXY support and resistance map should be read into the new week.
On the short-term chart, the immediate scaffolding is tight. Intraday support sits at 99.75, then 99.68, then 99.64, a cluster that needs to hold to keep the bullish micro-structure intact. Above current levels, the first hurdles are 99.86, then 99.91, then the round-ish 99.98 zone just shy of the psychologically heavy 100.00 mark. That 99.98 to 100.00 area is the one to circle: a clean break and hold above it would be a statement, and it would likely coincide with another leg lower in EUR/USD and GBP/USD.
Step out to the 4-hour and the support shelf deepens to 99.51, 99.05 and 98.74, with 99.67 and 99.98 as resistance. The daily structure leans on 99.01 and 98.77 as deeper support if the post-payrolls enthusiasm fades. The hierarchy is clear: bulls want to defend 99.38 on any dip, bears need a daily close back under it to argue the breakout was a fakeout. Until one of those happens, the index is doing exactly what the title says, holding near a freshly reclaimed cap and waiting for permission to move.
The Cross-Market Picture: A Dollar Bid Built on Stress
This is the part most single-asset writeups miss. The dollar did not rally in a vacuum last week, it rallied against a backdrop of genuine market stress, and that context changes how you weigh the move. The clearest signal came from equities: the Nasdaq 100 cratered 5.41% to around 28,791, a brutal session that one forex desk tied directly to the AI trade cracking. When the most crowded growth trade on the planet wobbles, capital looks for a parking spot, and a chunk of it parked in the dollar.
Gold tells the same story from a different angle. Bullion plunged 2.39% to about $4,328 as investors parsed the robust payrolls data, with the report described as the gatekeeper for the Fed and for gold's next move. A stronger dollar and firmer real-yield expectations are textbook headwinds for the metal, and silver's even sharper 6.58% drop to roughly $67.90 underlines how aggressively the precious-metals complex repriced. With DXY at $99.80 and climbing, the inverse relationship did exactly what it usually does.
Energy added the exclamation point. Brent fell 5.36% to about $95.52 and WTI dropped 6.37% to roughly $91.60. Falling crude alongside a rising dollar is a slightly unusual combination, because oil is priced in dollars, but it makes sense when the bigger driver is a global growth scare rather than a pure currency story. The cleaner read across all of this is a market that turned defensive: weak risk appetite, a bid for the dollar, and a simultaneous flight out of both speculative tech and inflation-sensitive commodities. As one weekly recap put it, markets ended the week in a far more defensive mood than they began it, facing a triple threat from a cracking AI trade, rising Fed risk and escalating Iran tensions.
A dollar that rises while equities, gold and oil all fall is a dollar being bought for safety as much as for yield. That kind of bid can be powerful but also fragile, because it can reverse fast if risk sentiment stabilizes and the safety premium unwinds.
DXY Weekly Outlook: CPI and the Fed Countdown
Now look forward, because the new week is loaded. The single biggest catalyst on the radar is US inflation. According to one economics-week-ahead preview, US inflation is showing renewed upward pressure, with May CPI expected to rise 0.5% month over month and the year-over-year figure firming. That number is a genuine fork in the road for the Dollar Index. A hot CPI on top of strong payrolls would supercharge the Fed-patience narrative, give the dollar a fundamental reason to push through the 99.98 to 100.00 zone, and likely send EUR/USD and gold lower again. A soft CPI would do the opposite, knocking the legs out from under an already overbought DXY and inviting that pullback the RSI and Stochastic readings are quietly warning about.
Layered on top of inflation is the Fed itself. Forex coverage flagged that Fed Chair Warsh's first meeting is approaching and that the Fed countdown has begun, with key inflation data positioned to reshape expectations. A leadership transition at the central bank injects an extra layer of uncertainty, because the market has to recalibrate not just the data but the reaction function of a new chair. Until that resolves, the dollar's trend is hostage to headlines as much as to charts.
Geopolitics is the wildcard. Multiple reports cited escalating Iran tensions as part of the week's defensive tone, and oil prices, even after last week's slide, remain a sensitive barometer. Any flare-up that pushes crude back up would complicate the inflation picture and feed the safe-haven dollar bid simultaneously. For a market-outlook lens, that means two of the dollar's support pillars, Fed patience and safe-haven demand, could both be reinforced by the same geopolitical shock.
So what should different traders actually watch? The scalper cares about that tight 99.75 to 99.86 band and the overbought 1-hour Stochastic, because mean-reversion risk is real at these stretched readings. The swing trader is watching whether 99.38 holds as support and whether the daily ADX climbs above 25 to confirm a real trend rather than the current moderate 20.18 reading. The longer-term, big-picture investor is focused on the 100.00 round number and on whether CPI cements a higher-for-longer dollar regime. Three different clocks, one shared pivot.
Three Paths Into the New Week
With markets closed, these are analytical scenarios for how the structure could resolve, mapped strictly to the levels in the data rather than a trade call.
Breakout Extension: Dollar Clears the Century Mark
45% ProbabilityConsolidation: Digesting the Payrolls Pop
35% ProbabilityMean Reversion: Overbought Unwind
20% ProbabilityThe Honest Read on Conflicting Signals
If you take one thing from this DXY weekly outlook, make it this: the bullish case and the caution case are both true at the same time, and that is normal. Direction is bullish, confirmed by a positive MACD on every timeframe and a daily signal that reads BUY across the board. Momentum is stretched, flagged by a 1-hour RSI near 80 and overbought Stochastic readings that argue against chasing. And conviction is only moderate, exposed by a daily ADX of 20.18 that says the trend has not fully committed. The resolution of that three-way tension will come from the data, specifically CPI, not from the chart alone.
Historically, when an index reaches this kind of short-term overbought stretch right before a major inflation release, the cleaner risk-reward sits in waiting for the catalyst to pick a side rather than front-running it. The dollar has earned the benefit of the doubt by reclaiming 99.38 and defending it into the close, but earning the benefit of the doubt is not the same as confirming a breakout. That confirmation lives above 99.98 and 100.00, and it has to be ratified by the macro calendar.
| Indicator | Value | Signal | Interpretation |
|---|---|---|---|
| RSI (14) | 65.25 | Bullish | Constructive, not yet overbought on the daily |
| MACD | Positive | Bullish | Above signal line, momentum confirmed |
| Stochastic | 84.14 / 44.82 | Stretched | %K elevated, near-term exhaustion risk |
| ADX | 20.18 | Moderate | Trend present but not strongly committed |
| Bollinger | Above mid-band | Bullish | Upward bias intact on the daily |
Frequently Asked Questions: DXY Analysis
What happens if DXY breaks above the $99.98 resistance?
A clean daily close above 99.98 would open the door to the 100.00 psychological round number, the next major hurdle. Given the positive MACD across all timeframes, a confirmed break would likely coincide with further weakness in EUR/USD toward 1.1500 and renewed pressure on gold below $4,328.
Is the DXY RSI at 79.59 a sell signal right now?
Not on its own. The 79.59 reading is on the 1-hour chart and signals overbought, short-term conditions, while the daily RSI at 65.25 is still comfortably bullish. It is a warning that the easy part of the move is done and a pause or shallow pullback is possible, not a standalone reversal trigger; confirmation would require a break of 99.51 support.
Why does the daily ADX at 20.18 matter for the dollar's trend?
ADX measures trend strength, and a daily reading of 20.18 is only moderate, meaning the dollar's uptrend has not strongly committed despite the bullish price action. For the breakout above 99.38 to be durable, traders generally want to see ADX climb above 25; until then, the risk of choppy, range-bound behavior around $99.80 stays elevated.
How will the May CPI release affect DXY this week?
May CPI is the key catalyst, with consensus looking for a 0.5% monthly rise that points to renewed inflation pressure. A hot print would reinforce the Fed-patience narrative and could push DXY through 99.98 toward 100.00, while a soft miss would likely trigger the overbought unwind back toward the 99.05 to 98.74 support zone.
The dollar enters the new week holding the high ground but standing on stretched legs. Volatility around CPI and the Fed countdown will create opportunity for those who let the data resolve the conflict first, and the index has given us a crisp roadmap: defend 99.38, watch 99.98, and respect the round number at 100.00. Patient observers who wait for confirmation rather than chase an overbought tape are the ones the market tends to reward.
Track markets in real-time
AI-powered analysis, technical indicators and real-time price data.
Join Our Telegram Channel
Breaking market news, AI analysis and trading signals instantly.
Join Channel