A single jobs print rewired every risk market on the board, and crypto took the heaviest blow. When the US payrolls number landed hotter than expected on Friday, the dollar index ripped to 99.80 and the message to traders was blunt: the Fed has no reason to rush rate cuts. Risk assets read that memo instantly. The Nasdaq 100 bled 5.37% on the session, and Ethereum, always the higher-beta cousin in this family, took it on the chin with a brutal 9.23% slide.
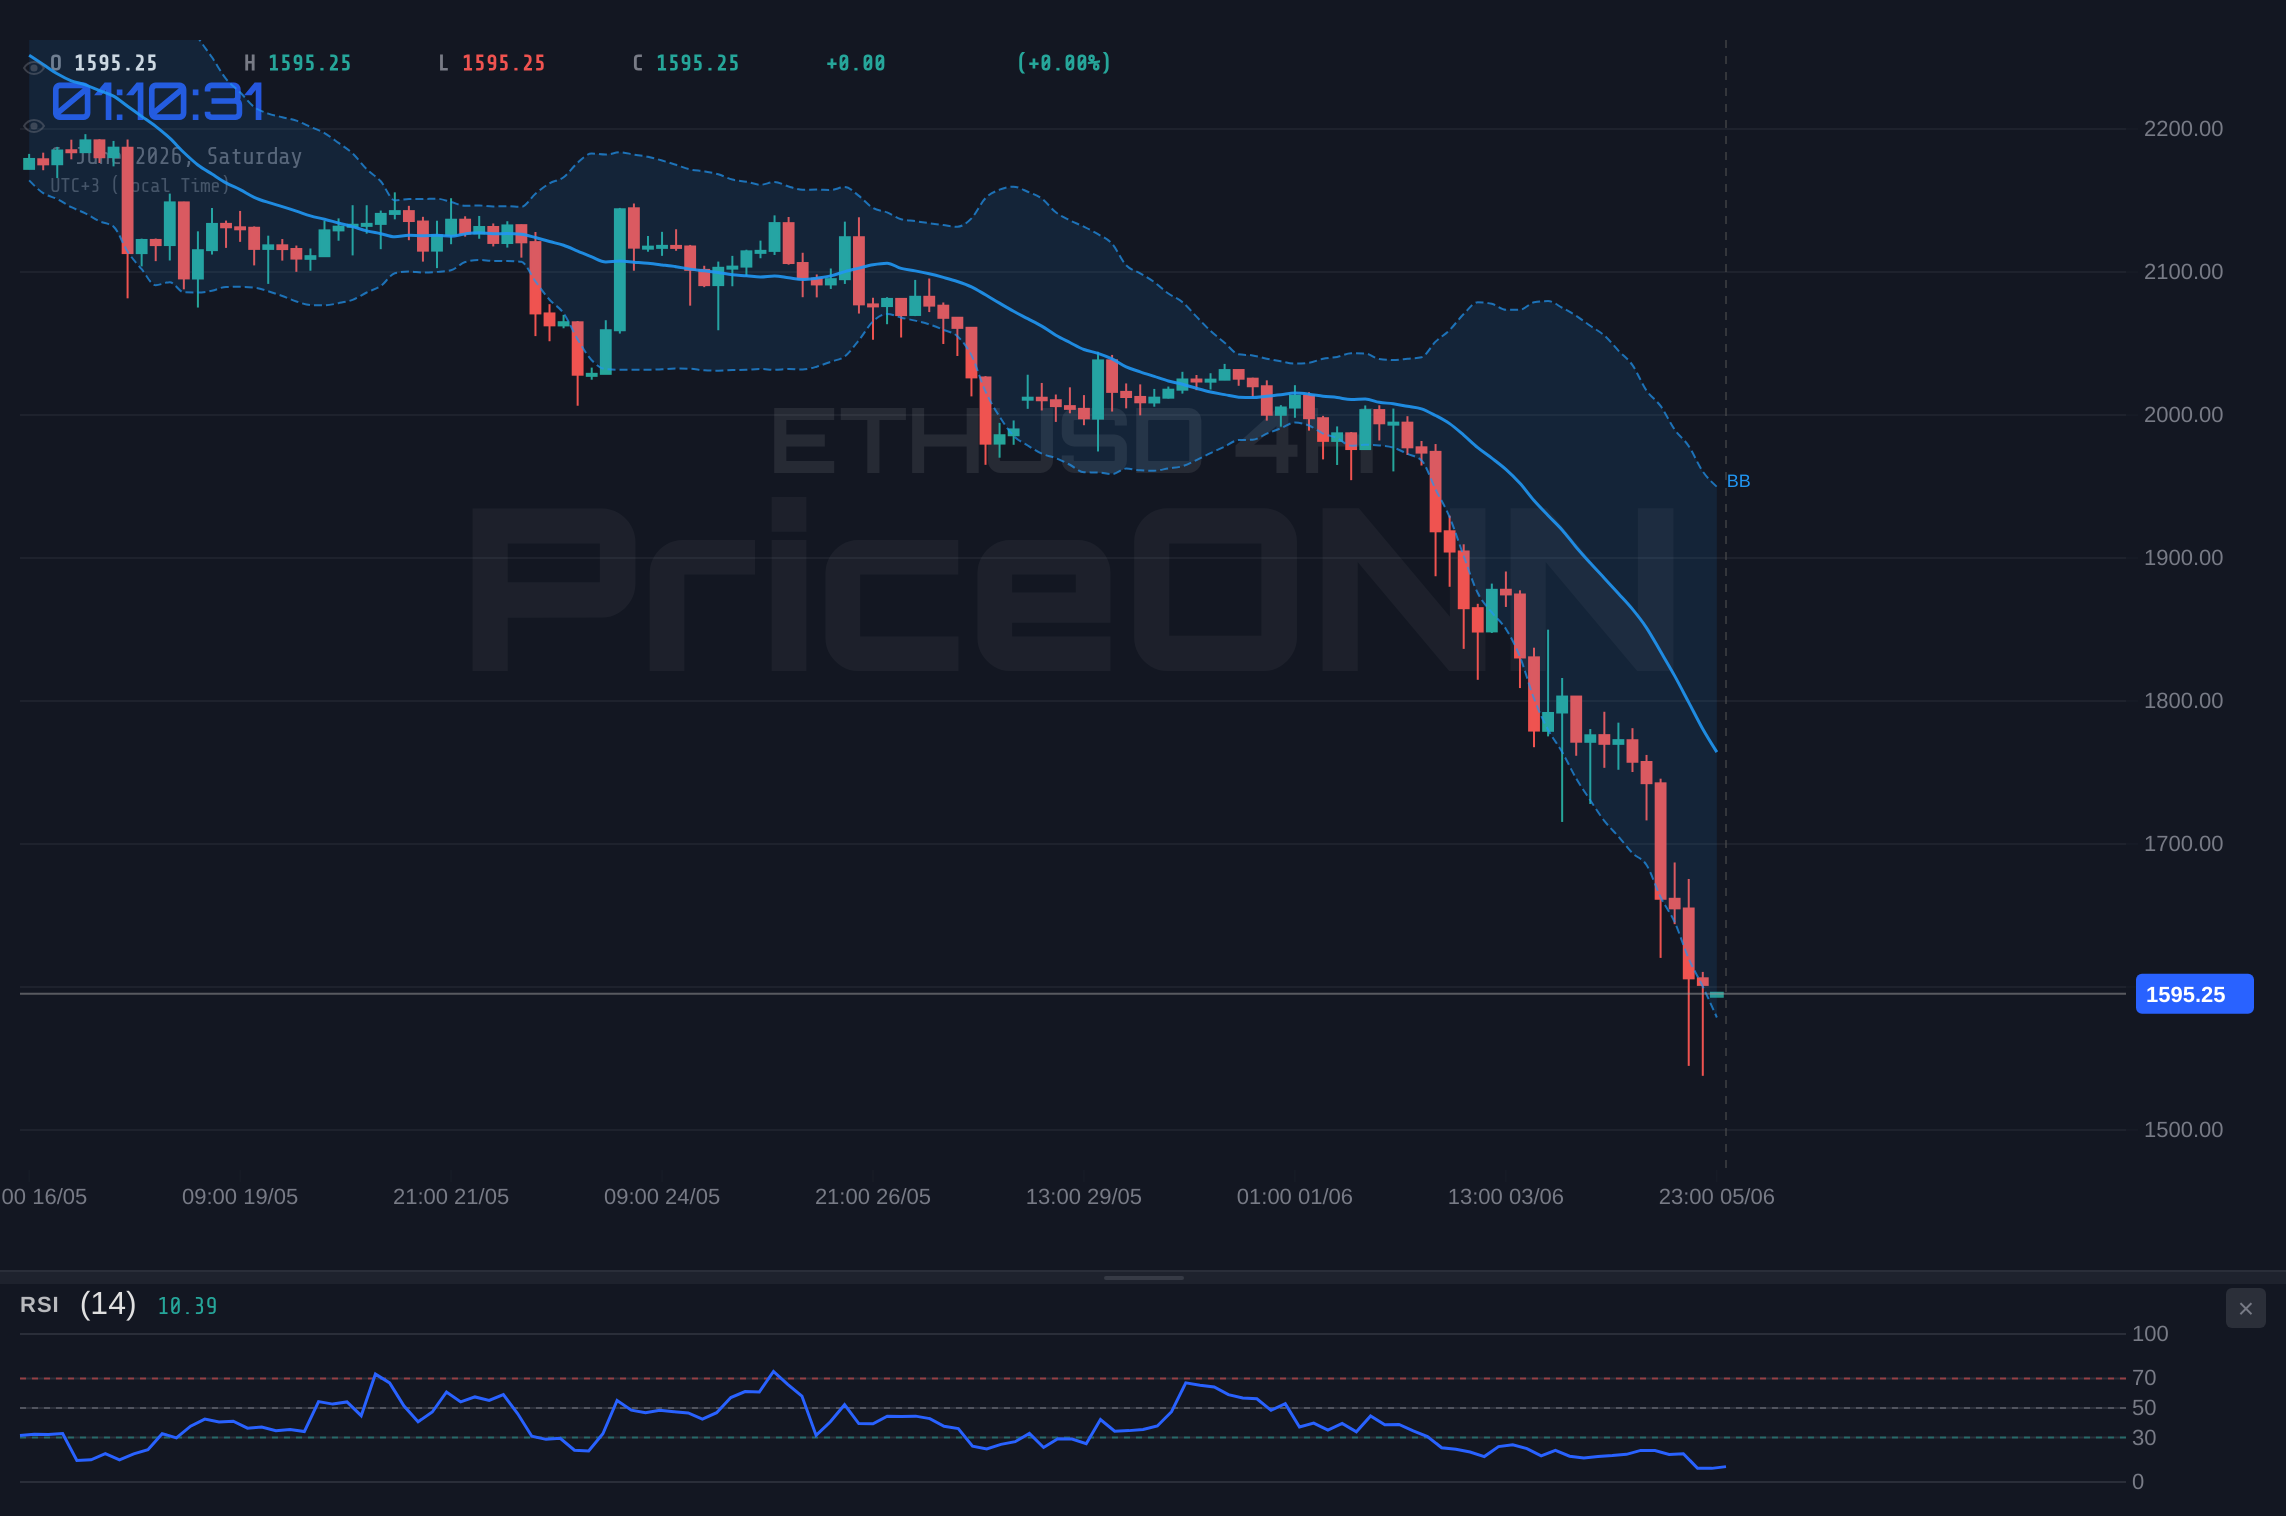
This is ETHUSD today analysis through a macro lens, because right now the chart is downstream of the dollar, not the other way around. Ether is changing hands near $1,609.04 after a session that swept it from an intraday high of $1,780.98 all the way down to $1,537.84. That is a 243-point range in a single day. When you see candles that wide, you are not looking at orderly distribution; you are looking at a liquidity grab where leveraged longs got flushed and price hunted for buyers who simply were not there yet.
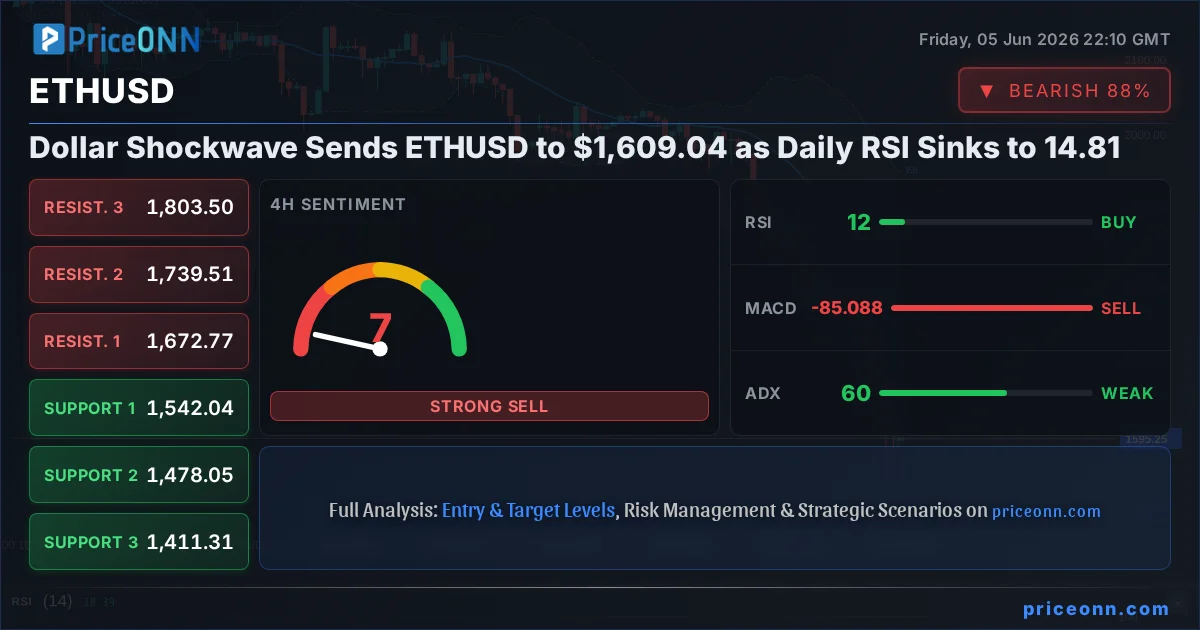
- ETHUSD collapsed 9.23% (-$163.58) to $1,609.04, with the daily candle spanning $1,537.84 to $1,780.98.
- Daily RSI has crashed to 14.81 and the 4-hour RSI sits at 13.80, both screaming deeply oversold conditions rarely seen outside capitulation events.
- The dollar index at 99.80 (up 0.57%) and a 5.37% Nasdaq 100 wipeout confirm this is a broad risk-off purge, not an Ether-specific story.
- First resistance to reclaim sits at $1,619.79; the line in the sand for bears holding control is the $1,569.03 support, with $1,542.04 below it.
Time Horizon: This analysis is geared toward swing traders watching the 4-hour and daily structure over the coming sessions, not intraday scalpers.
Why a US Jobs Report Detonated the Crypto Tape
Let me explain the chain reaction, because it matters more than any single moving average right now. According to the Friday session flow, a much stronger-than-expected US employment report reinforced confidence that the Federal Reserve can stay patient. Dollar strength rippled across the board, with USD/JPY clearing the psychologically heavy 160 handle. When the dollar gets bid this aggressively and Treasury yields firm up, the opportunity cost of holding non-yielding, speculative assets jumps. Crypto, which pays no coupon and lives entirely on forward expectations of liquidity, is the first thing portfolio managers trim.
Here is the part most retail traders miss. Ethereum did not fall in isolation. The correlation between ETHUSD and high-beta tech equities tightened dramatically this session. With the Nasdaq 100 down 5.37% to 28,804.39 and its own 1-hour RSI buried at 13.20, the entire risk complex moved as one organism. Bitcoin slid 3.15% to $61,635, but notice the gap: Ether fell nearly three times as hard in percentage terms. That underperformance tells you capital is rotating defensively, and when fear spikes, the market sells what it can, not what it wants to. Higher-beta altcoin proxies like ETH get hit first and hardest.
Bitcoin dominance tends to rise in exactly this kind of flush. When ETH bleeds 9% while BTC loses 3%, capital is consolidating into the perceived safer crypto asset. That rotation can persist even after a bounce begins, so an ETH relief rally needs BTC stability to hold.
What ETHUSD RSI at 14.81 Is Really Telling Us
Now this is where it gets interesting. A daily RSI reading of 14.81 is not a number you see often. For context, anything below 30 is conventionally oversold; sub-20 is the territory of genuine capitulation, where sellers are exhausting themselves. On the 4-hour chart the picture is even more extreme, with RSI at 13.80 sitting beneath the lower Bollinger Band. The 1-hour timeframe, by contrast, has already clawed back to a more neutral RSI of 39.57, which hints that the very-short-term selling pressure is starting to cool even while the higher timeframes remain pinned to the floor.
But here is the trap, and it is a costly one: oversold does not mean buy. It means stretched. In a market with an ADX of 48.91 on the daily and a staggering 60.41 on the 1-hour, the trend strength is ferocious. ADX above 40 signals a powerful, committed move, and a reading of 60 is the kind of momentum that chews up bottom-pickers who step in too early. Strong trend plus oversold RSI is the classic conflict signal. The RSI says stretched, the ADX says the freight train is still moving. You do not stand in front of that train just because the speedometer is high.
Stochastics reinforce the caution. On the daily, %K sits at 10.60 with %D at 17.52, both deep in oversold ground but with %K still below %D, meaning no bullish crossover yet. On the 1-hour, however, %K at 40.60 has crossed above %D at 27.15, an early and tentative sign that the shortest timeframe is trying to base. That divergence between timeframes is the entire story for swing traders right now: the micro structure is stabilizing while the macro structure is still falling.
When daily RSI hits sub-15 inside a strong downtrend, the historical pattern is rarely a V-shaped bottom. More often price carves a basing range first, retests the lows, and only then reverses. The smart play is to let the oversold condition resolve into a confirmed structure, not to catch the knife mid-air.
The Levels That Decide ETHUSD's Next Move
Let's map the battlefield. On the downside, the first meaningful support is $1,569.03, lifted from the 1-hour structure. Lose that on a closing basis and the 4-hour support at $1,542.04 comes into focus, conveniently aligned with the session low of $1,537.84. Below that, the air gets thin, with the next 1-hour shelf at $1,518.27 and the deeper 4-hour zone at $1,478.05. A breakdown through the session low would confirm sellers are not done and would likely trigger another wave of stop liquidations.
On the upside, bulls have work to do before anyone can talk about a reversal. The immediate hurdle is $1,619.79, the 1-hour resistance just overhead. Clearing it opens the path to $1,638.13, and then the more significant 4-hour resistance at $1,672.77. That $1,672 zone matters because it roughly marks where the 4-hour breakdown accelerated. Reclaiming it would be the first real evidence that this purge has run its course. Until ETH proves it can close back above $1,619.79, every bounce should be treated as a potential lower high inside a downtrend.
On-Chain and Flow Signals Worth Watching
Price is only half the story in crypto; the plumbing matters just as much. In a 9% single-day drawdown, the metrics that separate a healthy reset from the start of something worse are exchange flows and staking behavior. A spike in ETH moving onto exchanges during a sell-off typically signals holders preparing to sell, which adds supply pressure. The opposite, coins leaving exchanges into cold storage or staking contracts, suggests accumulation by stronger hands willing to ride out volatility. With staking yields still rewarding lockups, a meaningful share of supply remains illiquid, which can cushion the downside once forced selling exhausts.
Whale movement is the other tell. Large-wallet accumulation during capitulation candles has historically marked local bottoms, while whales distributing into a falling market confirms continuation. Gas fees and network activity round out the picture: a collapse in on-chain demand alongside the price drop would point to genuine risk aversion across DeFi, whereas resilient TVL and stable gas would suggest the sell-off is more a macro-driven leverage flush than a fundamental abandonment of the ecosystem. Given that this move was clearly triggered by the dollar and the jobs report, the leverage-flush interpretation looks more likely than a structural breakdown in Ethereum fundamentals.
The ETF flow angle deserves attention too. Spot Ether products have made institutional positioning visible in a way it never used to be. A risk-off macro session like this one often coincides with outflows, and persistent ETF redemptions would keep a lid on any recovery. Conversely, institutions using this washout to add exposure at a discount would be a quiet bullish signal that price alone will not reveal for a day or two. This is precisely the kind of multi-timeframe analysis and market sentiment analysis that turns a raw price drop into an actionable map.
What the Economic Calendar Sets Up Next for ETHUSD
The macro calendar is not done with crypto. The market is now in a Fed countdown, with Fed Chair Warsh's first meeting approaching and key US inflation data on deck that could reshape rate expectations. The strong payrolls print that triggered this sell-off already pushed back the timeline for easing; if upcoming inflation data also comes in hot, the dollar at 99.80 could extend its run and keep pressure on every risk asset, ETHUSD included. Notice the dollar index 1-hour RSI is already at an overbought 80.95, so a near-term dollar pullback is plausible, and any dollar softness would hand crypto its first real tailwind for a bounce.
This is the confluence swing traders should respect: ETHUSD is oversold at the same moment the dollar is overbought. If DXY mean-reverts even modestly from that 80.95 RSI extreme, the pressure valve on ETH opens. But if inflation data confirms the hawkish narrative, the dollar stays bid and the path of least resistance for Ether remains lower. The ETHUSD price forecast hinges less on any single indicator and more on whether the dollar can hold its breakout.
Three Scenarios for ETHUSD in the Sessions Ahead
Rather than force a single prediction onto a market this volatile, it is more honest to weigh the probabilities across distinct paths.
Continuation Flush: Dollar Stays King
55% ProbabilityRelief Rally: Dollar Cracks
15% ProbabilityOversold Base: Sideways Repair
30% ProbabilityHow Different Traders Should Read This ETHUSD Setup
The right move depends entirely on your timeframe. For the scalper, that 1-hour RSI recovery to 39.57 and the bullish Stochastic crossover offer short-lived bounce setups, but only with tight risk against $1,569.03. For the swing trader, patience is the edge here. The daily downtrend is intact, ADX confirms its strength, and chasing an oversold bounce into that kind of momentum is a low-probability bet. A daily close back above $1,619.79 would be the first piece of evidence worth acting on. For the long-term investor, a 9% washout driven by a macro liquidity event, rather than any Ethereum-specific failure, is the kind of dislocation that historically rewards staggered accumulation rather than panic. None of that is a signal to buy blindly; it is a framework for deciding when the setup actually arrives.
A valid long setup does not exist yet. What would create one: a daily close back above $1,619.79, a bullish Stochastic crossover on the 4-hour, and confirmation that the dollar is rolling over from overbought. Get those three together and the risk-reward flips. Until then, this is a watch zone, not a buy zone.
Frequently Asked Questions: ETHUSD Analysis
Is RSI at 14.81 a buy signal for ETHUSD right now?
Not on its own. A daily RSI of 14.81 confirms ETHUSD is deeply oversold, but with daily ADX at 48.91 the downtrend remains powerful, and strong trends routinely keep RSI pinned low for extended stretches. Oversold means stretched, not reversed; wait for a Stochastic crossover and a reclaim of $1,619.79 before treating it as a turn.
What happens if ETHUSD breaks below the $1,537.84 session low?
A 4-hour close beneath $1,537.84 would confirm sellers remain in control and likely trigger another round of stop liquidations. The next support shelf sits at $1,518.27, followed by the deeper 4-hour zone at $1,478.05. That breakdown is the highest-probability scenario while the dollar holds above 99.80.
Why did ETHUSD fall 9% when Bitcoin only dropped 3%?
Ethereum carries higher beta than Bitcoin, so it amplifies risk-off moves. The strong US jobs report lifted the dollar to 99.80 and crushed risk appetite, sending the Nasdaq 100 down 5.37%. In that environment capital rotates defensively, lifting Bitcoin dominance and hitting higher-beta assets like ETH the hardest.
How will upcoming US inflation data affect ETHUSD this week?
With the Fed countdown underway and Chair Warsh's first meeting approaching, hot inflation data would reinforce dollar strength and keep ETHUSD pressured toward $1,518.27. A softer print could crack the dollar from its overbought 80.95 1-hour RSI and hand Ether the tailwind it needs to reclaim $1,619.79.
The cleanest opportunities are forged in exactly these moments of forced selling, but they belong to traders who wait for confirmation rather than those who guess the bottom. ETHUSD is oversold, the dollar is overbought, and the next dollar move will likely decide which way this resolves. Mark $1,569.03 and $1,619.79 on your chart, manage your risk, and let the market show its hand; volatility this sharp always offers a second chance to those who are prepared for it.
Track markets in real-time
AI-powered analysis, technical indicators and real-time price data.
Join Our Telegram Channel
Breaking market news, AI analysis and trading signals instantly.
Join Channel