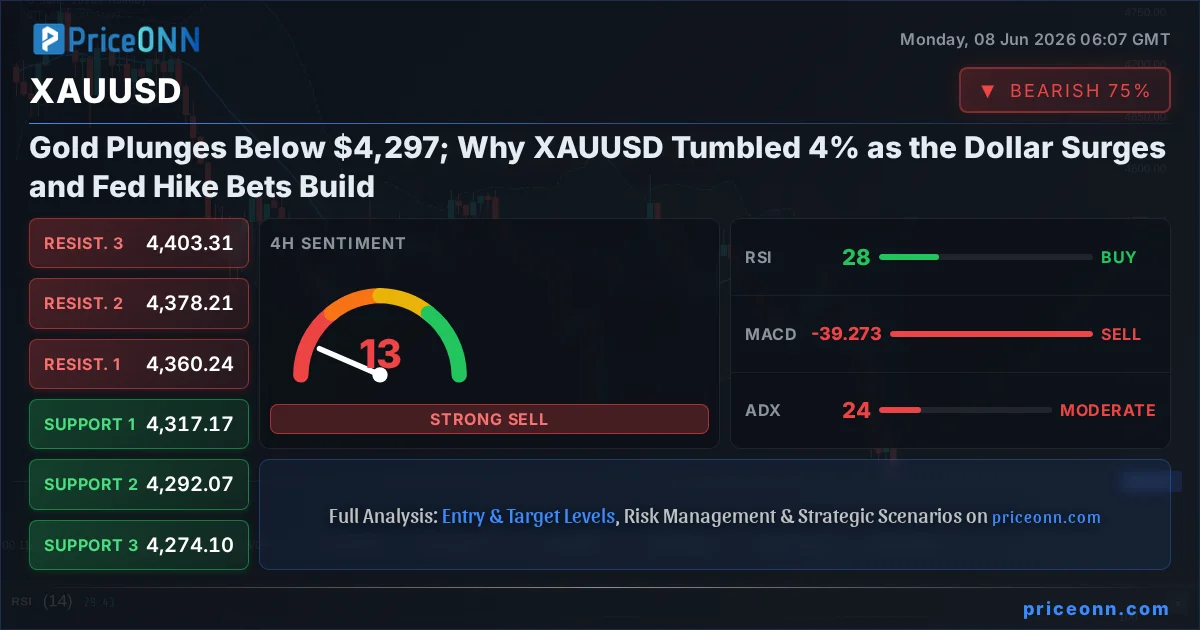
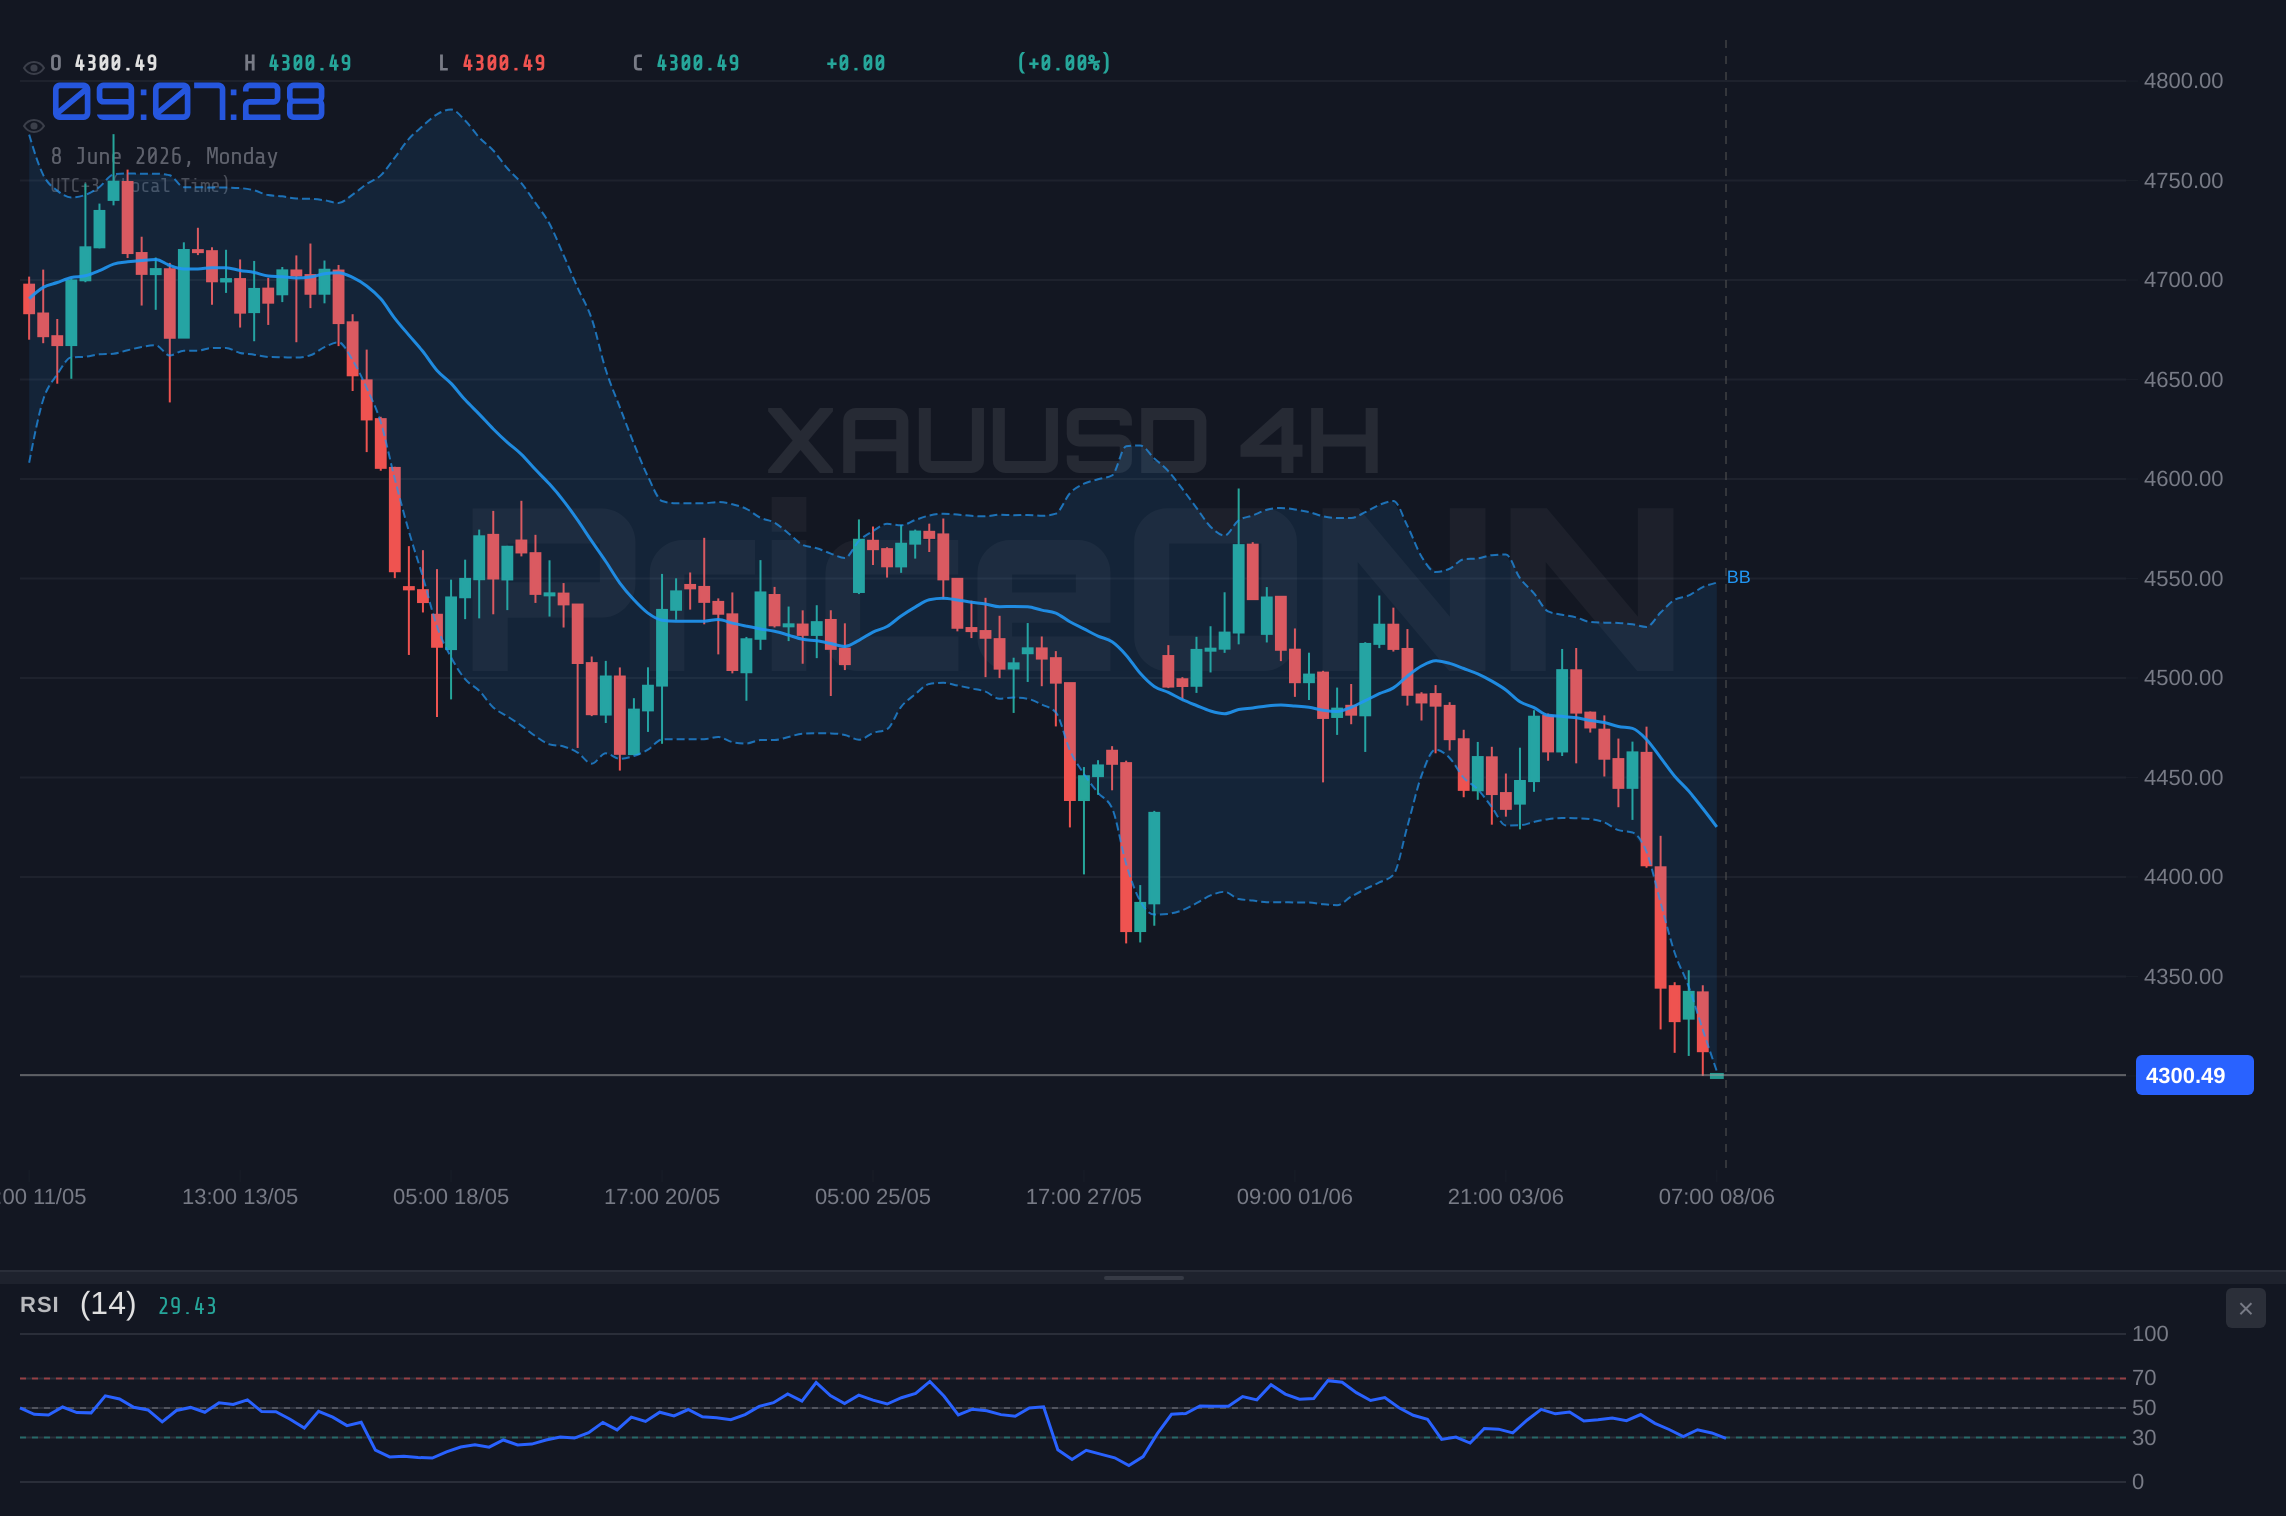
Here is the puzzle that should be keeping gold bulls awake at night: missiles are flying over the Middle East, equity desks are nursing a brutal Nasdaq selloff, and yet the ultimate safe-haven asset just shed nearly 4% in a single session. XAUUSD today analysis shows gold trading at $4,297.41, down 3.97% on the day, after slicing through a stack of support levels that looked solid only 24 hours ago. When the world gets scary and gold falls anyway, you stop asking where price is going and start asking why it is moving at all.
- XAUUSD collapsed 3.97% (-177.73 points) to $4,297.41, breaking below the entire daily support structure that began at $4,427.68.
- The dollar index (DXY) surged 0.66% to 99.85, printing a daily RSI of 65.75 and pushing above its upper Bollinger band, the single biggest weight on gold right now.
- Daily RSI at 32.93 and 4-hour RSI at 27.98 flag deeply oversold conditions, but a 4-hour ADX of 23.57 and daily ADX of 26.84 confirm the downtrend still has fuel.
- This week's US CPI release and building Fed rate-hike expectations are the macro catalysts driving real yields higher and gold lower.
Time Horizon: This analysis blends the 1-hour, 4-hour and daily charts for intraday and swing traders watching XAUUSD support and resistance into the CPI print.
The Dollar Is Eating Gold's Lunch
Start with the one chart that explains almost everything. The dollar index ripped 0.66% higher to 99.85, closing the session right at the top of its daily range of 98.89 to 99.85. That is not a quiet drift higher; that is a directional surge. The daily DXY reading shows price pushing above the upper Bollinger band with a clean AL (buy) signal across all eight oscillators, and an RSI of 65.75 that still has room to run before hitting the overbought wall. On the 4-hour frame the dollar is even hotter, with RSI at 72.34 and an unambiguous 7-to-1 buy tally.
Gold and the greenback move like two kids on a seesaw. When DXY at 99.85 powers higher, every ounce of gold priced in dollars gets mechanically more expensive for the rest of the world, and demand cools. This is textbook XAUUSD market sentiment in action: the metal did not fall because safe-haven appeal vanished overnight, it fell because the denominator in the equation got a lot stronger. Until the dollar's daily RSI rolls over and that ADX of 20.81 stops pointing north, rallies in gold are going to keep running into a brick wall.
Why the Fed Hike Narrative Is the Real Catalyst
Gold pays no interest. That single fact is why the metal lives and dies by interest-rate expectations, and right now those expectations are moving violently against it. The macro backdrop has flipped from a comfortable rate-cut story to something far more hostile. According to forex desk commentary this week, US CPI leads a high-stakes calendar in which Fed hike expectations are actually building, an unusual setup driven by the recent oil shock and a string of resilient employment data.
Strong US labor figures have done the heavy lifting. When jobs data comes in hot, the market prices in a Fed that stays restrictive for longer, which drags real yields higher. Higher real yields raise the opportunity cost of holding a zero-yield asset, and gold gets sold. The economic calendar this week carries a high-impact US inflation reading with a forecast of 0.3% against a previous 0.2%, alongside an employment metric forecast at 4.3%. If CPI prints above that 0.3% estimate, the hawkish case gets stronger, the dollar extends, and gold's path of least resistance stays lower. If it disappoints, the entire oversold setup could snap back hard.
A hotter-than-expected CPI print would validate the Fed-hike narrative and likely accelerate the breakdown. A soft print is the single most probable trigger for a violent oversold bounce given how stretched the daily RSI already is.
The Safe-Haven Bid Got Hijacked by Oil and Equities
Normally, the headlines crossing this week would be rocket fuel for gold. Oil prices spiked after Iran launched a ballistic missile attack on Israel, with Brent jumping 1.96% to $99.91 and WTI climbing 1.2% to $95.56. Tanker traffic through the Strait of Hormuz has reportedly collapsed by 90% to 95% versus pre-war levels. That is a genuine geopolitical shock, the kind that usually sends capital sprinting into bullion.
So why did gold ignore it? Because the safe-haven flow chose different vehicles. The dollar absorbed the risk-off bid this time, and the inflation impulse from spiking crude actually reinforced the hawkish Fed story rather than the haven story. Meanwhile the equity picture turned ugly fast, with the Nasdaq 100 cratering 4.45% to 28,985.01 as the AI trade cracked. When a leveraged Nasdaq position blows up, traders often liquidate winners to cover losers, and gold had been one of the year's biggest winners. That mechanical de-grossing is a classic liquidity grab, and it helps explain why a falling stock market did not lift the metal the way the textbook promises.
What the RSI and ADX Are Really Telling Us About XAUUSD Trend Analysis
Now this is where the chart gets genuinely interesting. On the daily timeframe, momentum is screaming exhaustion: RSI sits at 32.93, hovering just above the oversold line, while the 4-hour RSI has already plunged to 27.98 and the 1-hour to 27.67. Three timeframes pointing at oversold is the kind of confluence that makes bargain hunters reach for the buy button. But here is the catch that separates disciplined traders from the impatient: oversold is not a reversal signal, it is a condition.
The ADX is the tiebreaker. On the daily it reads 26.84, a strong-trend value, and the 1-hour ADX is a blistering 46.86, confirming that this downdraft has real conviction behind it. When ADX is this elevated and rising, oversold RSI readings can stay oversold far longer than a counter-trend trader can stay solvent. MACD agrees with the bears across every timeframe, sitting below its signal line with negative momentum throughout. The 4-hour Stochastic, with %K at a rock-bottom 7.85 below %D at 16.84, is buried in oversold territory, the kind of reading that precedes a bounce but offers zero guarantee on timing.
The conflict here is the whole story. Oversold RSI says "bounce soon," but a strong ADX of 26.84 on the daily says "the trend is your enemy." Confirmation matters more than prediction: wait for price to reclaim a broken level on rising momentum before trusting any low.
Where the Real Lines in the Sand Sit Now
The structure has been redrawn. Yesterday's support is today's resistance, and that flip is the most important takeaway for anyone trading XAUUSD support and resistance into the back half of the week. Gold has fallen clean through the entire daily support shelf that started at $4,427.68, which means that zone now caps the upside rather than cushioning the downside.
On the immediate intraday picture, price is fighting to hold the 1-hour support cluster at $4,291.98, reinforced by the 4-hour level at $4,292.07. Lose that, and the next meaningful floor is the 4-hour support at $4,274.10. To the upside, sellers are now defending the 1-hour resistance band at $4,306.07, with the heavier 4-hour pivot at $4,317.17 standing between price and any attempt to reclaim the broken $4,336.53 daily level. A trader watching for genuine stabilization wants to see XAUUSD key levels reclaimed on a closing basis, not just wicked through during a liquidity sweep.
Three Ways This Plays Out From Here
Given the conflict between a punishing downtrend and deeply oversold momentum, the probabilities lean bearish in the near term, but the oversold spring makes a bounce a live risk. These are price-action scenarios, not trade instructions.
Continuation: The Dollar Keeps Winning
55% ProbabilityOversold Snapback: The CPI Relief Bounce
25% ProbabilityCoiled Range: Waiting for the Print
20% ProbabilityWhat Different Traders Should Watch
For the scalper, the 1-hour ADX at 46.86 is a gift and a warning: trends this strong reward selling rallies into $4,306.07 but punish anyone trying to catch the falling knife before momentum confirms a turn. For the swing trader, the daily RSI at 32.93 is the level to monitor; a daily close back above $4,336.53 would be the first real evidence that the trend is healing. And for the longer-term investor, the bigger question is structural: gold's secular drivers, central-bank buying and de-dollarization, have not changed, even if a surging DXY is forcing a painful repricing this week. A 4% drop in a structurally bullish asset is the kind of volatility that creates entry zones for the patient.
| Indicator | Value | Signal | Interpretation |
|---|---|---|---|
| RSI (14) Daily | 32.93 | Neutral | Near oversold, downside momentum fading but not reversed |
| RSI (14) 4H | 27.98 | Oversold | Stretched to the downside, bounce risk rising |
| MACD Daily | Below signal | Bearish | Negative momentum confirms the sellers |
| ADX Daily | 26.84 | Strong trend | Downtrend has conviction; fade with caution |
| Stochastic 4H | K 7.85 / D 16.84 | Oversold | Deeply washed out, primed for mean reversion |
| DXY Daily | 99.85 | Headwind | Dollar strength is the dominant weight on gold |
Frequently Asked Questions: XAUUSD Analysis
What happens if XAUUSD breaks below $4,291.98 support?
A confirmed hourly close below the $4,291.98 cluster opens the door to the 4-hour support at $4,274.10. With the 1-hour ADX at 46.86 signaling a powerful downtrend, a break there carries momentum, so traders would watch for follow-through selling rather than an immediate bounce.
Is the daily RSI at 32.93 a buy signal for XAUUSD right now?
Not on its own. An RSI near oversold flags exhaustion, but the daily ADX of 26.84 confirms a strong downtrend that can keep RSI suppressed. Confirmation, such as a reclaim of $4,317.17 on rising momentum, is needed before treating the oversold reading as a turn.
Why did gold fall 4% to $4,297.41 despite the Iran-Israel conflict?
The safe-haven bid flowed into the dollar instead of gold, with DXY surging 0.66% to 99.85. The oil spike from the conflict also fed inflation fears that strengthen the Fed-hike narrative, pushing real yields up and weighing on the zero-yield metal.
How will this week's US CPI release affect XAUUSD?
CPI is forecast at 0.3% versus a previous 0.2%. A hotter print would reinforce Fed-hike expectations, lift the dollar, and likely extend gold's breakdown toward $4,274.10. A softer print is the most probable trigger for an oversold snapback toward $4,317.17 and $4,336.53.
The picture into CPI is a tug-of-war between a dollar that refuses to quit and a momentum profile stretched to its limit. Sellers hold the keys while DXY stays above 99.80 and the daily ADX points higher, yet the deeper the RSI sinks, the more violent the eventual relief bounce becomes. Watch $4,291.98 as the trigger and $4,317.17 as the proof of a turn; the inflation print will likely decide which one breaks first.
Track markets in real-time
AI-powered analysis, technical indicators and real-time price data.
Join Our Telegram Channel
Breaking market news, AI analysis and trading signals instantly.
Join Channel