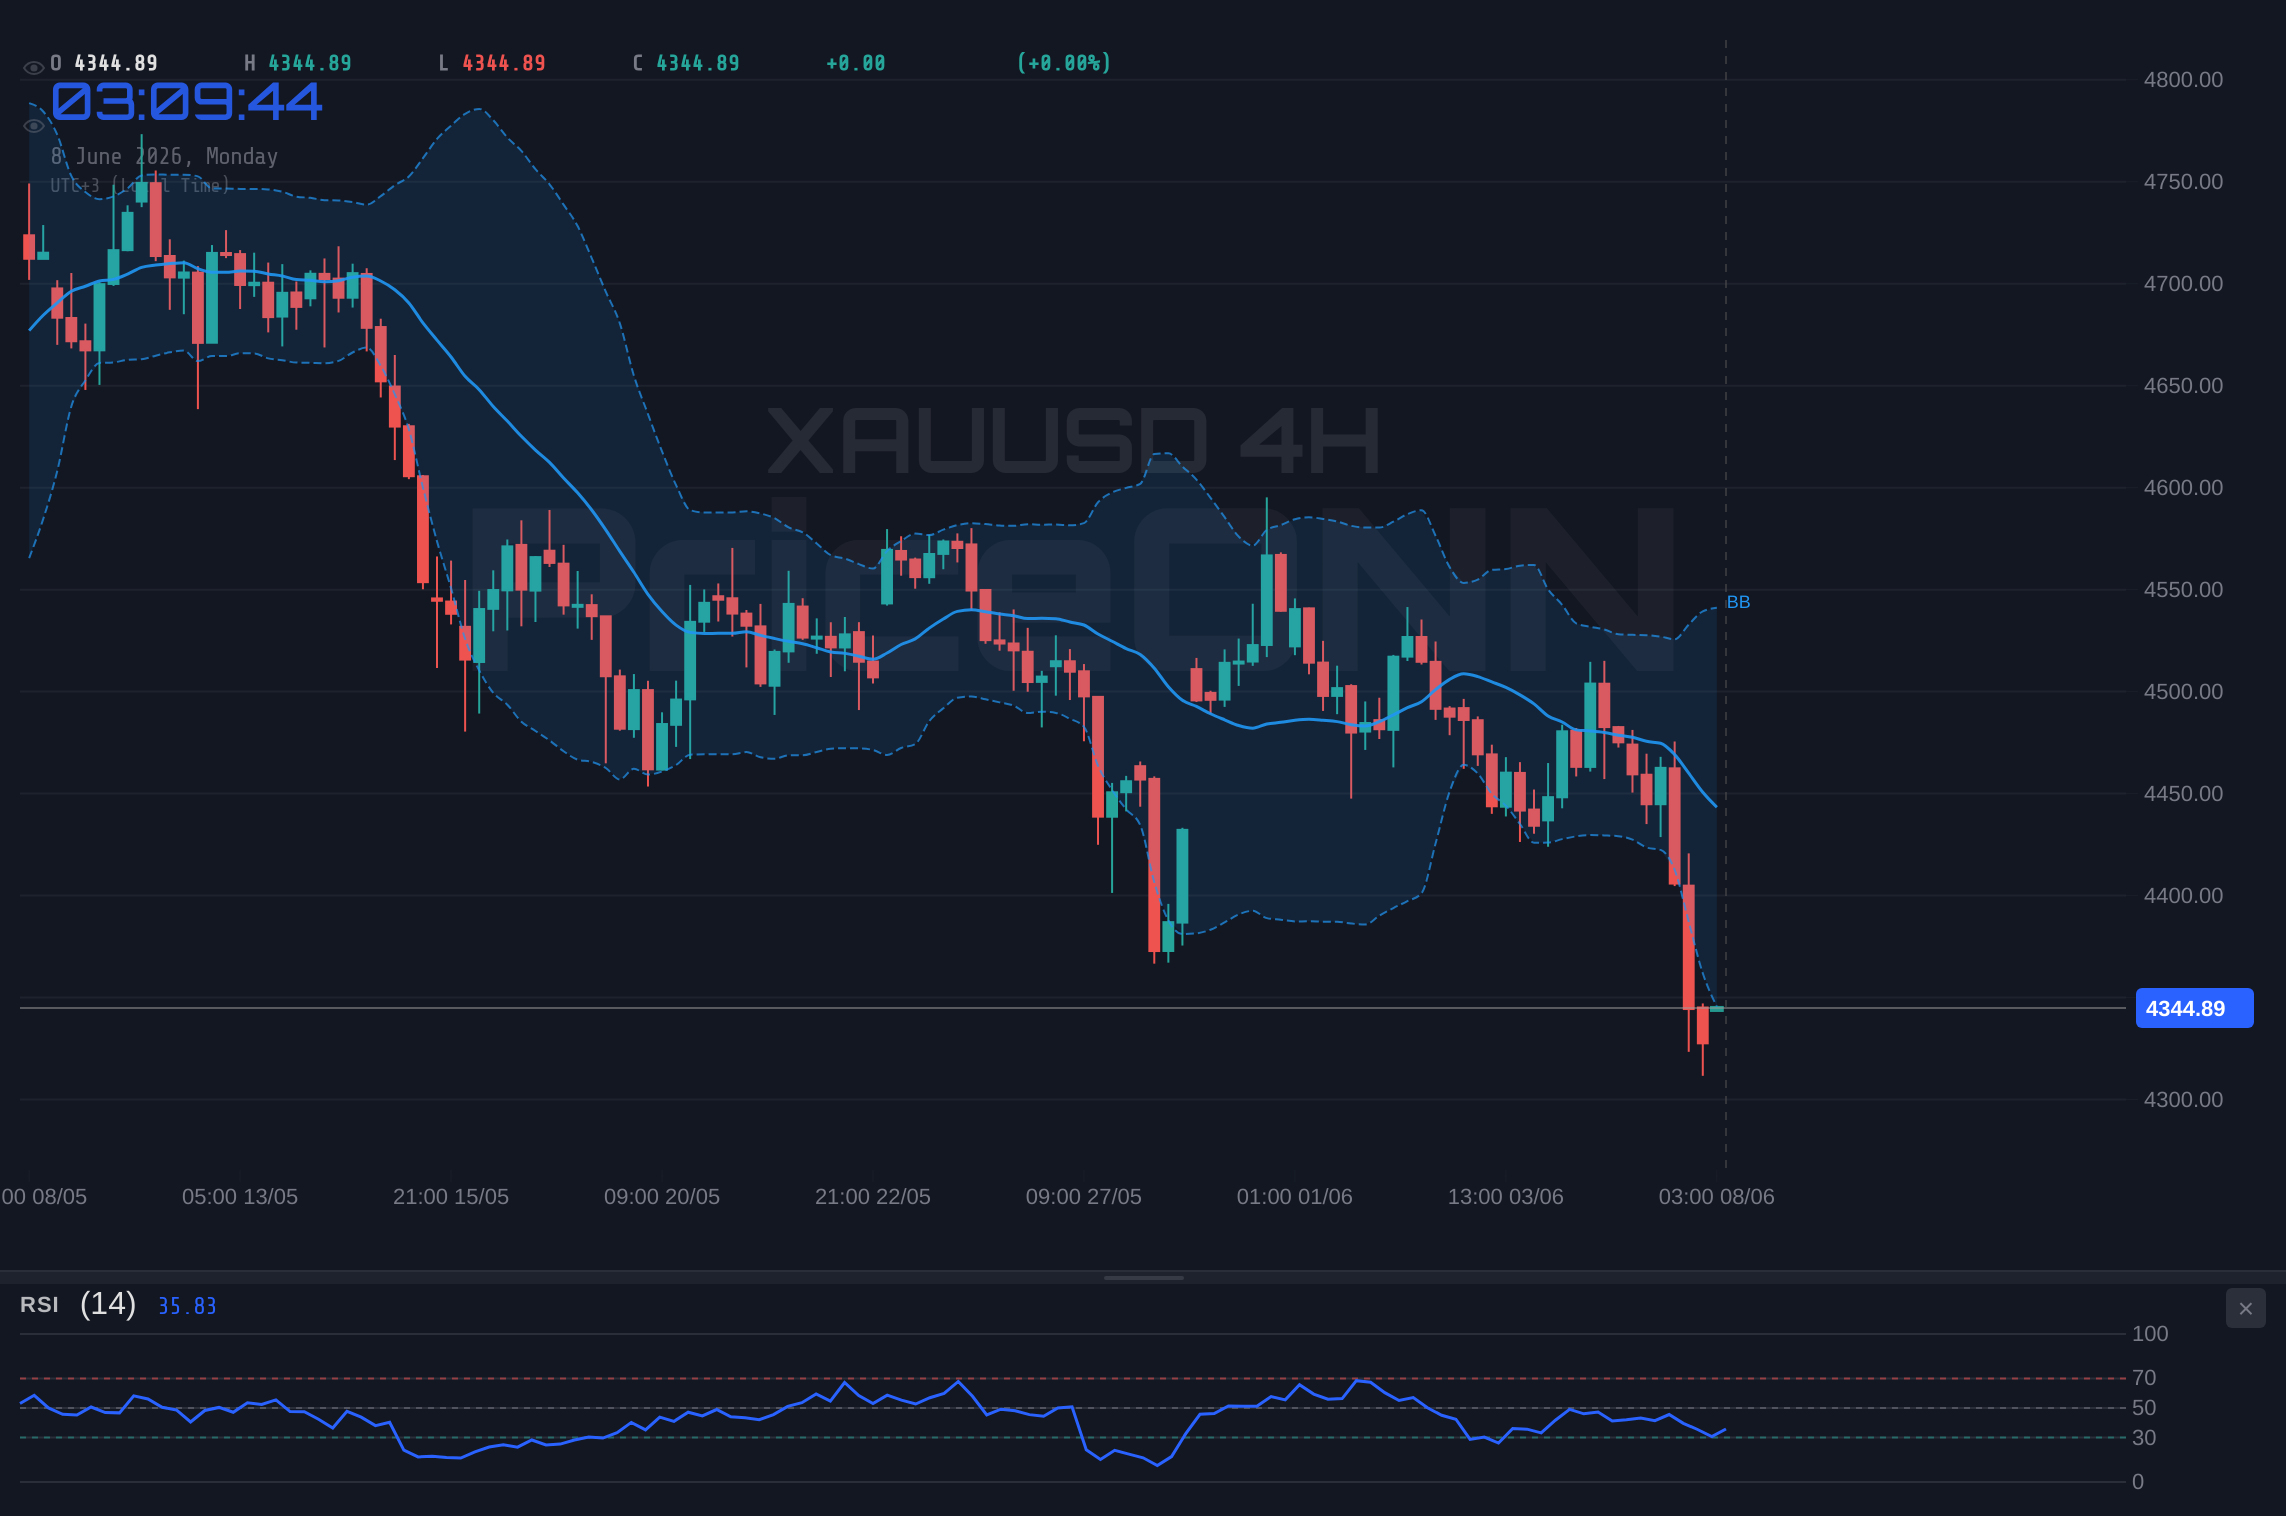
Three percent. That is how much gold gave back in a single session, and the candle that did the damage is hard to ignore. XAUUSD is changing hands at $4,343.05, down $132.08 on the day after touching $4,481.21 at the highs before sellers took the wheel. For anyone running XAUUSD today analysis, the question is no longer whether momentum turned. It did. The question is whether this is a controlled pullback inside a larger uptrend or the opening act of something deeper.
Time Horizon: This analysis blends intraday (1H), swing (4H), and positional (Daily) timeframes, with the primary actionable window being this week.
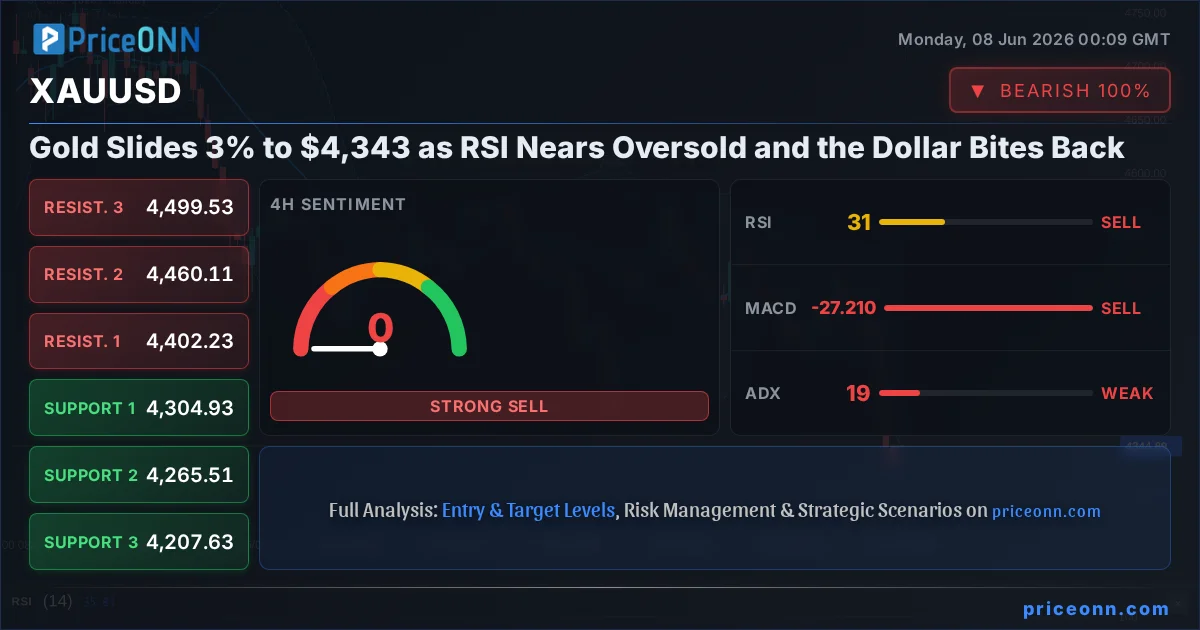
- XAUUSD trades at $4,343.05, down 2.95% (-$132.08) after rejecting the $4,481.21 daily high.
- The 4H RSI sits at 30.43 and the 1H reading at 34.64; gold is pressing toward oversold but is not fully there yet.
- The 4H ADX at 19.49 signals a choppy, non-committed trend, which is exactly why this is a watch zone rather than a clean short.
- A rising DXY at 99.84 (+0.66%) following strong US Nonfarm Payrolls is the fundamental weight pinning gold lower.
Here is the line everyone is watching: $4,336.53, the nearest daily support. Price is hovering just above it. Hold that, and the bulls keep a seat at the table. Lose it on a daily close, and the conversation shifts fast. Let me walk you through the three ways this likely plays out, because the technical picture is genuinely split right now.
What the Friday Jobs Shock Did to XAUUSD Trend Analysis
Let's set the scene before we touch the charts. According to RTTNews reporting on the commodities tape, gold prices plummeted on Friday as economists digested a robust US Nonfarm Payrolls report. Strong jobs data does one thing reliably: it pushes back rate-cut expectations, lifts Treasury yields, and hands the dollar a tailwind. You can see the fingerprints all over today's quote board.
The Dollar Index is up 0.66% at 99.84, and on the 1H chart its RSI is screaming at 81.63 with ADX at 37.45, a genuinely strong uptrend. That matters enormously for gold. The inverse relationship between bullion and the greenback is one of the most durable correlations in macro, and right now the dollar is doing the heavy lifting on the bearish side. With DXY this overbought, though, the move is stretched, and a dollar breather could give gold room to stabilize.
There is a broader risk backdrop too. Markets ended last week defensive, with one widely circulated forex note flagging a triple threat: a cracking AI trade, renewed Fed risk, and an escalating Iran conflict. Normally Middle East tension is rocket fuel for safe-haven gold. The fact that XAUUSD fell anyway tells you the dollar and the yield story overwhelmed the geopolitical bid this session. That is a subtle but important read on market sentiment analysis: when gold cannot rally on conflict headlines, the path of least resistance is sideways to lower until the dollar relents.
Looking ahead, the calendar is the wildcard. One economics preview pegged May US CPI at a 0.5% monthly rise, with year-over-year inflation showing renewed upward pressure. A hot inflation print cuts both ways for gold: it reinforces the inflation-hedge narrative, but it also keeps the Fed hawkish and the dollar firm. Until that data lands, caution is warranted, and the technical setup reflects exactly that hesitation.
Reading the Tape: Why XAUUSD Support and Resistance Tells a Mixed Story
Now this is where it gets interesting. The multi-timeframe analysis does not all point the same direction, and that disagreement is the whole story.
On the 1H chart, the trend is firmly down with 100% strength, and the ADX at 43.36 confirms sellers are in real control of the short-term picture. RSI here reads 34.64, leaning bearish but not yet oversold. The MACD sits below its signal line with negative momentum, no surprise given the day's slide. But notice the Stochastic: K at 21.35 has crossed above D at 9.8, a tentative bullish cross deep in low territory. That is the first whisper that the intraday selling may be getting tired.
Drop to the 4H and the picture muddies in a telling way. RSI is at 30.43, kissing oversold, and price has slipped below the lower Bollinger band, which often flags either capitulation or a coming snap-back. Yet the 4H ADX is just 19.49. That weak reading is the single most important number on the board. A trend strength under 20 means the broader 4H structure is choppy and range-prone, not trending cleanly. In plain terms: the bears have momentum on the 1H, but they have not committed on the 4H. Chasing a short into that kind of indecision is how traders get stopped on the retest.
The daily timeframe keeps the bearish bias, with trend strength at 98% and RSI at 34.98, but here is the quirk worth flagging for honest XAUUSD key levels work: the daily pivot supports print at 4427.68, 4380.23, and 4336.53, while resistance sits up at 4518.83 and above. Price at $4,343.05 is wedged just above that 4,336.53 daily floor. That confluence, where the daily support overlaps with the broader structure, is the battleground.
RSI nearing oversold usually whispers buy, but the 1H ADX at 43.36 says the downtrend still has teeth. When a momentum oscillator and a trend-strength gauge disagree, you wait for confirmation rather than front-running the bounce. The 4H ADX at 19.49 is the tiebreaker, and it says: no clean trend, stay patient.
| Indicator | Value | Signal | Interpretation |
|---|---|---|---|
| RSI 1H | 34.64 | Bearish | Leaning weak, not oversold yet |
| RSI 4H | 30.43 | Stretched | Pressing oversold, bounce risk rising |
| MACD (all TFs) | Negative | Bearish | Below signal line, momentum down |
| Stochastic 1H | 21.35 / 9.8 | Bull cross | K above D, early reversal hint |
| ADX 1H | 43.36 | Strong | Powerful short-term downtrend |
| ADX 4H | 19.49 | Weak | Choppy, no committed trend |
The Bull's Roadmap: Can the $4,336 Floor Spark a Snap-Back?
Let's give the bulls their fair hearing, because the oversold readings are doing some work here. The case for recovery rests on confluence: the 4H RSI at 30.43, price below the lower Bollinger band, and that 1H Stochastic bull cross all line up to suggest the selling is overextended in the short run.
For this to mean anything, price needs to defend $4,336.53 and then reclaim the 1H resistance band. A move back above $4,348.67 would be the first technical green light. The real confirmation, though, comes higher: the 4H resistance at $4,402.23 is the gate. IF gold can close a 4H candle above $4,402.23, THEN the door opens toward $4,460.11 and potentially the $4,499.53 region where the next 4H resistance waits. That would require the dollar to cool from its overbought 99.84 perch, which is plausible given the 1H DXY RSI at 81.63 is itself stretched.
The honest caveat: this is a counter-trend thesis on the daily timeframe, and counter-trend trades need tight risk and clear invalidation. A bounce that fails to clear $4,348.67 is just noise inside a downtrend, not a reversal.
Where Bears Take Control: The Path Below $4,336
This is the higher-probability road, and the structure says so. The 1H trend strength at 100% and ADX at 43.36 mean sellers own the immediate tape. The catalyst is fundamental and clean: a firm dollar on the back of strong payrolls, with the inflation print ahead capable of extending the move.
The trigger to watch is a decisive daily close below $4,336.53. Lose that floor and the 1H supports at $4,308.05 and $4,298.89 come into play quickly, with $4,287.74 beneath them. Below the intraday zone, the 4H structure points to a deeper measured move toward $4,265.51 and, if momentum accelerates, the $4,207.63 region from the 4H pivot map. That is roughly a 3% extension from current levels, the kind of follow-through that fits a market where the daily ADX at 26.75 confirms a genuine downtrend.
Worth noting from the cross-asset board: silver got hammered far harder than gold today, down 7.72% to $68.15 with a 4H RSI of 21.52. When the higher-beta metal leads to the downside this aggressively, it signals broad de-risking in the precious metals complex, which keeps pressure on gold as a sympathy move.
The Waiting Game: What Keeps Gold Pinned in a Range
And then there is the scenario the 4H ADX is practically begging for: nothing decisive at all. With trend strength at just 19.49 on the 4H, the most technically honest base case is that XAUUSD chops between the $4,336.53 floor and the $4,348.67 to $4,402.23 ceiling while the market waits for the inflation data to break the tie.
In a range regime, the oversold oscillators bleed off sideways rather than through a sharp bounce, and the strong dollar keeps a lid on any rally attempt. This is the frustrating but common outcome when momentum (bearish) and trend strength (weak) disagree. Volume tends to dry up, breakout attempts get faded, and patience becomes the only edge. For traders, a range like this is not a no-trade zone, it is a wait-for-the-edges zone.
Breakdown Continuation: The Dollar Keeps Winning
60% ProbabilityThe Chop Zone: Indecision Until CPI
25% ProbabilityOversold Snap-Back: The Bulls Counterpunch
15% ProbabilityWhich Scenario Wins, and Why It Is a Watch Zone
Bana sorarsanız, weighing the evidence, the breakdown continuation carries the highest probability at roughly 60%. The dollar tailwind is real, the daily and 1H trends agree on direction, and the silver collapse confirms broad metals weakness. But, and this is the crucial but, the 4H ADX at 19.49 is precisely why this is a watch zone and not a green-light short. A trend strength reading that weak means the breakout has not committed. Front-running it risks getting chopped on a violent oversold bounce powered by that 30.43 RSI.
So the disciplined approach is conditional. The clean setup does not exist yet; it is one daily close away. A daily close below $4,336.53 would confirm the bears and validate continuation toward $4,308 and below. Until that close prints, or until price reclaims $4,402.23 to flip the script, the highest-expectancy move is to wait for the edge rather than guess the middle.
Scalpers can fade the 1H range extremes given the 100% trend strength, but must respect the Stochastic bull cross at 21.35/9.8. Swing traders should sit on their hands until the $4,336.53 daily close resolves. Long-term holders treat any flush toward $4,265 as a level to monitor for accumulation, not panic, given the intact inflation-hedge narrative.
What I'm Watching This Week
Three triggers will resolve this standoff, and they are worth pinning to your screen:
- The $4,336.53 daily close. This is the single cleanest binary on the board. Below it, bears run. Above it, the range lives on.
- DXY behavior near 99.84. With the 1H Dollar Index RSI at a frothy 81.63, any dollar pullback hands gold breathing room. A continued dollar grind higher buries it.
- The US inflation print. With May CPI pegged near a 0.5% monthly gain, a hot number keeps the Fed hawkish and the dollar bid; a soft number could be the catalyst that triggers the oversold snap-back toward $4,402.23.
Frequently Asked Questions: XAUUSD Analysis
What happens if XAUUSD breaks below $4,336.53 support?
A decisive daily close below $4,336.53 would confirm the bearish continuation and open the path toward the 1H support cluster at $4,308.05, then $4,298.89. If selling accelerates, the 4H structural support at $4,265.51 becomes the next major target, roughly a further 2% lower.
Should I buy XAUUSD at current levels of $4,343 with RSI near oversold?
Buying here is a counter-trend bet, so it carries elevated risk. The 4H RSI at 30.43 is stretched, but the 1H ADX at 43.36 shows the downtrend still has strength, so a long only makes sense after price defends $4,336.53 and reclaims $4,348.67. Without that confirmation, you are catching a falling knife.
Is the 4H ADX at 19.49 a sell signal for XAUUSD right now?
No, quite the opposite. An ADX below 20 signals a weak, non-committed trend, which means the 4H timeframe is choppy and range-prone rather than cleanly trending. That reading is precisely why this is a watch zone: it warns against chasing the breakdown until trend strength rebuilds.
How will the upcoming US CPI data affect XAUUSD this week?
With May CPI expected near a 0.5% monthly rise, a hotter-than-forecast print would likely keep the Fed hawkish and the dollar firm at 99.84, pressuring gold toward $4,308 and below. A softer print could trigger the oversold bounce, giving bulls a shot at the $4,402.23 resistance gate.
Volatility like today's slide is not a threat, it is opportunity in disguise for the prepared. The market just handed traders a crystal-clear decision level at $4,336.53 and a clean confirmation gate at $4,402.23. Let price tip its hand first, manage your risk into the inflation data, and remember that the market always offers a second entry. The patient ones get paid.
Track markets in real-time
AI-powered analysis, technical indicators and real-time price data.
Join Our Telegram Channel
Breaking market news, AI analysis and trading signals instantly.
Join Channel