Forget the soft landing chatter for a second. Last week the Nasdaq100 did something the other major indices refused to do: it broke. While the S&P 500 and the Dow ended Friday in the green, the tech-heavy index bled out, closing at 28,791.34 after a savage 5.41% slide that wiped 1,646.83 points off the board in the session. That is not a wobble. That is the AI trade getting a reality check.
This is a weekend wrap, so markets are shut and nobody is chasing ticks right now. Good. That gives us room to do the thing most traders skip: sit with the chart, separate the noise from the structure, and figure out what actually has to happen before the bulls can talk about 30,320 again. Any honest Nasdaq100 weekly outlook has to start with one uncomfortable fact: the index closed below the 30,000 handle and below almost every pivot the algorithms had drawn during the week. The damage is real.
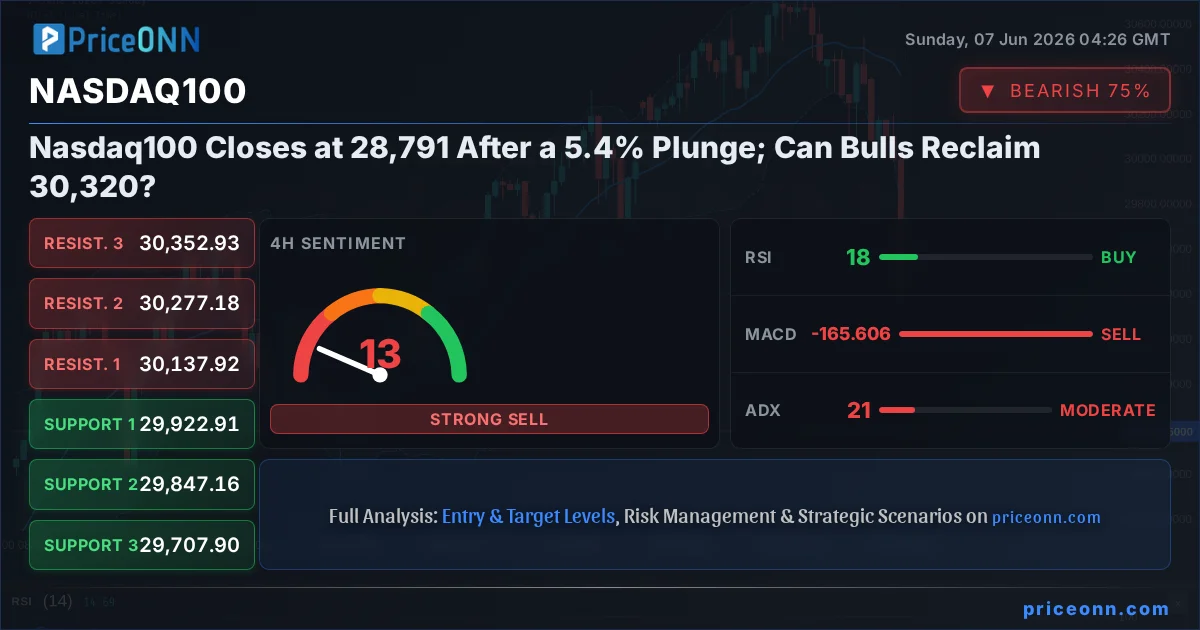
- Nasdaq100 closed the week at 28,791.34, down 5.41% (-1,646.83) on the session, breaking decisively below the 30,000 psychological level.
- The 1-hour RSI sits at a deeply oversold 13.09 with Stochastic at 6.96/9.94, signalling a stretched, exhausted tape rather than a healthy decline.
- The divergence is the story: S&P 500 rose 0.74% to 6,572.87 and the Dow added 0.07%, so this was a tech-specific liquidation, not a broad market crash.
- Bulls have nothing to prove until price reclaims 28,985 and then 29,363; the 30,320 daily pivot is the real line that separates recovery from a relief bounce.
- DXY firmed to 99.8 (+0.56%) with an overbought RSI of 79.59, and US CPI lands next week as the catalyst that decides the Fed patience narrative.
Time Horizon: This is a weekly review and a next-week roadmap, framed for swing traders and active investors planning the days ahead, not an intraday call.
The Week the AI Trade Finally Cracked
Here is what made this drop different. For months the Nasdaq100 has been the horse everyone rode higher, dragging the broader tape along with it. Last week that engine seized. A 5.41% single-session decline on a major equity index is the kind of move that does not happen on profit-taking alone; it happens when positioning is crowded and someone hits the exit first.
The catalyst was not a mystery. As one widely circulated forex desk note put it on June 6, markets faced a triple threat as the AI trade cracked, Fed risk rose, and the Iran conflict escalated. The piece described a tape that spent May climbing steadily on the back of the artificial intelligence narrative, only to end the following week in a far more defensive mood. That defensiveness landed squarely on the names that make up the Nasdaq100. When the most expensive, most loved corner of the market gets repriced, the index that concentrates those names is where the pain shows up first.
Notice what this is and what it is not. This is a Nasdaq100 news impact event, a sentiment unwind in high-multiple growth and AI exposure. It is not, at least not yet, a synchronized risk-off across every asset class. That distinction matters enormously for how you read the days ahead, and it is exactly where most of the panic-driven analysis is going to get it wrong.
A Tale of Two Markets: Why Nasdaq100 Bled While the Dow Yawned
Run the cross-market sentiment analysis and the picture sharpens immediately. On the same Friday that Nasdaq100 dropped 5.41%, the S&P 500 actually rose 0.74% to 6,572.87, and the Dow Jones 30 ticked up 0.07% to 50,723.51. Read that again. Two of the three headline US indices closed higher while the tech index cratered.
That is a textbook decoupling, and it tells you where the stress is concentrated. Capital did not flee the equity market wholesale; it rotated out of high-beta technology and AI exposure and into the value-heavy, industrial, and defensive corners that dominate the Dow. This is the kind of multi-timeframe analysis signal that separates a structural top from a sector rotation. When the Dow holds and the Nasdaq breaks, the message is selective de-risking, not a wholesale collapse of confidence.
A 5.41% Nasdaq100 drop on a day the Dow closes green is not a market crash; it is a concentrated unwind of the AI and mega-cap growth trade. The risk for bulls is that this rotation has further to run before tech finds a floor. The opportunity is that broad-market liquidity has not dried up, which keeps a sharp mean-reversion bounce firmly on the table.
Crypto offers a useful sanity check here too. Bitcoin held relatively firm at 61,544, down just 0.17%, while Ethereum slipped 0.85% to 1,587.80. If this were a genuine, blind-panic liquidity grab across all risk assets, you would expect crypto to be in freefall alongside tech. Instead, the bleed was orderly elsewhere and violent only in the Nasdaq. That is the fingerprint of a positioning flush, not a systemic event.
Reading the Oversold Tape Without Falling for the Trap
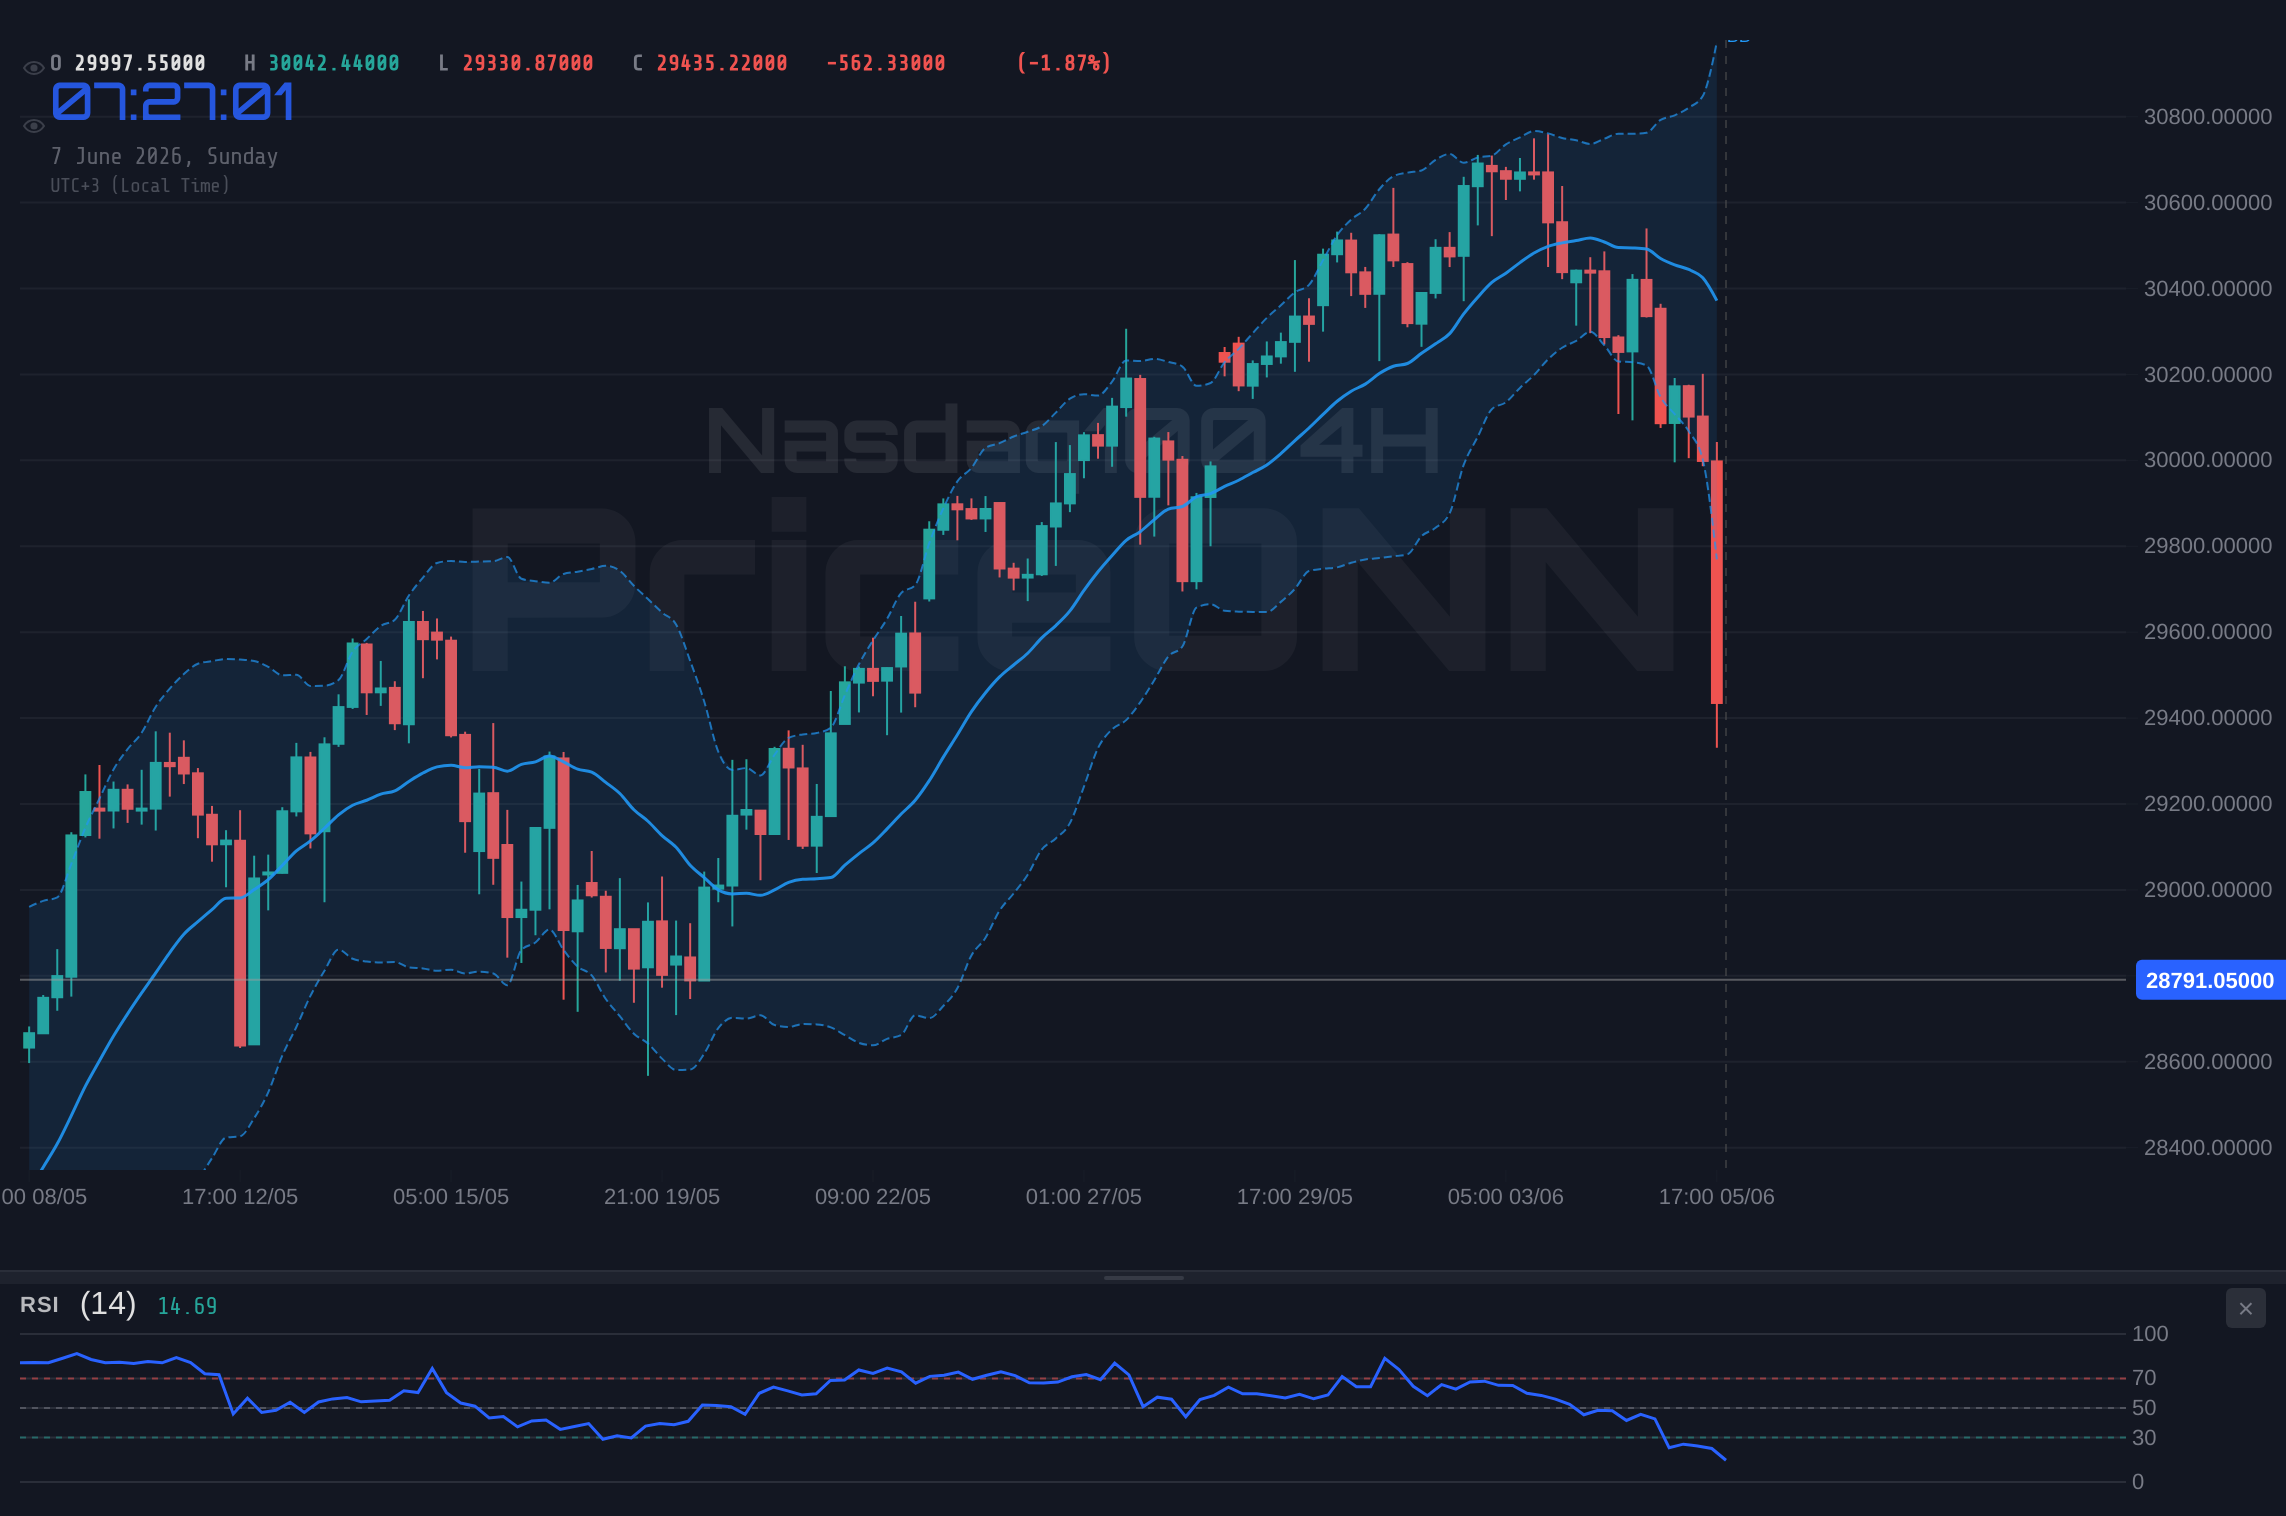
Now this is where it gets interesting, and where discipline matters. Pull up the Nasdaq100 RSI across timeframes and the readings scream exhaustion. On the 1-hour chart, RSI has collapsed to 13.09, one of the most stretched oversold prints you will ever see, with Stochastic pinned at 6.96 and 9.94. The 4-hour confirms the stress with RSI at 17.88. These are not levels that sustain themselves; selling this hard, this fast, eventually runs out of sellers.
But here is the trap, and it catches retail traders every single week: oversold does not mean buy. An RSI at 13 in the middle of a 5.41% liquidation is telling you the move is violent, not that it is over. The ADX backs this up. On the 1-hour chart ADX sits at a commanding 48.79, the signature of a powerful, committed downtrend. When ADX is that high and rising, fading the move is like stepping in front of a freight train because the brakes might engage soon.
The conflict between these signals is the entire point. RSI at 13.09 says exhaustion; ADX at 48.79 says the trend has real force behind it. That contradiction is precisely why this is a watch-and-wait situation rather than a knife-catching opportunity. Confirmation has to come before conviction.
Step back to the daily chart and a more balanced picture emerges. The daily Nasdaq100 RSI is a far more neutral 46.93, nowhere near oversold, with a daily ADX of 37.21 and MACD still tilted negative below its signal line. In plain terms: the intraday charts are screaming oversold, but the bigger-picture daily structure has only just begun to roll over. The higher timeframe has not capitulated. That gap between the panicked short-term tape and the still-composed daily chart is the single most important thing on the board right now.
When the 1H RSI is at 13 but the daily RSI is at 47, you are looking at a short-term liquidation inside a larger structure that has room to fall further. The smart play is not to guess the bottom; it is to let the oversold bounce happen, then judge the quality of that bounce against the reclaim levels below. A weak bounce that fails at 28,985 is a gift to the bears.
The 30,320 Question: Which Levels Broke and Which Ones Matter Now
Let us talk structure, because this is where the next-week roadmap lives. The reason 30,320 keeps coming up is simple: it was support, and support that breaks becomes resistance. The daily pivot structure had support resting at 30,320.22, with the 4-hour basing zone sitting around 29,922.91. Price did not just dip below those levels last week; it gapped through them and closed more than 1,500 points underneath. Every one of those former support shelves is now overhead supply that bulls have to chew through.
Working up from Friday's close at 28,791.34, the immediate map looks like this. The first true support beneath price is 28,607.15, the lowest pivot the live data defines. That is the line in the sand for the short term. Lose it on a sustained basis and there is thin air below, with no nearby data-defined shelf to catch the fall until a fresh base forms.
On the upside, the recovery ladder is steep and crowded. The first hurdles are 28,828.09 and then 28,985.39, the cluster price is currently wrestling with. Clear those and the 1-hour resistance band at 29,363.63, 29,584.57, and 29,741.87 comes into play. Only above roughly 29,920 does the broken 4-hour structure come back into view, and the headline 30,320.22 daily level sits above even that, with 30,657.72 capping the zone. For Nasdaq100 support and resistance purposes, treat everything between 29,000 and 30,320 as a wall, not a target you reach in a straight line.
So when the topic says bulls eye 30,320 next week, keep your expectations honest. That number is not next week's likely close; it is the level that, if reclaimed and held, would tell you the AI-trade unwind has genuinely stabilized. Getting there requires winning three or four separate skirmishes first. Price action analysis says respect the sequence: 28,985, then 29,363, then the 29,900s, then and only then 30,320.
Dollar Strength and the Fed's Patience Problem
You cannot read Nasdaq100 in a vacuum, and right now the macro backdrop is leaning against it. The Dollar Index firmed to 99.8, up 0.56% on the day, and its 1-hour RSI is blazing at 79.59, deep in overbought territory. A rising dollar tightens financial conditions and pressures the long-duration growth names that dominate the Nasdaq. With DXY this strong and this stretched, equity bulls are swimming against the current, even if the dollar itself is due for a breather given that overbought reading.
The fundamental driver behind the dollar bid is the labour market. According to a June 5 forex desk report, the dollar rose broadly after a much stronger-than-expected US employment report reinforced confidence that the Fed can stay patient, with USD/JPY clearing the 160 handle. We can see that in the data: USDJPY closed at 160.236, holding its gains. Strong payrolls plus a patient Fed is a headwind for rate-sensitive tech, because it pushes back the timeline for the rate relief that growth multiples crave.
And the calendar is about to turn the heat up. The high-impact US data on deck is dominated by inflation. One economics preview flagged renewed upward pressure in US inflation, with expectations for May CPI to rise 0.5% month-on-month. That is a hot number if it prints, and it lands while Fed Chair Warsh's first meeting approaches. Here is the asymmetry that should be on every Nasdaq100 trader's radar: a hotter-than-0.5% CPI would supercharge the dollar and the Fed-patience narrative, piling more pressure on tech. A cooler print would do the opposite and could be the spark that powers the oversold bounce toward those reclaim levels.
Next week's US CPI is the gatekeeper. Forecast points to a 0.5% monthly rise. A print at or above that keeps the dollar bid and caps Nasdaq100 rallies at the 28,985 to 29,363 resistance band. A softer print is the realistic trigger for a push at the 29,900 to 30,320 zone. Until that data resolves, caution is warranted and oversized positioning is a mistake.
Layer in the geopolitical premium. The same desk that flagged the cracking AI trade also pointed to escalating Iran conflict risk, and a separate week-ahead note highlighted elevated oil prices feeding into the inflation story. Oil itself actually plunged into the weekend, with Brent down 5.36% to 95.52 and WTI off 6.37% to 91.60, which paradoxically eases the near-term inflation impulse even as the geopolitical tail risk remains. For equities, that tug-of-war between falling energy prices and rising conflict risk is one more reason the tape is jumpy.
Three Ways Next Week Can Play Out
Let me lay out the scenarios cleanly, with probabilities based on the current technical picture. The strong short-term downtrend, the still-negative daily MACD, and the dollar backdrop tilt the odds toward the bears, but the deeply oversold readings keep a bounce very much alive.
Continuation Flush: The Unwind Has More to Give
50% ProbabilityOversold Base-Building: The Tape Catches Its Breath
30% ProbabilityOversold Snapback: Bulls Begin the Climb to 30,320
20% ProbabilityWhat Has to Happen First: The One Insight Worth Acting On
This is a watch-the-zone situation, not a back-up-the-truck moment, and I want to be precise about why. The daily ADX at 37.21 confirms a strong trend is in force, but the daily RSI at 46.93 sits in no-man's-land, and the Stochastic at 58.62 over 86.28 is already rolling lower. Partial alignment, not full conviction. When the longer-term momentum picture is this mixed and the short-term Stochastic is in an extreme, entry timing is genuinely uncertain. Chasing here is how accounts get hurt.
So here is the single actionable insight, and it is a level, not a price target. The reclaim of 28,985.39 is the first thing that has to happen before any bullish thesis earns the right to exist. A daily close back above 28,985 would open the door for a test of 29,363.63 and shift the burden of proof onto the bears. Until that reclaim prints, the path of least resistance points down, and the responsible stance is to let the market show its hand. Watch how price behaves at 28,985 on the first attempt; the quality of that test, whether it is rejected hard or absorbed and reclaimed, will tell you more than any indicator reading.
For the scalper, the deeply oversold 1H readings offer fast mean-reversion plays, but only with tight risk against 28,607, because that ADX at 48.79 means counter-trend trades are low-probability until momentum visibly stalls. For the swing trader, patience is the edge: the 28,985 reclaim is your green light, and the CPI release is the event that likely decides it. For the longer-term investor, a tech index down 5.41% in a session while the broader market holds is a watchlist event, not an emergency, and the levels above tell you exactly where conviction would return.
Frequently Asked Questions: Nasdaq100 Analysis
What happens if Nasdaq100 breaks below 28,607.15 next week?
A sustained 4-hour close below 28,607.15 would break the last data-defined support shelf and expose open territory beneath, with the 28,000 psychological handle as the next realistic magnet. That breakdown becomes far more likely if next week's US CPI prints above the 0.5% forecast and keeps the dollar bid. This is the highest-probability scenario at roughly 50% given the strong 1H ADX of 48.79.
Is the Nasdaq100 RSI at 13.09 a buy signal right now?
Not on its own. An RSI of 13.09 on the 1-hour chart is deeply oversold, but it is paired with an ADX of 48.79 that confirms a powerful downtrend, so the reading signals a violent move rather than a confirmed bottom. The daily RSI at a neutral 46.93 shows the higher timeframe has not capitulated, which is why confirmation through a reclaim of 28,985.39 is needed before treating oversold as actionable.
Why did Nasdaq100 fall 5.41% while the S&P 500 and Dow closed higher?
This was a concentrated unwind of the AI and mega-cap growth trade rather than a broad market crash. The S&P 500 rose 0.74% to 6,572.87 and the Dow added 0.07% to 50,723.51 on the same day, a classic decoupling that shows capital rotating out of high-multiple technology into value and defensive names. The selective nature of the selling is why a sharp mean-reversion bounce remains on the table.
How will next week's US CPI affect Nasdaq100?
CPI is the key catalyst, with forecasts pointing to a 0.5% monthly rise. A hotter print would reinforce the strong-dollar and Fed-patience narrative, with DXY already at 99.8, and likely cap any Nasdaq100 rally at the 28,985 to 29,363 resistance band. A cooler print would ease dollar pressure and is the most realistic trigger for a push toward the 29,922 and 30,320 zone.
Markets gave traders a rough week, but rough weeks are where the next setups are built. The Nasdaq100 has not broken the way the headlines suggest; it has flushed out crowded positioning while the broader market quietly held its ground. That distinction is the difference between fear and opportunity, and disciplined traders profit from knowing which one they are looking at.
Track markets in real-time
AI-powered analysis, technical indicators and real-time price data.
Join Our Telegram Channel
Breaking market news, AI analysis and trading signals instantly.
Join Channel