Here is the divergence that should make every tech bull pause: the S&P 500 closed the session higher by 0.74% at 6,572.87, yet the Nasdaq100 cratered almost 4% to $29,138.26. When the broad market climbs and the tech-heavy index bleeds on the same day, something structural is breaking beneath the surface. That is the puzzle this Nasdaq100 today analysis sets out to solve, and the answer sits in three battle lines drawn across the chart.
Time Horizon: This analysis blends intraday (1H) and swing (4H to daily) perspectives, aimed at traders positioning for the next one to five sessions.
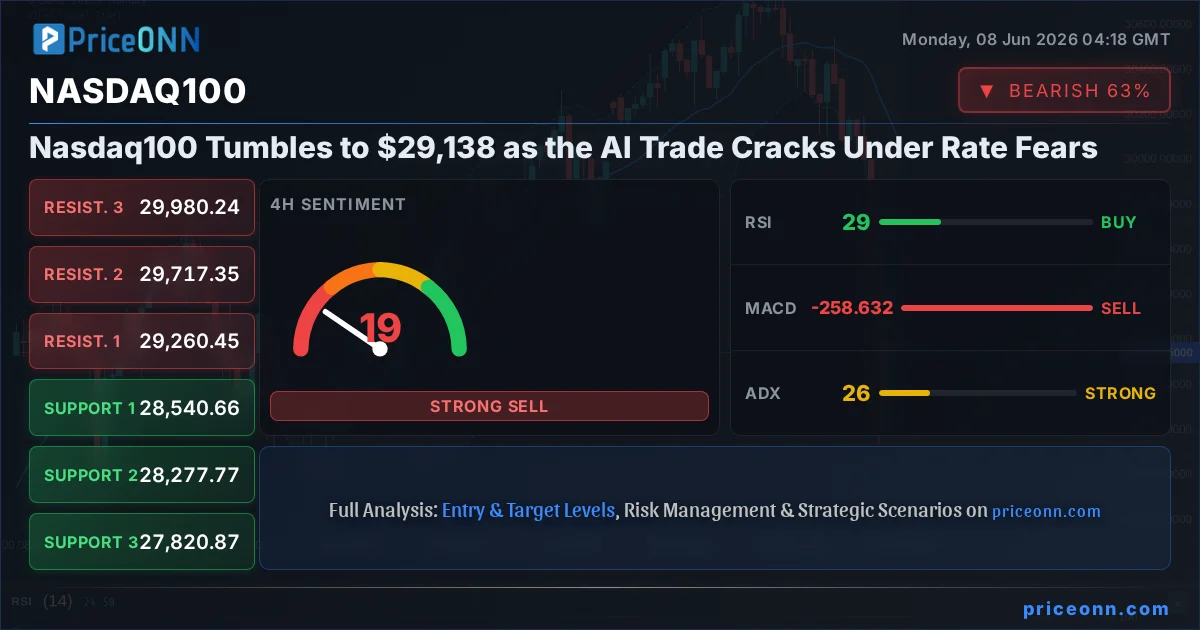
- Nasdaq100 dropped 3.95% (-1,197.5 points) to $29,138.26, badly underperforming the S&P 500's +0.74% gain on the same day.
- The 1H ADX at 53.33 confirms a very strong downtrend, while 4H RSI at 29.09 sits in oversold territory, hinting at a possible bounce inside the larger decline.
- First intraday support sits at 29,087.06, with the heavier 4H shelf at 28,540.66; reclaiming 29,224.56 is the bulls' minimum first task.
- A rising DXY at 99.78 (+0.6%) and strong U.S. jobs data are tightening financial conditions, the core macro pressure on high-multiple tech names.
Why $29,224 Is the Line Bulls Must Reclaim First
Let's start with the single number that frames the entire battle. Price is currently pinned at 29,138.26, sitting directly between immediate 1H resistance at 29,224.56 and 1H support at 29,087.06. That is a razor-thin band, and it tells you the index is balancing on a knife's edge after a brutal session that ran from a daily high of 30,364.44 all the way down to 28,734.66.
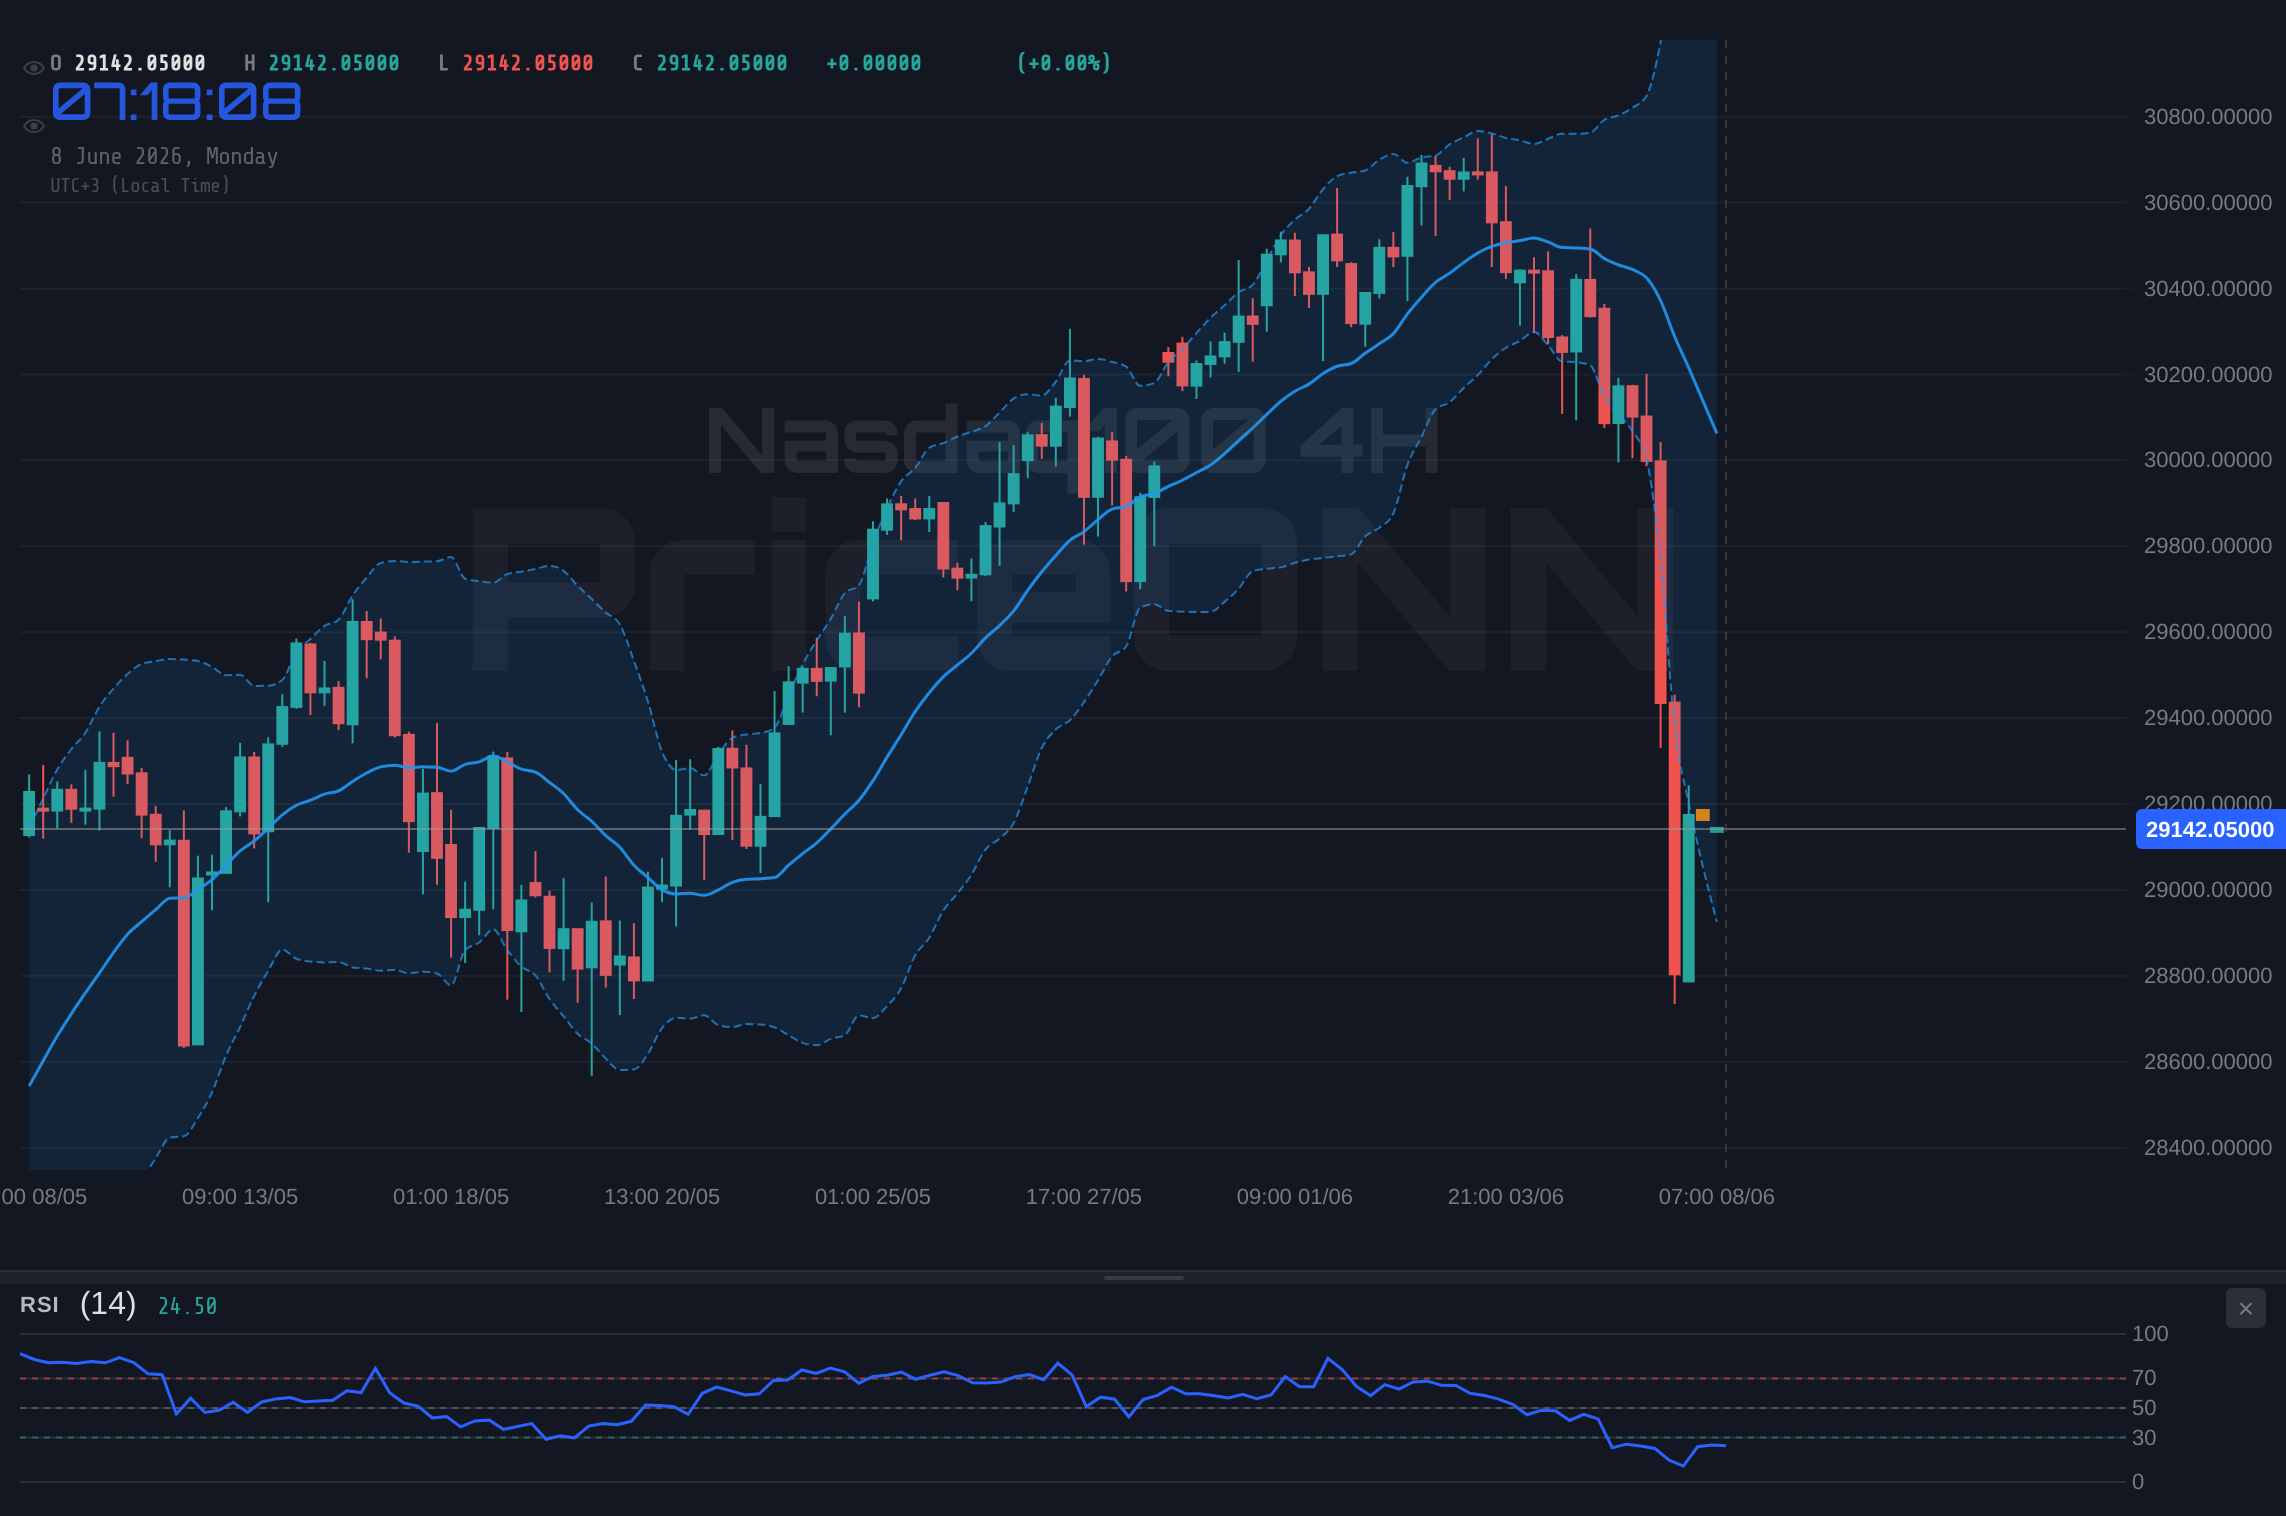
The momentum picture is unambiguous on the lower timeframes. On the 1-hour chart, the ADX reading of 53.33 is not just strong, it is the kind of number that screams a trend in full control, and right now that trend points down. MACD remains buried below its signal line with negative momentum, and price is trading under the middle Bollinger band. When ADX is this elevated and aligned with bearish momentum, fading the move is a high-risk game; the path of least resistance stays lower until proven otherwise.
Yet the 4-hour chart adds a wrinkle that disciplined traders cannot ignore. There, the RSI has fallen to 29.09, dropping into oversold territory, with Stochastic readings at K=11.6 and D=13.52, also deep in the basement. Price has slipped below the lower 4H Bollinger band, which historically marks zones where sharp relief rallies are born. So the chart is telling two stories at once: a dominant downtrend on intraday momentum, and a stretched, oversold rubber band on the swing view. Reconciling those two is exactly what the scenarios below do.
What the AI Trade Crack Tells Us About Nasdaq100 Trend Analysis
The macro backdrop explains why tech is being singled out. According to reporting circulating across markets this week, the narrative has shifted to a "triple threat" as the AI trade cracks, Fed rate risks rise, and the Iran conflict escalates. That framing matters because the Nasdaq100 is the index most exposed to all three. High-multiple growth names live and die by interest rate expectations, and the latest catalyst was strong U.S. employment data that, per the latest headlines, raised fresh U.S. rate fears.
This is where the cross-asset picture becomes critical. The Dollar Index is trading at 99.78, up 0.6% on the day, and its 1H RSI of 74.35 confirms an overbought but powerfully trending greenback. A firmer dollar tightens global financial conditions and pressures risk assets priced for perfection, and few assets are priced more aggressively than mega-cap tech. With DXY pushing toward its daily resistance band around 99.34 to 99.71 and holding above it, the wind is blowing against equities that depend on cheap money.
Now layer in the contradiction that opened this piece. The S&P 500 advanced 0.74% while the Nasdaq100 fell 3.95%. That rotation is the tell. Capital is not fleeing the market wholesale; it is rotating out of crowded AI and growth positioning into value, defensives, and energy. Speaking of energy, Brent crude jumped to 99.13 and WTI to 94.99 after, according to reporting, Iran launched a missile attack on Israel. Rising oil feeds the inflation narrative, which in turn feeds the rate-fear narrative, which in turn punishes long-duration tech. The chain is tight and self-reinforcing.
The Three Roads From $29,138: Mapping Nasdaq100 Support and Resistance
This is where it gets interesting. With momentum bearish but the swing view oversold, the index sits at a genuine fork. Below are the three roads it can take, each anchored to specific levels from the live data, each with a probability based on the current technical weight of evidence.
Where Bears Stay in Control: The Continuation Slide
60% ProbabilityThe Waiting Game: An Oversold Range Stalemate
25% ProbabilityThe Bull's Roadmap: An Oversold Relief Bounce
15% ProbabilityWhy does the bearish road carry the highest weight? Because trend strength trumps oversold readings until there is actual evidence of a reversal. The 1H ADX at 53.33 is a very strong trend signal, MACD is negative across the 1H, 4H, and daily charts, and the aggregate signal scoreboard reads SELL on every timeframe (7 of 8 indicators bearish on the 1H, 5 of 8 on the 4H, 6 of 7 on the daily). Oversold does not mean a bottom; in a powerful downtrend, oversold can stay oversold far longer than comfortable. The bounce scenario only earns a low probability precisely because there is no confirmation yet, no reclaimed level, no MACD cross, just a stretched indicator begging for relief.
The U.S. economic calendar is active, with high-impact USD releases on the docket and May CPI expectations pointing to renewed upward pressure. A hot inflation print would reinforce the rate-fear narrative and could accelerate the bearish scenario. Size positions accordingly and respect that headline risk can override technicals in seconds.
Nasdaq100 RSI and MACD Signal: Reading the Indicator Conflict
Look, this is exactly where you need to pay attention, because the indicators are not singing in unison and that conflict is the whole story. On the daily chart, the RSI sits at 49.72, essentially neutral, and the daily structure even flashes an upside trend score of 98%. But that daily optimism is being overwhelmed by the lower timeframes where the selling is actually happening. When daily momentum is neutral but intraday momentum is collapsing, it usually means a larger uptrend is undergoing a sharp corrective shock rather than a clean trend reversal. That nuance is why the range scenario deserves a respectable 25%.
The Stochastic picture sharpens the point. On the 1H, K=53.97 sits above D=30.65, a tentative bullish cross that argues for a short-term pause in selling. But on the 4H, K=11.6 lies below D=13.52, deep in oversold and still pointed down. One timeframe whispers bounce, the other screams exhaustion. The resolution will come from price itself: until 29,224.56 is reclaimed and held, the bearish read stays in the driver's seat. Confirmation, not anticipation, is the professional's edge here.
| Indicator | Value | Signal | Interpretation |
|---|---|---|---|
| RSI (14) 1H | 33.57 | Bearish | Weak, leaning lower but not yet oversold on 1H |
| RSI (14) 4H | 29.09 | Oversold | Stretched; relief-bounce risk for shorts |
| MACD (all TFs) | Negative | Bearish | Below signal line on 1H, 4H and daily |
| Stochastic 4H | 11.6 / 13.52 | Oversold | Deep basement, momentum still soft |
| ADX 1H | 53.33 | Very Strong | Dominant downtrend in control |
| Bollinger 4H | Below Lower Band | Bearish | Oversold or breakdown in progress |
Nasdaq100 Key Levels at a Glance
How Different Traders Should Approach This Tape
The right move depends entirely on your timeframe. For the intraday scalper, the bearish trend is your friend: selling rallies into 29,224.56 with tight stops above 29,281.19, targeting the 29,087 to 28,949 support cluster, aligns with the dominant 1H momentum. The oversold 4H reading is your warning to take profits quickly rather than overstay a short.
The swing trader faces a tougher decision. Chasing a fresh short here, with 4H RSI at 29 and price below the lower Bollinger band, invites a vicious bounce. The cleaner swing setup is patience: either wait for a relief rally to fade near 29,362.06 to 29,717.35, or wait for a confirmed break and retest of 28,540.66 to ride the next leg down. For the longer-term investor, this is a moment to watch rather than act. The daily structure has not broken down decisively, and a CPI print plus the Fed narrative could redraw the entire map within a week. As one piece of market wisdom puts it, be bold when others are fearful, but only after the data resolves the uncertainty.
The S&P 500 rising while the Nasdaq100 falls nearly 4% is a textbook rotation tell. Watch whether that rotation deepens or reverses; it will likely lead the index's next directional move before the chart confirms it.
What I'm Watching This Week
Three triggers will decide which road wins. First, the 29,224.56 level: a clean reclaim flips the short-term bias and validates the bounce thesis, while repeated rejections cement the bears. Second, the upcoming high-impact USD data, especially the inflation readings, given that May CPI is expected to show renewed upward pressure; a hot number supercharges rate fears and the dollar. Third, the DXY itself at 99.78; if it pushes higher and holds above its daily resistance, equities stay under pressure, but an overbought 1H RSI of 74 means a dollar pullback could hand tech a relief window.
Frequently Asked Questions: Nasdaq100 Analysis
What happens if Nasdaq100 breaks below $29,087 support?
A sustained 1H close under 29,087.06 would confirm the bearish continuation, opening the path toward 28,949.56 and then the heavier 4H shelf at 28,540.66. With the 1H ADX at 53.33 signaling a very strong downtrend, this is currently the highest-probability outcome at around 60%.
Should I buy Nasdaq100 at current levels of $29,138 given the oversold 4H RSI?
The 4H RSI at 29.09 and Stochastic at 11.6 are oversold, which tempts bottom-fishers, but oversold readings can persist in a strong downtrend. A lower-risk approach is to wait for price to reclaim and hold 29,224.56 before considering longs, since buying without that confirmation fights the dominant trend.
Is the 1H ADX at 53.33 a meaningful signal for Nasdaq100 right now?
Yes, an ADX above 50 indicates a very strong trend, and combined with negative MACD it confirms sellers are firmly in control on the intraday chart. It does not predict direction by itself, but here it reinforces the existing downtrend, meaning rallies are more likely to be sold than to reverse the move.
How will this week's U.S. inflation data affect Nasdaq100?
With May CPI expected to show renewed upward pressure, a hotter-than-forecast print would amplify rate fears, likely lifting the DXY from 99.78 and pressuring high-multiple tech further toward the 28,540.66 support zone. A softer print, by contrast, could trigger the relief bounce toward 29,362.06 and beyond.
The chart is bruised, the trend is heavy, and the macro winds are blowing against tech. But every sharp shakeout plants the seeds of the next setup, and the levels are now clearly drawn. Stay patient, let 29,224.56 and 29,087.06 do the talking, and the market will reveal its hand before the week is out.
Track markets in real-time
AI-powered analysis, technical indicators and real-time price data.
Join Our Telegram Channel
Breaking market news, AI analysis and trading signals instantly.
Join Channel