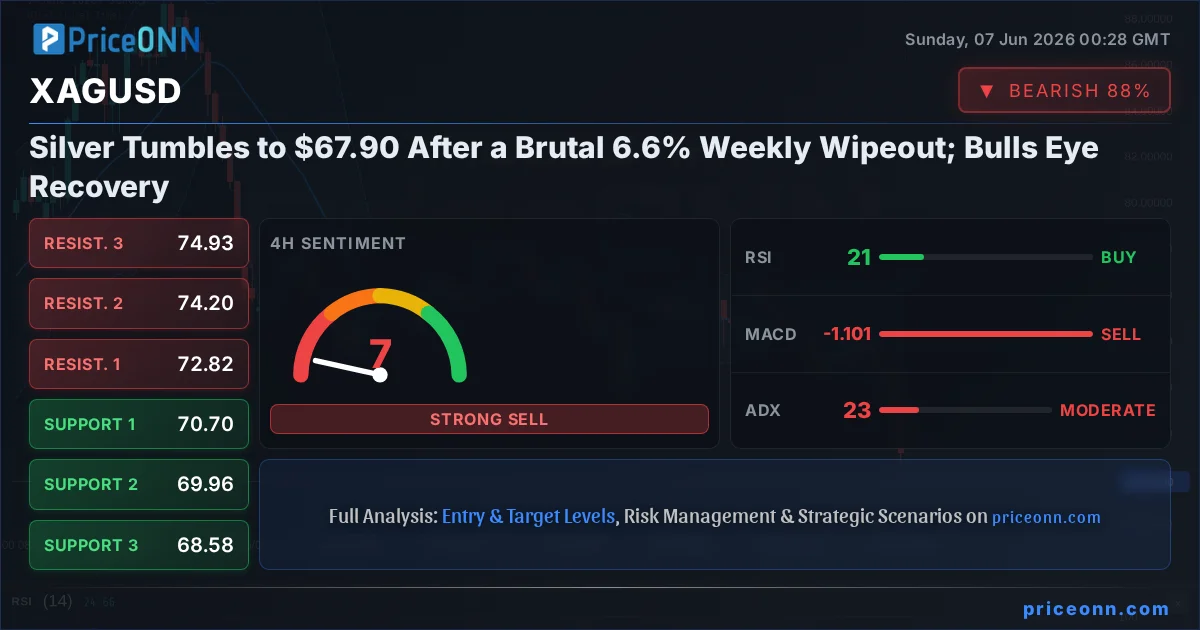
Four percent gone in a single session. That is what XAGUSD today analysis came down to as silver buckled into the Friday close, settling at $67.90 after sliding 6.58% on the day. For a metal that spent the spring as one of the market's darlings, the speed of this reversal caught a lot of people leaning the wrong way. The weekly tape tells an even harsher story: a 6.6% drop that ripped silver out of its comfortable trading shelf and dumped it well below the $71.75 zone everyone had been watching.
So what actually broke? In one word: the dollar. And underneath that, a payrolls report that handed the Federal Reserve every excuse it needed to stay patient. This was not a silver-specific story; it was a metals-wide repricing driven by macro forces, and that distinction matters enormously for what comes next.
- XAGUSD closed Friday at $67.90, down 6.58% on the day and roughly 6.6% on the week, slicing clean through the $71.75 level that had acted as a weekly pivot.
- The 1-hour RSI sits at a deeply oversold 18.91, with Stochastic at K=5.24 / D=8.29; the selloff is statistically stretched, but oversold is not the same as reversed.
- ADX on the 1-hour chart reads 53.14, a very strong-trend signal that confirms sellers, not buyers, still own the short-term momentum.
- The Dollar Index ripped to 99.80 (+0.56%) after a hot US payrolls print reinforced Fed patience, the single biggest driver behind silver's collapse.
Time Horizon: This is a weekend weekly review with markets closed. Prices referenced are Friday's closing levels, and the focus is on what last week's structural damage means for the days ahead.
How a 6.6% Weekly Wipeout Reshaped the XAGUSD Trend Analysis
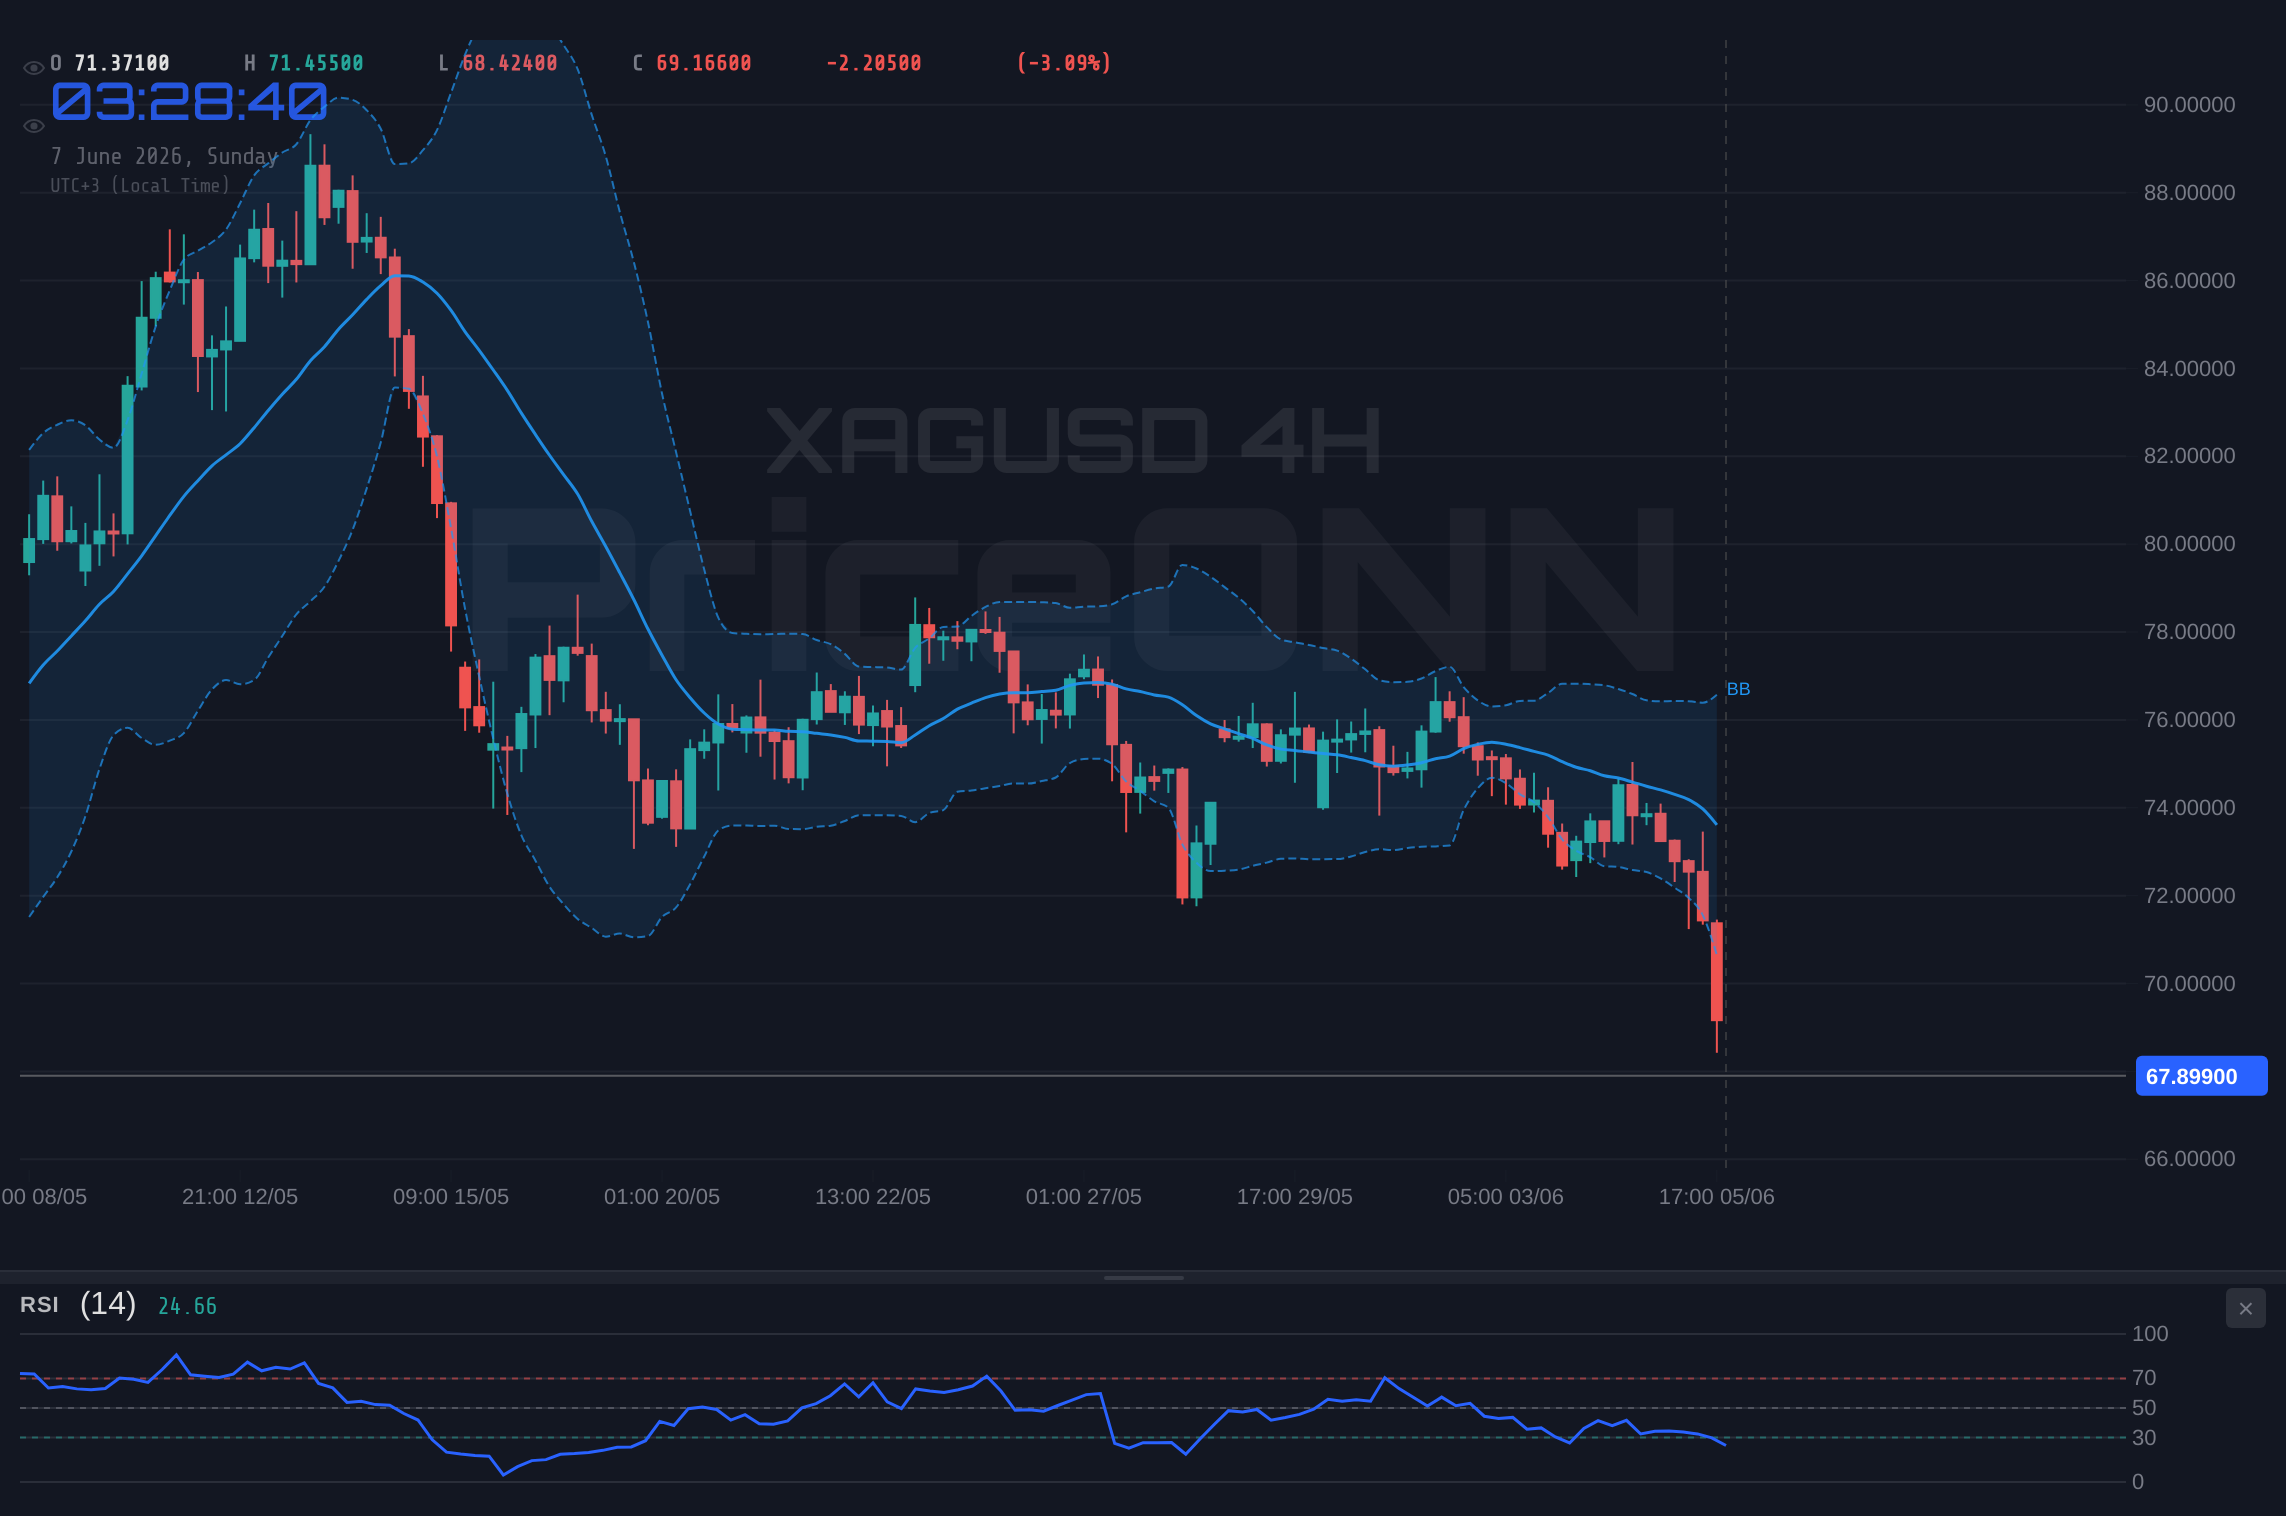
Let us start with the raw damage. Silver traded in a daily range of $72.43 to $75.04 before the floor gave way, and by the close it had collapsed to $67.90. That is not a routine pullback. A move of this magnitude in a precious metal usually signals one of two things: a violent unwind of crowded long positioning, or a fundamental re-rating of the macro backdrop. Last week delivered both at once.
For context, the gold-to-silver ratio now sits near 63.7, with gold (XAUUSD) itself closing at $4,328.24 after its own 2.39% Friday drop. When both metals fall hard together and the ratio holds relatively steady, it tells you the selling pressure is coming from a shared catalyst rather than something idiosyncratic to silver's industrial demand story. That shared catalyst was the dollar, and the chain reaction it set off across the entire commodity complex.
Multi-timeframe analysis paints a uniformly heavy picture. On the 1-hour chart the trend is rated as a 100% strength downtrend. The 4-hour echoes it at 89%, and even the daily timeframe carries a 93% downtrend reading. When all three horizons agree this strongly, you are not looking at noise. You are looking at a market that has decisively shifted its character, at least for now.
Why the Dollar Surge Did the Real Damage to Silver
Here is where the fundamental story takes over. According to Reuters reporting on the session, the dollar strengthened broadly after a much stronger-than-expected US employment report, with USD/JPY clearing the psychologically loaded 160 handle for the first time. That single data point reset the entire rate-expectations landscape.
Think about the mechanics. Silver pays no yield. It costs money to store. Its entire bull case rests on the idea that real interest rates are falling and the dollar is weakening, making a non-yielding hard asset more attractive by comparison. Flip that logic, and silver becomes the easiest thing in the world to sell. A robust payrolls print does exactly that: it tells traders the Fed has no urgency to cut, which props up real yields and, by extension, the dollar.
The Dollar Index closed at 99.80, up 0.56% on the day, and the internals are telling. The 1-hour DXY RSI is screaming overbought at 79.59, with Stochastic at K=94.03 / D=91.39 and a powerful ADX of 35.49 confirming the strength of the dollar's run. That is the mirror image of silver's oversold collapse. The two are locked in their classic inverse dance, and as long as the dollar holds these elevated levels, every silver rally will run into a headwind.
Oversold readings on silver are tempting, but the dollar is the puppet master here. With DXY RSI at 79.59 the greenback itself is stretched, which could eventually give metals room to breathe. Until the dollar actually rolls over, though, bottom-fishing in silver is fighting the dominant trend.
Bloomberg-tracked commentary framed the broader mood well: markets ended the week far more defensively than they began it, with the AI trade cracking, Fed risk rising, and geopolitical tension around Iran escalating. Normally that risk-off cocktail would send safe-haven bids into silver and gold. Instead, the dollar's gravitational pull overwhelmed the haven impulse, and metals were sold alongside risk assets. That decoupling from its usual safe-haven behavior is one of the most important tells from last week, because it shows just how dominant the rate story has become.
What the Oversold RSI Really Tells Us About XAGUSD's Next Move
Now this is where it gets interesting. The momentum picture is genuinely conflicted, and anyone selling you a one-line answer is oversimplifying. Let us walk through the layers.
On the 1-hour chart, RSI at 18.91 is deeply into oversold territory; readings this low usually mark zones where short-term sellers have overextended and a bounce becomes statistically likely. The Stochastic confirms the exhaustion, pinned at K=5.24 and D=8.29 right down at the basement. In isolation, that combination whispers "snap-back rally incoming."
But here is the catch, and it is a big one. The ADX on that same 1-hour chart sits at 53.14, a very strong-trend reading. Strong ADX during a downtrend is precisely the environment where oversold RSI signals fail repeatedly, because the trend has enough force to keep grinding lower even from depressed momentum levels. This is the classic trap: traders see RSI under 20, assume a bottom, and get run over because the trend strength simply does not care.
Step out to the 4-hour and the picture cools slightly. RSI there is 21.17, still oversold, but ADX drops to 22.96, a more moderate trend reading. The daily timeframe is the most balanced of all: RSI at 34.96 is approaching neutral with a downside lean, while ADX at 17.67 actually signals a weak, range-prone trend on the higher horizon. The MACD remains below its signal line on all three timeframes, so momentum has not turned, but the daily Bollinger reading shows price pushing below the lower band, which is itself an exhaustion signal.
The conflict is the message. Short-term momentum is stretched enough to spark a relief bounce, but the strong 1-hour ADX warns that any bounce should be treated as a counter-trend move until proven otherwise. Confirmation, not anticipation, is the name of the game here. A reclaim of $68.77 would be the first real evidence that buyers are stepping back in.
The Price Levels That Matter Most Right Now
For anyone studying XAGUSD support and resistance going into the new week, the structure has compressed dramatically after Friday's slide. With price sitting at $67.90, the nearest support is almost on top of the close at $67.84. That is razor thin. Below it, the next cushions sit at $67.44 and then $66.90. A daily close beneath $66.90 would open the door toward the deeper 4-hour shelf around $68.58 having already failed, meaning the market would be in genuine price-discovery territory with few recent reference points to lean on.
On the upside, the first hurdle is $68.77, followed by $69.31 and $69.71. These are the levels bulls must reclaim to even begin arguing that the worst is over. Notice how tight this entire band is: from the first support at $67.84 to the third resistance at $69.71, the whole structure spans less than three dollars. That compression is typical right after a capitulation-style move, and it usually resolves with a sharp directional break once the new week's liquidity arrives.
The $71.75 zone deserves a special mention. That level acted as the weekly pivot heading into the selloff, and the fact that silver crashed straight through it without pausing is significant. What was support is now overhead resistance, sitting well above current price on the 1-day timeframe alongside the $70.82 and $69.04 readings. For the broader trend to repair itself, silver eventually needs to climb back above that broken shelf, and that is a multi-day project at minimum, not a single-session bounce.
The Commodity Complex Bled Together, and That Is a Clue
Silver did not fall in a vacuum. The entire commodity board was a sea of red, and the correlations are worth unpacking because they reveal the macro engine behind the move. Crude oil was hammered: WTI dropped 6.37% to $91.60 and Brent shed 5.36% to $95.52. When energy and metals collapse together on the back of a strong dollar, it points to a broad commodity de-rating rather than supply-and-demand specifics in any single market.
This matters for silver's fundamental case in a subtle way. Falling oil prices ease near-term inflation expectations, which in turn reduces one of the structural arguments for holding precious metals as an inflation hedge. So the same dollar strength that directly pressured silver also indirectly weakened its inflation-protection narrative through the energy channel. Two headwinds from one catalyst.
Equities, meanwhile, told a split story. The S&P 500 actually closed up 0.74% at 6,572.87, but the Nasdaq 100 cratered 5.41% to 28,791.34 as the AI trade wobbled. That divergence underscores how concentrated the stress was in growth and momentum names. For silver, the relevant read is that risk appetite was uneven and defensive, yet the metal still could not attract a haven bid, which again confirms that the dollar and rate story trumped everything else last week.
Fundamental Drivers: Why the Fed Is Now the Only Story That Matters
If you want to understand where XAGUSD goes from here, stop staring at the silver chart for a moment and look at the US rate calendar. The payrolls report that triggered Friday's carnage did so precisely because it reshaped Fed expectations. As one widely circulated week-ahead note put it, the Fed countdown has begun amid critical US inflation data and rising geopolitical risk, with new Fed Chair Warsh's first meeting approaching.
The forecast on the table for upcoming high-impact US data includes a payrolls-related figure penciled in around 211 against a prior 215, and a headline reading expected near 0.3 versus a previous 0.2. Most critically, economists are flagging renewed upward pressure in US inflation, with May CPI expectations clustered around a 0.5% monthly rise. That is a hot number. If it prints anywhere near that, it would cement the case for Fed patience, reinforce dollar strength, and pile fresh pressure on every non-yielding asset, silver included.
The asymmetry into next week is stark. A hot CPI confirms the dollar's dominance and likely extends silver's pain. A surprise cool print, however, would be the most plausible trigger for a sharp silver short-covering rally, precisely because positioning is now so lopsided and momentum so oversold. The CPI release is the fulcrum the whole week pivots on.
There is a geopolitical wildcard too. Escalating tension around Iran kept oil's floor elevated earlier in the week and normally would have provided a safe-haven tailwind for silver. The fact that it did not is a measure of how thoroughly the dollar overwhelmed haven flows. Should that geopolitical situation deteriorate sharply, it could inject sudden two-way volatility into metals, so it belongs on every watchlist even if it took a back seat last week.
Reading the Setup: Three Ways Next Week Could Unfold
Markets are closed, so this is a map rather than a live call. Based purely on the technical structure and the macro calendar, here are the three paths that carry the most weight going into the new week. Note the probabilities reflect the dominant downtrend bias still in force.
Continuation: The Dollar Keeps Its Grip
55% ProbabilityRelief Rally: Oversold Springs Back
20% ProbabilityBase-Building: A Volatile Pause
25% ProbabilityThe weighting leans bearish for a reason. The 1-hour ADX at 53.14 is the tiebreaker; strong-trend environments favor continuation over reversal until proven otherwise. But the 20% bullish path is far from negligible precisely because the oversold extremes leave the market primed for a violent snap higher if the dollar so much as hesitates.
What Different Traders Should Be Watching
The right takeaway depends entirely on your time horizon, so let us break it down by trader type.
The Scalper
For intraday operators, the $67.84 support and $68.77 resistance are the two lines that define the playground. With 1-hour Stochastic pinned at K=5.24, fast counter-trend pops are possible but should be treated as quick, nimble trades against a dominant downtrend, not the start of a new leg up. Volume confirmation around the CPI release is essential; the first hour after the data will set the tone.
The Swing Trader
Swing participants should respect the 4-hour and daily structure. With the daily RSI at 34.96 and ADX at a weak 17.67, the higher timeframe is closer to a balanced state than the panicked 1-hour. That argues for patience: waiting for either a confirmed reclaim of the broken $69-area shelf or a clean breakdown below $66.90 before committing to a directional view. The broken $71.75 pivot is the longer-term repair target.
The Long-Term Investor
For position holders, a 6.6% weekly drop is uncomfortable but not, by itself, a thesis-breaker. The structural questions are whether real yields keep rising and whether the dollar's run has legs. With DXY RSI already overbought at 79.59, the greenback's surge is itself stretched, and history suggests these dollar spikes eventually mean-revert. Patient accumulators may find that the levels forming after a capitulation like this become attractive over a multi-month horizon, provided the macro tide turns.
| Indicator | Value | Signal | Interpretation |
|---|---|---|---|
| RSI (1H) | 18.91 | Oversold | Stretched to the downside; bounce risk rising but not confirmed |
| RSI (1D) | 34.96 | Neutral-Bearish | Higher timeframe closer to balance than the panicked 1H |
| MACD (all TFs) | Below signal | Bearish | Momentum has not turned up on any horizon |
| Stochastic (1H) | 5.24 / 8.29 | Oversold | Exhausted short-term, but trend can override |
| ADX (1H) | 53.14 | Strong Trend | Sellers firmly in control; favors continuation |
| ADX (1D) | 17.67 | Weak Trend | Higher-timeframe trend is range-prone |
The dashboard crystallizes the central tension of this market in one frame. Short-term oversold conditions are colliding with a strong short-term downtrend, while the daily picture is far more ambivalent. That is not a market that hands you an easy answer; it is a market that rewards confirmation and punishes anticipation.
The Week Ahead: Levels and Catalysts to Circle
Putting it all together, next week's silver story will be written by three things. First, the May CPI release, which is the macro hinge; a print near the 0.5% forecast feeds dollar strength, while a miss could ignite a relief rally. Second, the dollar itself, where DXY at 99.80 with an overbought RSI of 79.59 is the single most important external variable to monitor. Third, the geopolitical backdrop around Iran, which remains a latent volatility source even though it took a back seat last week.
On the chart, keep it simple. $67.84 and $66.90 are the lines that, if lost, confirm the bears remain in command. $68.77 and $69.31 are the levels bulls must reclaim to argue that Friday's flush marked a near-term capitulation low rather than a waypoint to lower prices. And $71.75 looms overhead as the broken pivot that defines when the larger uptrend can credibly be called repaired.
Frequently Asked Questions: XAGUSD Analysis
What happens if XAGUSD breaks below $66.90 support next week?
A daily close below $66.90 would push silver into price-discovery territory with few recent reference points, since the metal has already sliced through the $71.75 weekly pivot and the $68.58 4-hour shelf. With the 1-hour ADX at 53.14 confirming a strong downtrend, a break there would favor continuation rather than a quick rebound. Bears would have the clear upper hand until buyers reclaim $68.77.
Is the RSI at 18.91 a buy signal for XAGUSD right now?
Not on its own. While a 1-hour RSI of 18.91 is deeply oversold and often precedes a bounce, the simultaneous ADX reading of 53.14 signals a very strong downtrend, the exact condition where oversold signals frequently fail. A safer confirmation would be a sustained reclaim of the $68.77 resistance level before treating the oversold reading as actionable.
Why did silver crash 6.6% on the week even with geopolitical risk rising?
The dollar overwhelmed silver's usual safe-haven appeal. A stronger-than-expected US payrolls report reinforced Fed patience and drove the Dollar Index to 99.80, up 0.56%, and a rising dollar mechanically pressures non-yielding assets like silver. The escalating Iran tension would normally support metals, but the rate-driven dollar surge simply dominated the price action.
How will the upcoming US CPI data affect XAGUSD this week?
CPI is the pivotal catalyst. With May inflation expected to rise around 0.5% month over month, a hot print would cement Fed patience, lift the dollar further, and likely extend silver's decline toward the $67.44 and $66.90 supports. A cooler surprise, however, could trigger a sharp short-covering rally toward the $69.31 to $69.71 resistance zone given how oversold positioning has become.
The bottom line for silver is that volatility this severe always creates opportunity for those who stay disciplined. The metal is bruised, the dollar is in the driver's seat, and the CPI release will likely be the moment the next directional story is written. Wait for the levels to confirm, respect the dominant trend until it cracks, and remember that markets are cyclical: every brutal flush like this one plants the seeds for the next setup. The traders who keep their powder dry through the noise are usually the ones positioned when clarity finally arrives.
Track markets in real-time
AI-powered analysis, technical indicators and real-time price data.
Join Our Telegram Channel
Breaking market news, AI analysis and trading signals instantly.
Join Channel