Was the close above 160 a breakout, or a trap baited by Tokyo? That is the question hanging over USDJPY this weekend. The pair finished the week at 160.24, parked just on the wrong side of a level that Japan's Ministry of Finance has treated as a red line, the same level it reportedly spent ¥11.7 trillion defending. The dollar pushed through, payrolls did the heavy lifting, and now the market goes into a fresh week with one foot over the threshold and one eye on the door.
Time Horizon: This is a weekend weekly review of USDJPY covering last week's price action and the setup for the coming week. Markets are closed; all prices reference Friday's close.
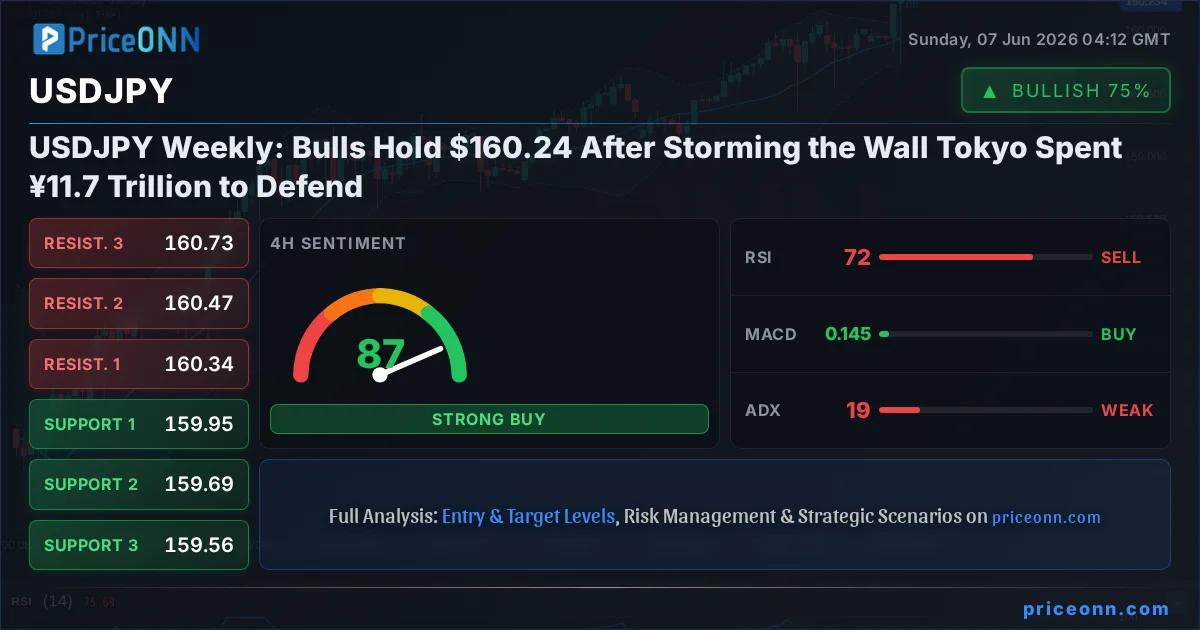
- USDJPY closed Friday at 160.24, finishing above the psychologically loaded 160 handle after a strong US payrolls report reinforced Fed patience.
- The daily chart shows an 87% bullish trend with daily resistance stacked at 160.29, 160.544 and 161.006, while first daily support sits at 159.574.
- Momentum is stretched: the 4H RSI sits at 72.38 (overbought) and daily Stochastic is pinned at K=96.2, a classic late-stage signal that the rally is running hot.
- The daily ADX at just 14.74 warns that trend conviction is weak, so the breakout above 160 has not fully committed yet, leaving intervention risk firmly in play.
USDJPY Today Analysis: Why the $160.24 Close Carries More Weight Than the Number Suggests
Let me start with the obvious. A close at 160.24 is barely two-tenths of a yen above the round number. On any other pair, on any other level, that is noise. Here, it is a statement. The 160 figure on USDJPY is not just a chart level; it is a line that Japanese authorities have publicly and privately treated as the pain threshold. When the pair printed near here earlier this cycle, the Ministry of Finance and the Bank of Japan reportedly mobilized roughly ¥11.7 trillion to push it back. So when price closes above it on a Friday, going into a weekend when liquidity is thin and policymakers have time to plan, the close means something.
The weekly USDJPY price action tells a coherent story. The pair ground higher through the week, with Friday's session adding 0.12% (a move of 0.199) and trading in a daily range of 159.546 to 160.071 before settling at 160.24. That is a controlled, grinding advance, not a panicked spike. Controlled advances are harder for authorities to fight, because there is no single disorderly move to point to as justification for intervention. The dollar did the work, and it did it quietly.
The Payrolls Catalyst: How Strong US Jobs Data Reinforced Fed Patience
The fundamental engine behind this move is straightforward. According to a Reuters-flagged market summary from June 5, the dollar strengthened broadly in the early US session after a much stronger-than-expected employment report reinforced confidence that the Federal Reserve can afford to stay patient. The headline of that report said it plainly: USD/JPY cleared 160. When the labor market refuses to crack, the case for near-term rate cuts weakens, and a higher-for-longer US rate path is rocket fuel for a pair built on interest rate differentials.
This is where USDJPY differs from almost every other major. The pair is, at its core, a carry trade vehicle. Traders borrow in low-yielding yen and park the proceeds in higher-yielding dollar assets. Every data point that keeps US yields elevated widens that gap and rewards the long-dollar carry. The payrolls beat did exactly that. The economic calendar context reinforces it too: the upcoming US Non-Farm Payrolls print carries a forecast of 211K against a previous 215K, with the unemployment rate seen holding at 4.3%. A labor market hovering in that zone gives the Fed no urgency to ease.
There is an inflation wrinkle that makes the coming week genuinely interesting. A widely circulated Economics Week Ahead note flagged that US inflation is showing renewed upward pressure, with expectations for May CPI to rise 0.5% month over month. If that lands hot, it slams the door on imminent cuts and could send the dollar, and USDJPY, even higher. That is the bullish accelerant. It is also precisely the scenario that would force Tokyo's hand.
PriceONN's own coverage this past week was blunt about it: "Yen Braces for a New Storm," and "Japan Spent ¥11.7 Trillion Defending USD/JPY 160. Traders May Test It Again This Week." With price now closing above 160.24, the market is openly probing whether authorities will defend the line again. Any sudden, sharp yen rally early next week should be read first as a possible intervention event, not a clean technical reversal.
Reading the Multi-Timeframe Picture: What USDJPY Trend Analysis Shows Across 1H, 4H and Daily
Here is where the multi-timeframe analysis gets nuanced, because the three horizons do not all sing in harmony. The daily chart is the cleanest bull. It carries an 87% strength uptrend, MACD sits in positive territory above its signal line, and the overall daily signal reads BUY with six buy votes against just one sell. Price is holding above the mid Bollinger band, which is the textbook posture of a healthy advance. So far, so bullish.
Drop to the 1-hour chart and the bullish bias is even more aggressive in the short term: an 87% strength uptrend, a clean BUY signal with seven buy votes to one sell, MACD positive, and price above the mid band. The RSI here at 60.83 still has room to run before it screams exhaustion, sitting in neutral-to-bullish territory rather than at a blow-off extreme.
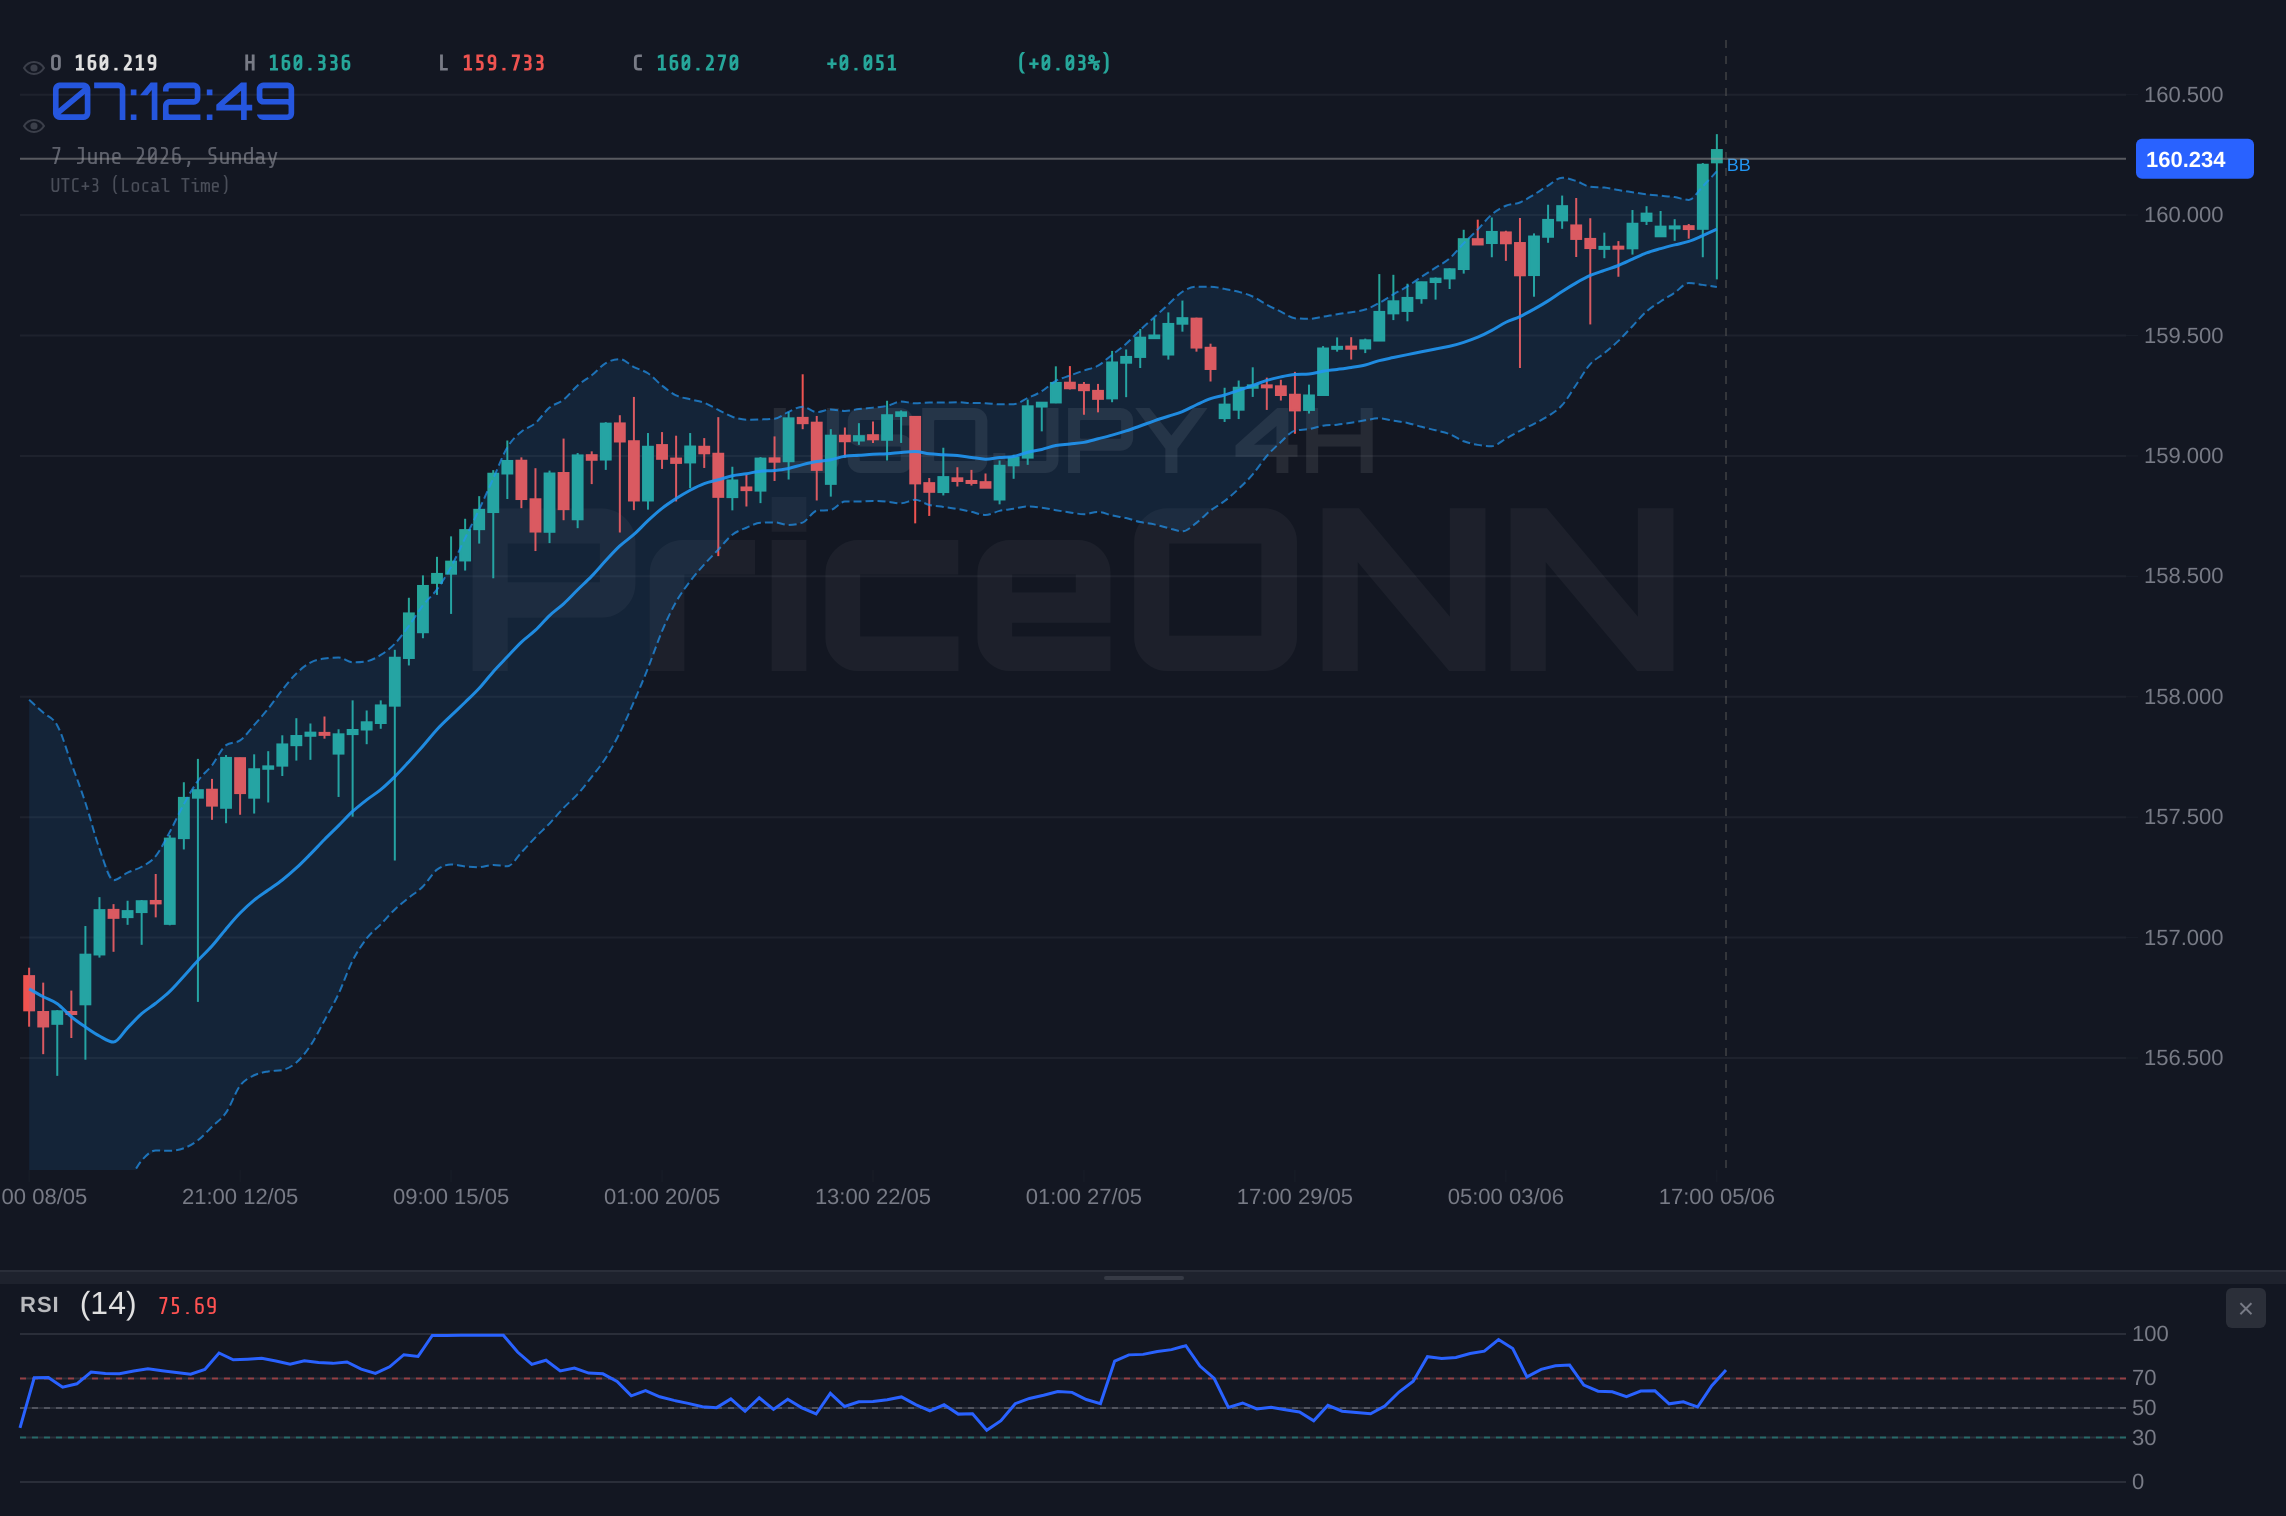
The 4-hour chart is the contrarian voice in the room, and it is the one worth respecting. Its trend reads neutral at 50% strength, even though the underlying signal still tilts BUY (six buy, two sell). The tension comes from momentum. The 4H RSI is parked at 72.38, firmly in overbought territory, and price has pushed above the upper Bollinger band. When price rides outside the upper band with RSI above 70, it is not a sell signal on its own, but it is a flashing yellow light. It tells you the move is extended and that a pullback or a sideways pause to relieve pressure has become more likely than another immediate vertical leg.
Why the ADX Reading Is the Quiet Star of This USDJPY Volatility Analysis
If you take one number away from this technical review, make it the ADX. On the daily, ADX sits at just 14.74. On the 4-hour, it is 18.77. Both readings are below the 25 threshold that conventionally marks a strong, committed trend. In plain language: the rally above 160 has momentum, but it does not yet have conviction in its legs. A weak ADX during a breakout is the market's way of saying the move is not fully validated. It can still resolve higher, but it is exactly the kind of soft-trend backdrop where a single catalyst, like a hot CPI to the upside or an intervention headline to the downside, can swing price hard and fast.
The 1-hour ADX at 24.71 is the strongest of the three and sits right on the edge of trend-strength territory, which fits the picture of a short-term push that is energetic but has not translated into durable daily-chart conviction. This is the core conflict of the current setup: directional signals are bullish, but trend-strength signals say "not so fast."
When directional indicators (trend, MACD) say up but ADX says weak and RSI says overbought, the highest-probability near-term path is often not a reversal and not a fresh breakout, but a consolidation or shallow pullback that resets momentum before the next decision. That is the messy, range-bound squeeze that frustrates both bulls and bears.
USDJPY Support and Resistance: The Key Levels That Will Define Next Week
Let's map the battlefield using only the levels the data actually gives us. The structure above is dense, which is itself telling: a tight cluster of resistance just overhead means there is real supply waiting.
On the upside, the daily chart stacks resistance at 160.29, then 160.544, then 161.006. Notice how close that first level is to Friday's 160.24 close. Price is essentially leaning against the door. The 4H chart adds resistance at 160.342, 160.474 and 160.733, which overlaps neatly with the daily cluster and creates a confluence zone roughly between 160.29 and 160.73. That confluence is the wall bulls must clear and hold to confirm the breakout is real rather than a liquidity grab above a round number.
On the downside, the first line of defense is tight. The 1H chart shows support at 160.046, then 159.936 and 159.791. The 4H chart anchors support at 159.951, 159.692 and 159.56. Step back to the daily and the deeper, more meaningful support sits at 159.574, then 159.112, then 158.858. That 159.55 to 159.57 zone is the key short-term floor; it is where the 4H and daily supports converge. A clean break and close below it would put the entire "above 160" thesis in doubt and likely signal that either profit-taking or official intervention has taken control.
The Dollar Index Connection: How DXY Strength Is Powering USDJPY
You cannot analyze USDJPY in isolation right now, because the dollar is the protagonist. The Dollar Index closed Friday at 99.80, up 0.56% on the day, with a daily range of 98.90 to 99.27 that it has already pushed beyond. On the 1-hour chart, DXY trend strength reads a maximal 100% and the signal is a clean BUY. The catch, and there is always a catch, is that DXY is itself overheated: its 1H RSI is at 79.59 and 4H RSI at 72.50, both deep in overbought territory, with Stochastic readings pinned near the ceiling.
This matters enormously for USDJPY. As long as the broad dollar stays bid, USDJPY has a tailwind that is hard to fight. But because DXY is itself stretched, the dollar's fuel tank may be running low in the very short term. If DXY rolls over from these overbought extremes, even modestly, it removes the primary support beam under USDJPY and makes the 159.57 support zone far more vulnerable. So the question for next week is not only "will Japan intervene," but also "can the dollar keep this pace without a breather."
The broader risk backdrop adds another layer. A widely shared market wrap on June 6 described the week ending in a defensive mood, citing a cracking AI trade, rising Fed risks, and escalating Iran conflict as a "triple threat." That note is consistent with the price tape elsewhere: the Nasdaq 100 closed down a brutal 5.41% on the session at 28,791.34, while gold (XAUUSD) fell 2.39% to 4,328.24 and silver plunged 6.58%. Here is the nuance for the yen. In a true risk-off panic, the yen often catches a safe-haven bid that works against USDJPY longs. Yet on Friday, the dollar's strength and the carry dynamic overwhelmed that haven flow, and USDJPY still closed higher. That decoupling, yen weakness despite equity stress, is itself a sign of how powerful the rate-differential story currently is.
The Carry Trade Backdrop and the Bank of Japan's Dilemma
Step back and the structural picture clarifies why 160 is such a flashpoint. The Bank of Japan remains the most dovish major central bank relative to the Fed, and that gap is the entire trade. The economic calendar lists a JPY high-impact reading with a forecast and previous of 0.5, a reminder that Japan's policy normalization remains glacial compared with a Fed that strong payrolls have made comfortable holding rates steady. As long as that differential persists, the structural pressure on the yen is to weaken.
That puts Japanese authorities in a genuine bind. Intervention can buy time and inflict pain on speculators, as the ¥11.7 trillion campaign demonstrated, but it cannot reverse the underlying rate gap. Historically, when the fundamental driver of a currency move stays intact, intervention slows the trend rather than reversing it. Traders know this, which is why PriceONN's reporting framed the situation as one where "traders may test it again this week." The market is effectively daring the Ministry of Finance to spend more reserves against a tide it cannot, by itself, turn.
For context, the most aggressive way authorities can change the calculus is not intervention at all but a genuine policy surprise: a hawkish shift from the Bank of Japan or clear signaling of faster tightening. Absent that, every dollar-positive data point next week, especially a hot CPI, pulls USDJPY back toward and above the intervention zone, and every official yen-buying operation becomes a fresh entry opportunity for carry traders once the dust settles. That is the uncomfortable loop the pair is trapped in.
What Different Traders Should Watch Into the New Week
The setup reads differently depending on your time horizon, so let's break it down honestly.
For short-term and intraday traders, the story is the 160.29 to 160.73 confluence overhead and the 159.79 to 159.95 cluster below. With 1H and 4H Stochastics deeply overbought (4H K=85.91, daily K=96.2), chasing strength here is dangerous; the better discipline is to watch how price reacts at the resistance wall and at the first supports, and to treat any violent yen spike as a potential intervention event rather than a tradable trend reversal.
For swing traders, the daily structure remains constructive above 159.57, but the weak daily ADX of 14.74 argues against assuming a clean trending leg. This is an environment that rewards patience over conviction. The thesis stays intact while price holds the 159.57 daily support; it comes into question on a daily close below it.
For longer-term, macro-oriented participants, the carry differential is the anchor. Until the Bank of Japan meaningfully closes the rate gap or the Fed pivots dovish, the structural bias leans toward yen weakness, with intervention acting as a speed bump rather than a road block. The events that could genuinely change that thesis are a surprise BoJ hawkish turn or a sharp downside miss in US data that revives Fed cut expectations.
USDJPY is caught between two opposing forces of nearly equal weight: a rate differential that wants to push it higher, and an intervention threat plus overbought momentum that wants to cap it. That equilibrium is exactly why a tight, range-bound squeeze around 160 is the most likely near-term outcome until a catalyst, CPI or intervention, breaks the deadlock.
Three Scenarios for USDJPY in the Week Ahead
Given the conflict between bullish direction and weak trend conviction, here is how the probabilities stack up. These are analytical scenarios mapped to the data, not trade instructions.
Bullish: The Wall Falls and 161 Comes Into View
45% ProbabilityNeutral: The 160 Squeeze Drags On
35% ProbabilityBearish: Tokyo Draws the Line Again
20% ProbabilityThe Economic Calendar That Will Decide the Tape
Next week is event-heavy, and the catalysts line up almost perfectly with the technical inflection. The headline US inflation reading is the one to circle. With May CPI expectations leaning toward a firm 0.5% monthly rise, a hot print would validate Fed patience, lift the dollar, and pull USDJPY back into and likely through the intervention zone. A soft print would do the opposite, reviving cut expectations and giving the yen room to recover toward the 159.11 to 158.86 deeper supports.
The labor market remains the secondary swing factor, with the next payrolls reading forecast at 211K versus a 215K previous and unemployment seen at 4.3%. A beat reinforces the carry bid; a clear miss is the type of surprise that revives dovish Fed pricing. There is also a notable political and policy overlay: market previews flagged that Fed Chair Warsh's first meeting is approaching, and a first meeting under new leadership injects an extra layer of uncertainty into rate expectations. On the Japanese side, watch any commentary from the Ministry of Finance or BoJ officials; verbal warnings often precede actual yen-buying operations and can themselves move the pair sharply.
Indicator Dashboard: USDJPY RSI, MACD and Trend Signals at a Glance
| Indicator | Value | Signal | Interpretation |
|---|---|---|---|
| RSI (14), Daily | 63.93 | Bullish lean | Healthy momentum, room before exhaustion |
| RSI (14), 4H | 72.38 | Overbought | Stretched; pullback or pause risk rising |
| MACD, Daily | Positive | Bullish | Above signal line, momentum intact |
| Stochastic, Daily | K 96.2 / D 83.39 | Overbought | Late-stage reading, profit-taking risk |
| ADX, Daily | 14.74 | Weak trend | Breakout lacks conviction, choppy bias |
| ADX, 4H | 18.77 | Weak trend | Range-prone, catalyst-dependent |
| Overall Daily Signal | 6 Buy / 1 Sell | Buy | Directional bias up, but stretched |
The dashboard captures the whole dilemma in one frame. Direction says up, momentum says overbought, and trend strength says weak. When those three disagree, the responsible read is not to force a high-conviction call but to define the levels that resolve the conflict: 160.73 to the upside, 159.57 to the downside. Whichever breaks first, on a daily closing basis, tells you which force won.
Frequently Asked Questions: USDJPY Analysis
What happens if USDJPY breaks above the 160.73 resistance zone?
A daily close above the 160.29 to 160.73 confluence would confirm the breakout above the 160 line is real rather than a liquidity grab. The next upside objectives become 160.544 and then 161.006, the daily R3. The main risk to that path is a Japanese intervention response, since 160 is the level Tokyo spent roughly ¥11.7 trillion defending.
Is the 4H RSI at 72.38 a sell signal for USDJPY right now?
Not on its own. An RSI of 72.38 confirms USDJPY is overbought on the 4-hour chart, which raises the odds of a pause or shallow pullback, but overbought conditions can persist for a long time in a trending market. It becomes meaningful only if price also breaks the 159.57 daily support, which would turn the overbought warning into actual downside follow-through.
Why does the daily ADX at 14.74 matter for USDJPY this week?
An ADX of 14.74 is well below the 25 strong-trend threshold, signaling that the move above 160 lacks firm conviction. In practice that means the breakout is fragile and catalyst-dependent, so a single event like a hot CPI or an intervention headline can swing price hard in either direction. It is the strongest argument for expecting a choppy, range-bound week rather than a clean trend.
How will the May US CPI release affect USDJPY in the coming week?
With May CPI expected to rise around 0.5% month over month, a hot print would reinforce Fed patience, strengthen the dollar (already firm with DXY at 99.80), and likely push USDJPY back above the 160.29 resistance and deeper into the intervention zone. A soft print would revive rate-cut expectations and open the door toward the 159.11 and 158.86 daily supports as the yen recovers.
Track markets in real-time
AI-powered analysis, technical indicators and real-time price data.
Join Our Telegram Channel
Breaking market news, AI analysis and trading signals instantly.
Join Channel