The week did not end the way gold bulls wanted. When the US payrolls report hit the wires on Friday afternoon, the dollar caught a bid, Treasury yields firmed, and the precious metal that had spent days coiling for a rebound instead gave up 2.39% in a single session. By the closing bell, XAUUSD sat at $4,328.24, a long way from the $4,889 highs traders were celebrating only weeks ago. This XAUUSD weekly outlook unpacks what broke, what held, and what the calendar is loading for the days ahead.
Time Horizon: This is a weekend weekly review. Levels and signals reference last Friday's close while markets are closed; treat them as a map for the week ahead, not a live trade ticket.
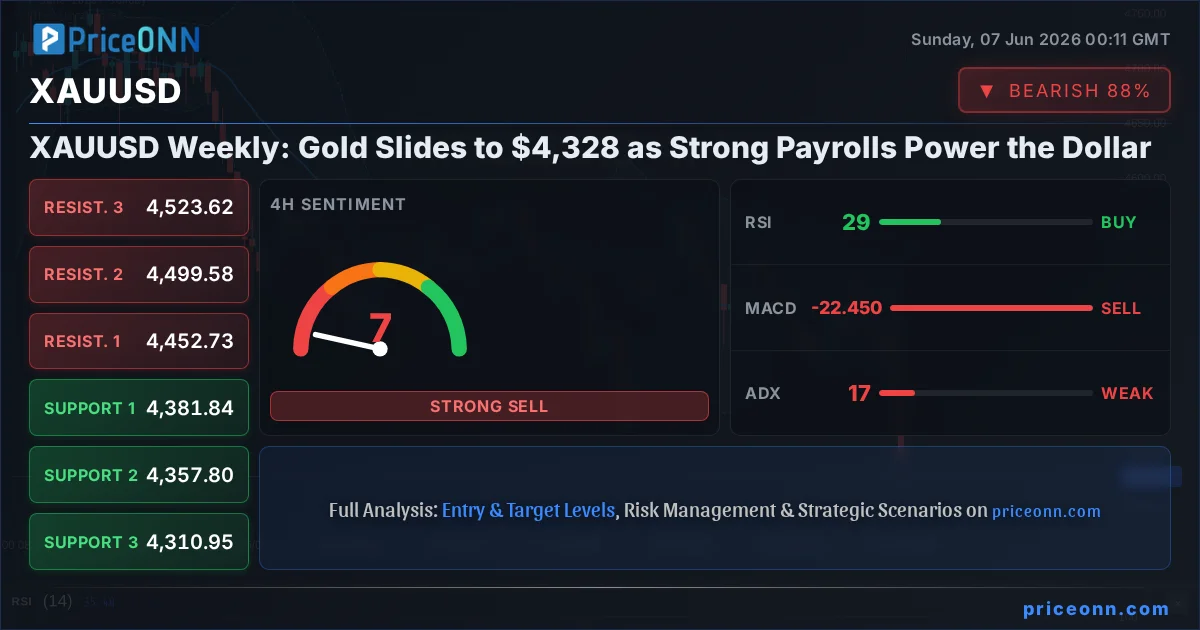
- Gold ended the week at $4,328.24, down 2.39% (-105.99) on Friday alone, as a stronger-than-expected US jobs report reinforced Fed patience.
- The dollar index (DXY) climbed 0.56% to 99.8 with a 1-hour RSI at 79.59, deep in overbought territory; that surge was the single biggest weight on gold.
- On the 1-hour chart, XAUUSD support sits at 4,310.85, 4,299.57 and 4,284.01, while resistance lines up at 4,337.69, 4,353.25 and 4,364.53.
- RSI is washed out (24.3 on 1H, 29.13 on 4H) and the daily ADX at 26.65 confirms a strong downtrend, but the 4H ADX of 17.03 warns the very near term is choppy, not cleanly trending.
Why a Single Jobs Report Reset the Gold Tape
Start with the catalyst, because the chart only makes sense once you understand what moved it. Friday's nonfarm payrolls came in hot, and the market read it exactly the way you would expect: a labor market that refuses to crack gives a patient central bank every reason to stay patient. As Reuters framed it, the dollar strengthened broadly in early US trade after a much stronger-than-expected employment report reinforced confidence that the Fed is in no rush to cut. RTTNews put the gold reaction bluntly, noting that prices plummeted Friday as economists digested the robust payrolls data.
Here is the mechanism, in plain terms. Gold pays no yield. When the data argues for higher-for-longer policy, the opportunity cost of holding a non-yielding asset rises, real yields firm, and the dollar that gold is priced in gets stronger. All three of those moved against bullion at once on Friday. That is why a metal that had been quietly basing suddenly lost more than a hundred dollars. It was not a technical accident; it was a fundamental repricing of rate expectations triggered by one number.
And the timing matters. PriceONN's own coverage going into the print, titled "NFP Is a Gatekeeper for Fed Policy and Gold's Next Move," captured the setup perfectly: traders had spent the week waiting, gold had been drifting lower from 4,889.24, and the report was always going to be the gatekeeper. The gate swung shut on the bulls.
This is a weekend review. Spot gold does not trade actively over the weekend, so $4,328.24 is the last Friday close, not a live tick. Monday's open can gap if weekend headlines (especially around the Middle East) shift the risk picture.
The Dollar Did the Damage: Reading the DXY and XAUUSD Correlation
If you want to understand gold this week, you have to watch the dollar, because the inverse relationship was textbook. The dollar index finished at 99.8, up 0.56% on the day, and the intraday momentum behind that move was extreme. On the 1-hour timeframe DXY printed an RSI of 79.59 with Stochastic at 94.03/91.39, both screaming overbought, and an ADX of 35.49 confirming a genuinely strong uptrend rather than noise. On the daily, the dollar's signal board read a clean 8 buys, 0 sells.
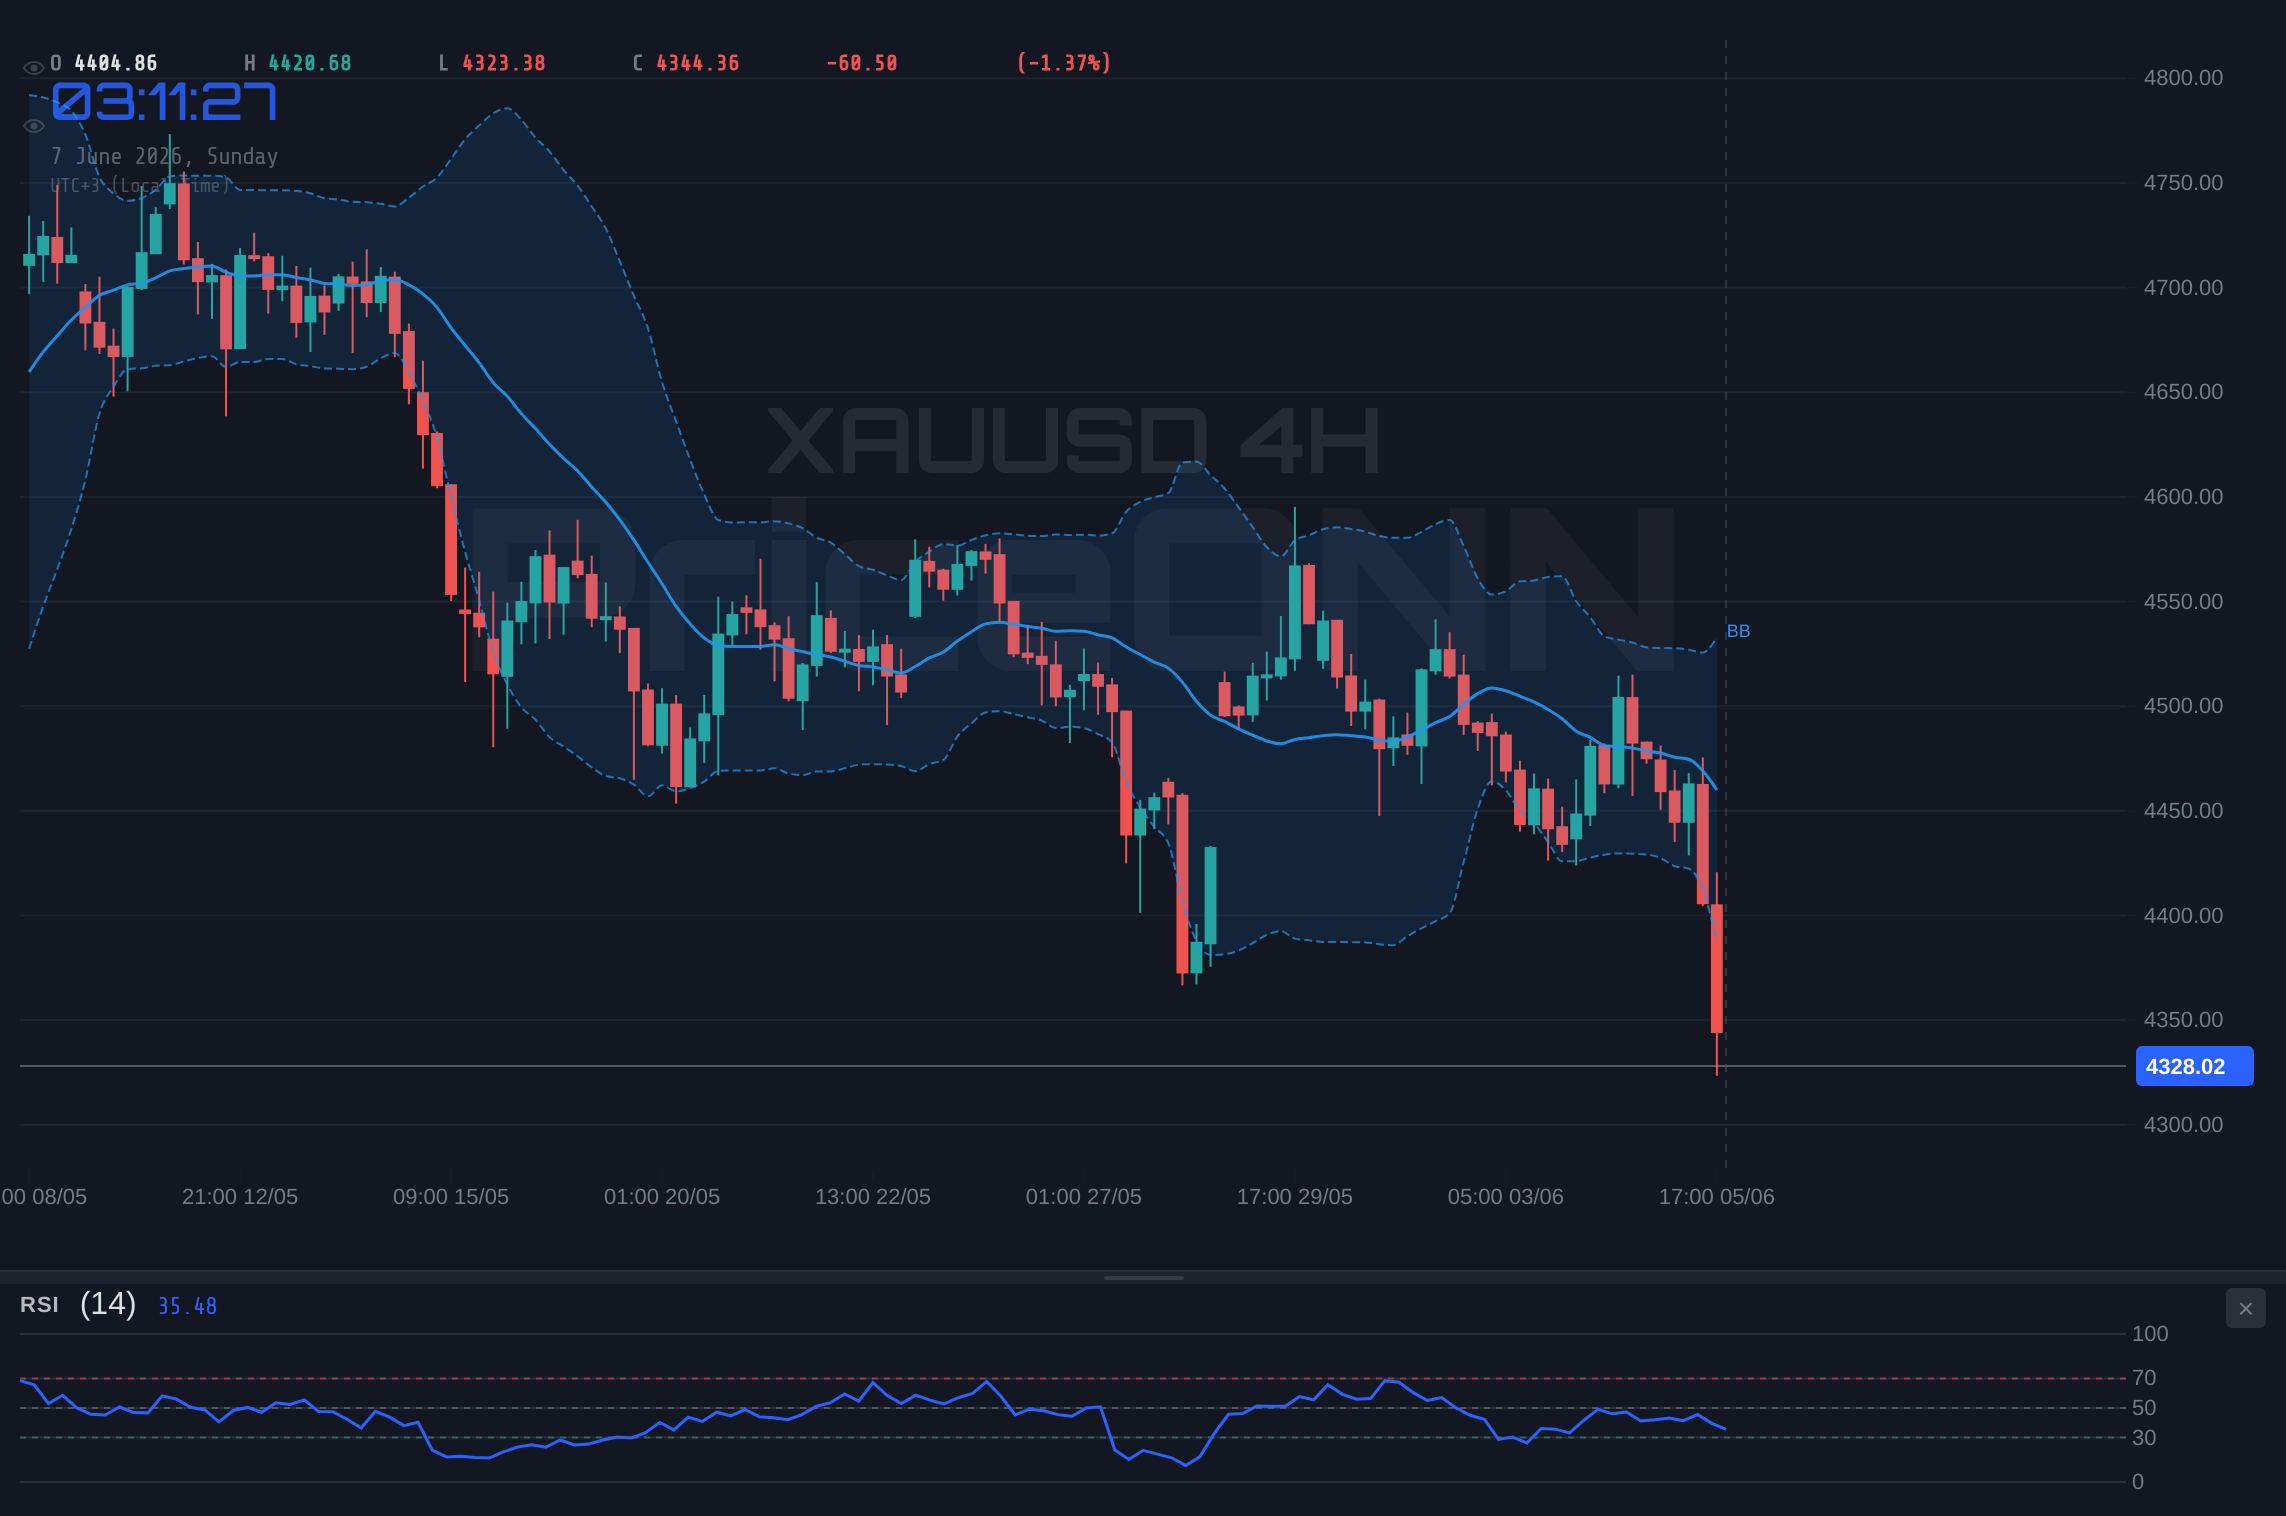
That is the crux of the gold story. With DXY at 99.8 and pressing the upper Bollinger band on the 4-hour chart, XAUUSD had no room to breathe. Every dollar of dollar strength is a headwind for an asset quoted against it. The good news for gold bulls, if there is any, is that a 1-hour RSI near 80 on the dollar is the kind of reading that tends to cool off. An overheated dollar can mean-revert, and when it does, gold often gets its first chance to stop the bleeding. That is a tension worth holding in mind as the new week opens.
The cross-asset picture added to the pressure. The broader risk tape was anything but calm. Nasdaq 100 cratered 5.41% on the day to 28,791.34, and the narrative around it, per weekend commentary, was a market facing a triple threat: the AI trade cracking, Fed risks rising, and the Iran conflict escalating. Normally a hard equity selloff sends a safe-haven bid into gold. This time it did not, at least not enough to offset the dollar. When gold cannot rally on a 5% Nasdaq drop, that tells you the dollar and rate story was firmly in the driver's seat.
Silver Took It Worse: What the Metals Complex Is Saying
Gold did not fall alone, and the company it kept is instructive. Silver was hammered, down 6.58% on the day to $67.90, with a 1-hour RSI of 18.91 and an ADX of 53.14 marking a very strong downtrend. When silver, the higher-beta cousin, falls almost three times as hard as gold, it tells you this was a broad metals de-risking, not a gold-specific story. Silver tends to amplify both legs of a precious-metals move, so its 6.58% drop is the market's way of shouting that risk appetite for the whole complex evaporated the moment the payrolls number printed.
For gold specifically, that broad weakness is a double-edged sword. On one hand, it confirms the selling was systematic and conviction-driven. On the other, silver's 1-hour RSI under 19 is the kind of capitulation reading that often marks short-term exhaustion. If the metals complex is going to bounce, silver's washout is usually the canary that flags it first. Multi-timeframe analysis across the two metals is worth keeping on your radar this week.
XAUUSD Support and Resistance: The Levels That Defined the Week
Now to the chart itself, because the technical structure is where last week's damage and next week's battle lines live. The most reliable map right now is the 1-hour timeframe, where the levels bracket Friday's close cleanly. Immediate support sits at 4,310.85, then 4,299.57, with a deeper line at 4,284.01. On the upside, the first ceiling is 4,337.69, followed by 4,353.25 and 4,364.53. Price closed at 4,328.24, wedged between that 4,310.85 floor and the 4,337.69 cap, which is exactly the kind of tight coil that resolves with energy once a new session brings liquidity.
Step out to the higher timeframes and the picture is heavier. On the daily chart, the trend reads down with 93% strength and a clean 8-sell signal board, with the daily ADX at 26.65 confirming a strong, committed downtrend. The daily structure shows former support clusters now sitting overhead at 4,338.05, 4,382.16 and 4,408.20, which means those old floors have flipped into resistance. That is the textbook signature of a market that has broken down: the levels that used to catch the price are now the levels that cap it.
What the RSI, MACD and ADX Readings Tell Us About XAUUSD Trend Analysis
This is where the chart gets genuinely interesting, because the indicators are telling two stories at once and you have to respect both. The momentum picture is deeply oversold. The 1-hour RSI sits at 24.3, the 4-hour at 29.13, and Stochastic on the 1H is buried at 8.43/8.72. Readings this stretched mean the sellers have already done a lot of work; the easy part of the move down may be behind us. That is the bull's argument for a bounce.
But oversold is not the same as reversing, and this is exactly where traders get trapped. MACD across every timeframe remains in negative territory, sitting below its signal line, which means momentum is still pointed down even if it is stretched. The daily ADX at 26.65 confirms the larger downtrend has real strength behind it. So you have a market that is oversold within a strong downtrend, which is the classic recipe for a relief bounce that fails rather than a clean V-shaped reversal. An RSI at 24 in a strong downtrend is a warning to short-sellers to manage risk, not an automatic green light to buy.
The single most important nuance is the 4-hour ADX at 17.03. A reading that low signals a weak, non-committal trend on that specific timeframe, which means the very near term is choppy rather than cleanly directional. That is the conflict at the heart of this tape: the daily says strong downtrend, the 4-hour says range-bound chop, and the oscillators say oversold. When those three disagree, the honest answer is that the market needs a catalyst to pick a side, and the calendar is about to hand it one.
When daily ADX confirms a downtrend but 4H ADX collapses to 17 and RSI is oversold, the highest-probability outcome is a sharp relief bounce inside a larger downtrend. The bounce gets sold until a daily close back above the broken 4,338 to 4,382 shelf proves otherwise. Confluence, not a single indicator, is what resolves this.
The Calendar Is the Catalyst: US Inflation and the Fed Countdown
Here is what makes the week ahead so loaded. The macro thesis that just crushed gold gets its next test from the inflation data. Weekend economic commentary flagged that US inflation is showing renewed upward pressure, with expectations for May CPI to rise around 0.5% on the month. That is a meaningful number for gold. A hot CPI on top of a hot payrolls print would double down on the higher-for-longer narrative, keep the dollar firm, and likely cap any gold rebound before it starts.
The flip side is just as important. If CPI comes in soft and undershoots that 0.5% expectation, the rate-cut conversation reopens, the overbought dollar finally gets a reason to mean-revert from 99.8, and gold's oversold readings suddenly have fuel for a real bounce. The economic calendar also carries high-impact USD employment-related figures with forecasts around 211 and an unemployment rate held at 4.3%, alongside a Japanese reading near 0.5%. Each of those is a potential volatility trigger, and with the dollar this stretched, the market is primed to move on a surprise in either direction.
Layered on top is the policy backdrop. Weekend previews pointed to the Fed countdown beginning, with Fed Chair Warsh's first meeting approaching and inflation data positioned to reshape expectations. A new chair's first meeting is exactly the kind of event that injects uncertainty into rate pricing, and uncertainty around the Fed is historically a friend to gold. Until that CPI print resolves the inflation question, caution is warranted on both sides of this market.
Geopolitics: The Wildcard Under Gold's Floor
There is one more force that could override every technical level on the board, and it is the one that does not show up on an indicator dashboard. Weekend reporting highlighted an escalating Iran conflict as part of the defensive mood that gripped markets heading into the close. Gold is the original safe-haven asset, and an escalation in the Middle East over a weekend is precisely the kind of headline that can produce a gap-up open on Monday regardless of where the RSI sits.
This is the asymmetry traders need to respect right now. The technical picture leans bearish, the macro leans bearish through the dollar, but the geopolitical tail risk leans bullish for gold. PriceONN's weekly news flow noted that gold had earlier advanced as expectations of an end to the Middle East crisis increased, which cuts both ways: if those de-escalation hopes fade, the safe-haven bid that left the market can return just as quickly. A market that ignored a 5% Nasdaq drop could still snap higher on a genuine conflict escalation, because the nature of the catalyst would be different.
The structural backdrop is mixed: central banks bought less gold in 2025 than the prior year, yet still pushed holdings to a 45-year high, per weekend coverage. That tells you the long-term official-sector demand story remains intact even as the short-term tape sells off. Strategic buyers and tactical sellers are pulling in opposite directions, which is why this correction can be sharp without breaking the multi-year structure.
Three Scenarios for XAUUSD in the Week Ahead
Pulling the macro, technical, and geopolitical threads together, here is how the week could realistically unfold. These are analytical scenarios built only from the levels in the data, with probabilities that reflect the current balance of evidence. They are a framework for what to watch, not a trade instruction.
Bears Stay in Control: Hot CPI Extends the Slide
60% ProbabilityRange and Repair: The Choppy 4H ADX Wins
25% ProbabilityOversold Snapback: Soft Data or Safe-Haven Bid
15% ProbabilityWhat Different Traders Should Be Watching
The right takeaway depends on your timeframe, and this market rewards knowing which one you are in. For the short-term and intraday crowd, the 4-hour ADX at 17.03 is the whole story: chop, not trend, which means fading the extremes of the 4,310 to 4,364 band is more rational than chasing breakouts until volatility expands around the data. The oversold 1H RSI of 24.3 makes shorting into support a poor risk-reward; let the level come to you.
For the swing trader, the daily downtrend with 93% strength and an ADX of 26.65 is the dominant signal, and the bias stays lower while price trades below the flipped 4,338 to 4,408 resistance shelf. The key event risk is CPI; a swing position carried into that print without a plan is a gamble, not a strategy. The forward-looking question is simple: does the dollar's overbought 99.8 reading roll over, or does inflation data give it a second wind?
For the long-term investor, the price action and chart pattern recognition matter less than the structural story. Central banks pushing holdings to a 45-year high even while trimming the pace of purchases tells you the multi-year demand thesis has not broken; a 2.39% Friday is noise against that backdrop. Volatility like this is where patient accumulators historically find better entries than the chasers who bought the 4,889 highs.
Frequently Asked Questions: XAUUSD Analysis
What happens if XAUUSD breaks below the $4,310.85 support?
A clean break and hold below 4,310.85 opens the door to the next 1-hour support at 4,299.57, and below that 4,284.01. Given the daily downtrend strength of 93% and negative MACD across timeframes, a break of that floor would likely accelerate selling rather than find quick buyers.
Is the RSI at 24.3 a buy signal for XAUUSD right now?
Not on its own. An RSI of 24.3 confirms oversold conditions, but with the daily ADX at 26.65 marking a strong downtrend and MACD still negative, oversold often leads to a failed bounce rather than a true reversal. Confirmation, such as reclaiming the 4,337.69 resistance, is needed before treating it as bullish.
How will the upcoming US CPI affect XAUUSD this week?
CPI is the key catalyst. A hot print near or above the expected 0.5% would reinforce Fed patience, keep DXY firm at 99.8, and likely cap gold near 4,337.69. A soft print could reverse the overbought dollar and let gold's oversold readings fuel a bounce toward 4,353.25 or 4,364.53.
Why did gold fall while the Nasdaq dropped over 5% on Friday?
Normally an equity selloff sends a safe-haven bid into gold, but the dollar's 0.56% surge to 99.8 after strong payrolls overwhelmed that flow. When gold cannot rally on a 5.41% Nasdaq decline, it signals the rate and dollar story was the dominant driver, not risk sentiment.
The road ahead is not about predicting a single outcome; it is about respecting the conflict on the chart and letting the data resolve it. Gold enters the week oversold, pressured by a stretched dollar, and structurally intact for the patient. Watch 4,337.69 as the first proof of strength and 4,310.85 as the line the bears must defend, then let CPI and the Fed countdown do the talking. Volatility creates opportunity, and the traders who wait for confirmation rather than chase the move are the ones who tend to be rewarded when the dust settles.
Track markets in real-time
AI-powered analysis, technical indicators and real-time price data.
Join Our Telegram Channel
Breaking market news, AI analysis and trading signals instantly.
Join Channel