Have you ever felt the frustration of watching your carefully laid trading plans crumble before your eyes? The world of Bitcoin (BTCUSD) can be particularly unforgiving, and today, the cryptocurrency is exhibiting signs of a bearish trend, hovering near $70,527. The burning question on every trader's mind: Is this a temporary pullback or the start of a deeper correction?
- RSI at 40.4 on the 1H chart indicates neutral territory, but a potential for further decline.
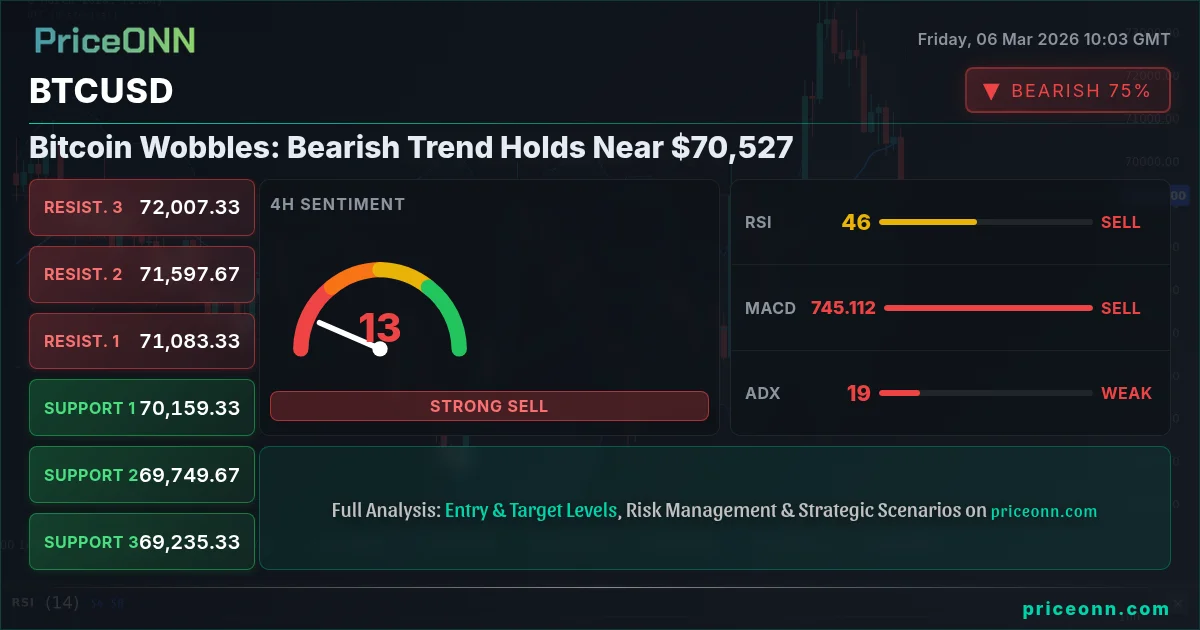
- Immediate resistance looms at $70,996, a key level to watch for a bullish reversal.
- MACD histogram on the 1H chart shows negative momentum, suggesting continued bearish pressure.
- Broader market context: DXY strength is adding pressure, while risk appetite wanes in equities.
The price action of Bitcoin is not happening in a vacuum. The broader market environment, particularly the strength of the US dollar (DXY), plays a significant role. With the DXY currently at 98.99 and trending upwards, as the dollar index strengthens, it puts downward pressure on Bitcoin and other cryptocurrencies. This inverse correlation is a key factor traders should consider when assessing the bitcoin bullish or bearish today. Furthermore, the SP500 is down -0.26%, at 6798.75, suggesting a decrease in risk appetite. This risk-off sentiment often leads investors to seek safe-haven assets, pulling capital away from more volatile investments like Bitcoin. This confluence of factors creates a challenging landscape for Bitcoin bulls.
Looking at the technical picture, the 1-hour chart presents a bearish outlook. The ADX, at 22.33, points to a medium-strength downtrend. This suggests that the bearish momentum is not overwhelming, but it is persistent. The RSI, currently at 40.4, is in neutral territory, indicating that Bitcoin is neither overbought nor oversold. However, the downward trajectory of the RSI suggests that further declines are possible. The MACD histogram reinforces this bearish sentiment, showing negative momentum. For scalpers, the hourly chart suggests shorting rallies towards the $70,996 resistance, but with tight stops, given the medium-strength downtrend indicated by the ADX. The key is to manage risk carefully and not get caught in a potential short squeeze.
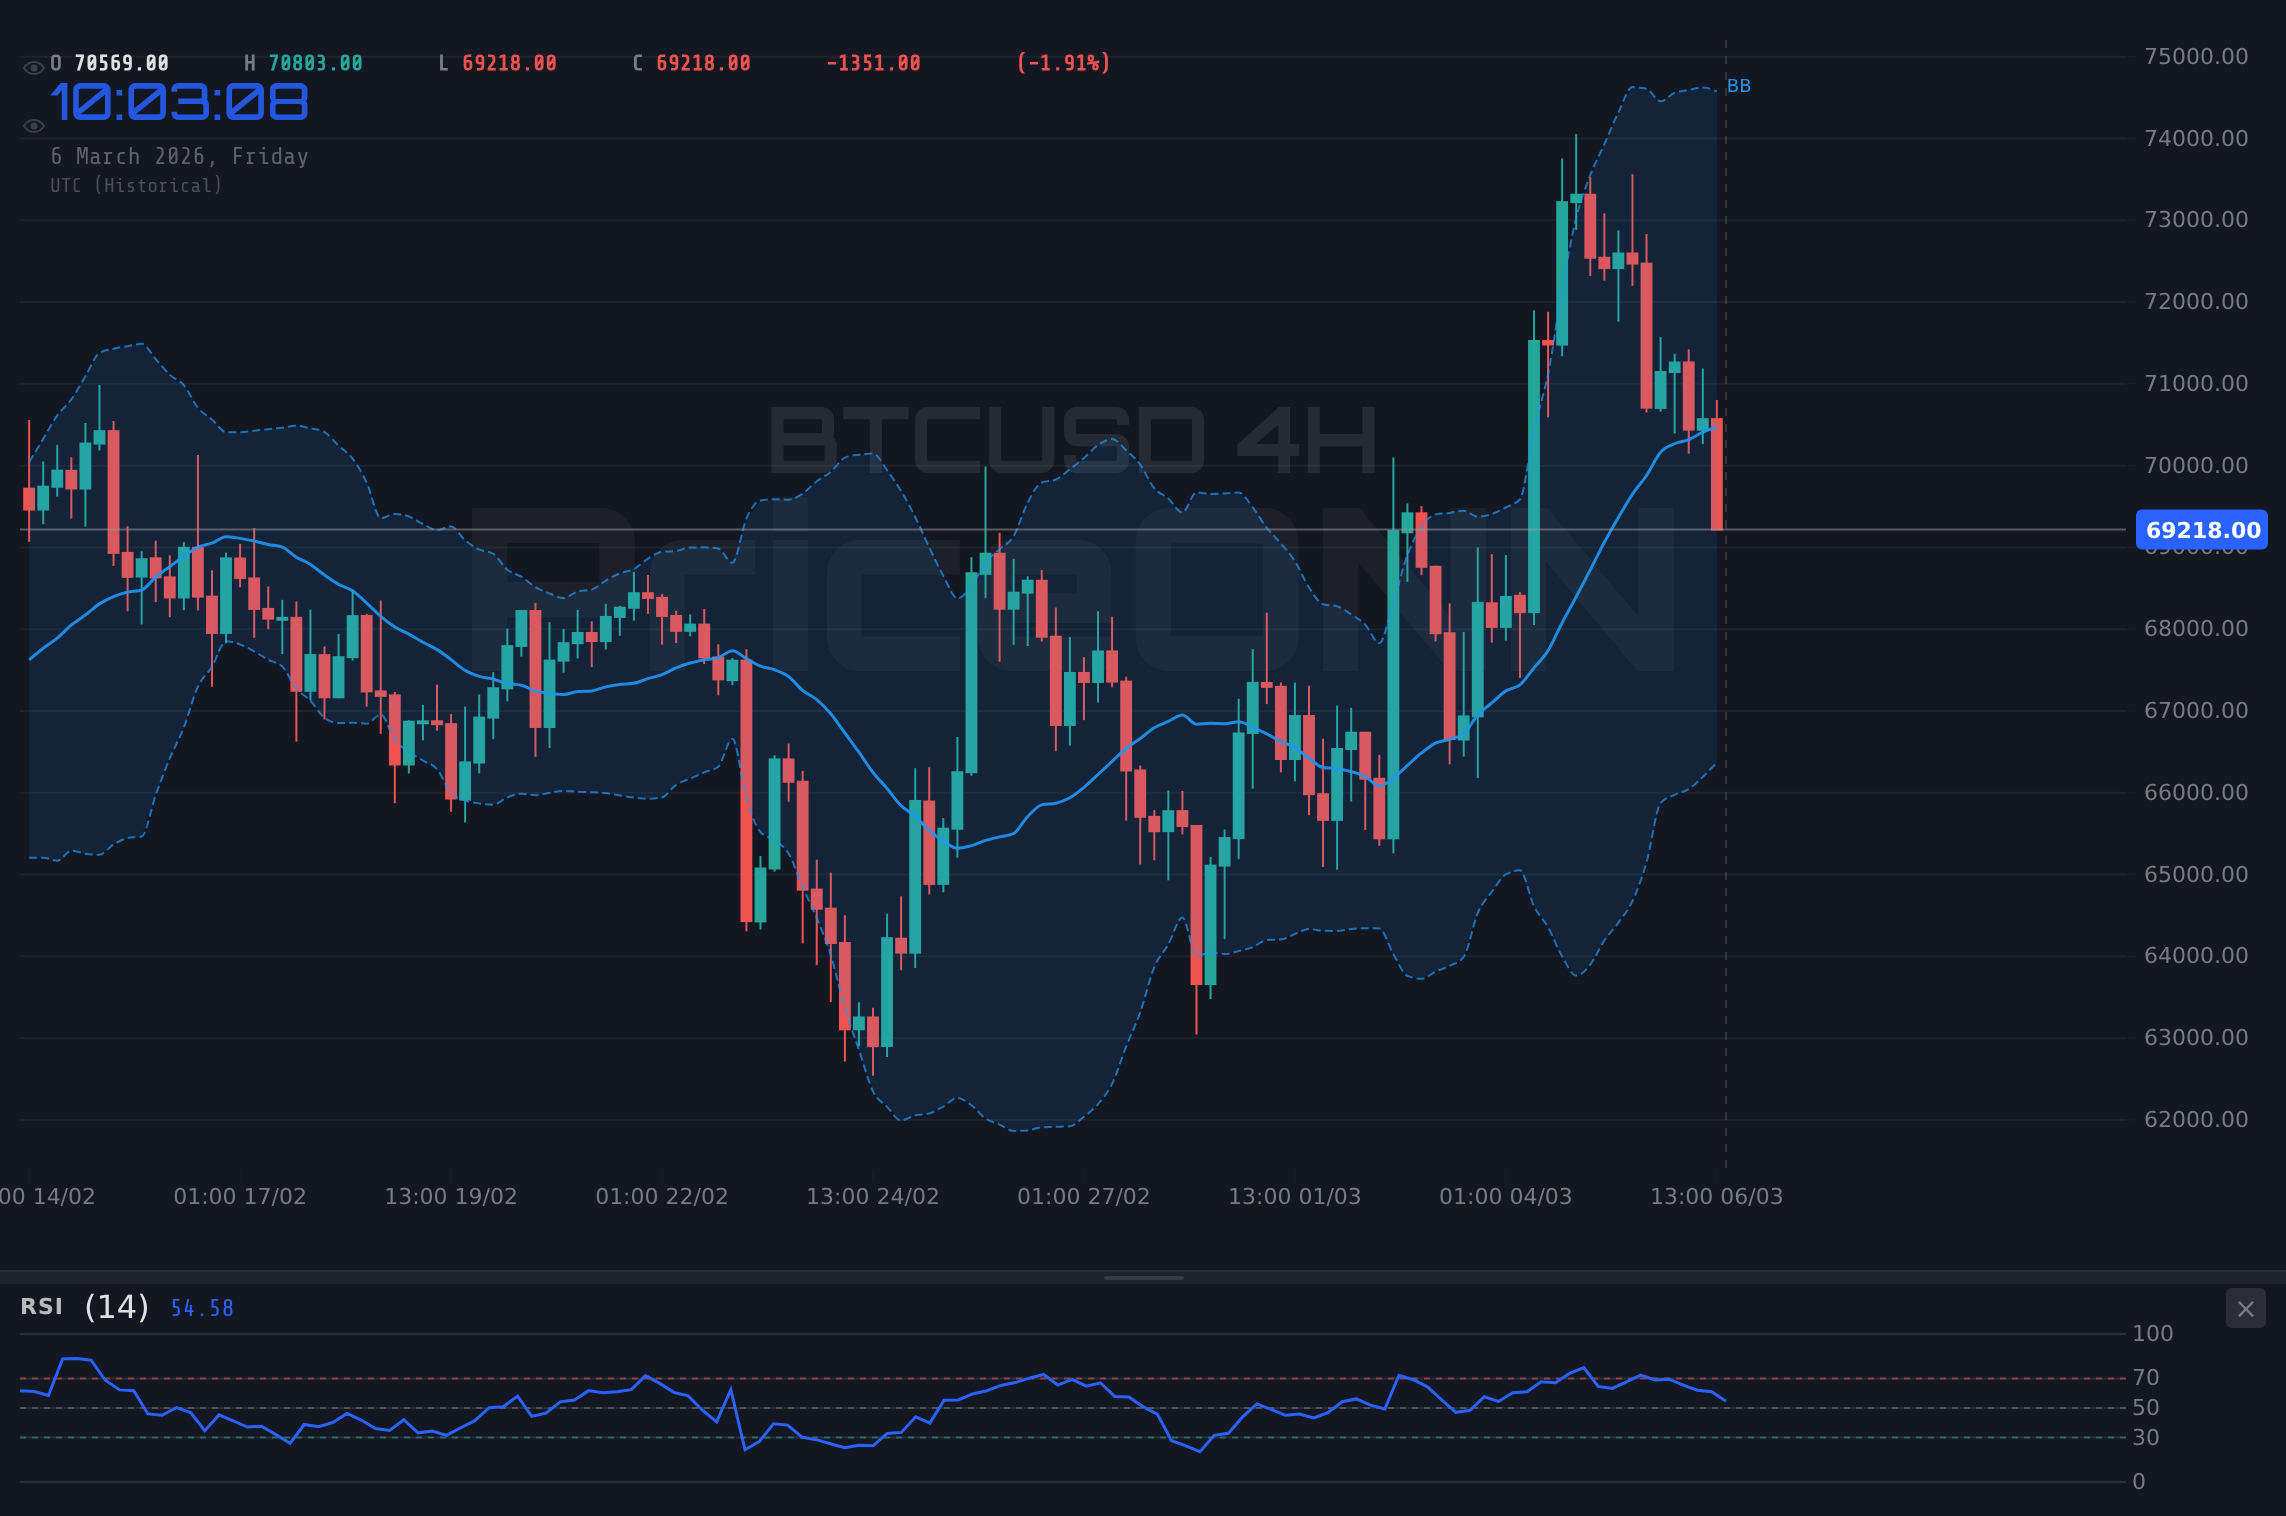
On the 4-hour timeframe, the picture is mixed. While the overall trend is neutral, the stochastic indicator presents a K value of 14.13 and a D value of 41.02, showing a strong oversold condition. This could signal a potential bullish reversal in the medium term. However, the MACD histogram remains negative, indicating that bearish pressure is still present. Swing traders should watch for a break above the $71,193.33 resistance level on the 4-hour chart. A successful break could signal the start of a new uptrend. Conversely, a failure to break above this level would likely lead to further declines towards the $69,916.33 support. Patience is key here; wait for confirmation before committing to a position.
Stepping back to the daily chart, we see a more balanced picture. The overall trend is neutral, and the RSI is at 50.6, indicating neither bullish nor bearish dominance. However, the stochastic indicator shows a K value of 78.37 and a D value of 70.29, suggesting that Bitcoin is approaching overbought territory. This could signal a potential pullback in the coming days. Long-term investors should focus on the bigger picture and not get swayed by short-term volatility. The key is to identify attractive entry points during pullbacks and to build a long-term position in Bitcoin. The next major resistance level to watch is $72,921.33, a break above which could signal a continuation of the long-term uptrend.
The recent ECB monetary policy meeting accounts reveal a Governing Council cautiously optimistic amidst global uncertainty. This cautious optimism could provide some support to risk assets like Bitcoin, but the impact is likely to be limited, given the broader market headwinds. According to Forex news, the EUR/USD pair is under pressure, struggling below the 1.1600 level amid geopolitical tensions and cautious ECB rhetoric. This highlights the broader risk-off sentiment in the market, which is weighing on Bitcoin. Traders should monitor these broader market developments and adjust their strategies accordingly.
Historically, Bitcoin has exhibited a strong correlation with technology stocks, particularly the Nasdaq 100. The Nasdaq 100 is currently down -0.32% at 24887.76, indicating weakness in the tech sector. This weakness could spill over into the cryptocurrency market, putting further downward pressure on Bitcoin. Traders should monitor the performance of the Nasdaq 100 as a leading indicator for Bitcoin's price action. A sustained recovery in the Nasdaq 100 could provide a tailwind for Bitcoin, while continued weakness could exacerbate the bearish trend.
Another crucial factor to consider is the upcoming economic data releases. While the specific events for today, March 6th, have no actual results yet, the market is likely anticipating some announcements. Any surprises in these data releases could trigger significant volatility in the cryptocurrency market. Traders should be prepared for potential whipsaws and adjust their risk management accordingly. It's a day where patience and discipline will be rewarded, and impulsive decisions punished. As Zeynep Arslan, I always remind my traders that mental resilience is key to navigating choppy markets.
The bitcoin bullish or bearish today depends heavily on whether it can hold above the $70,008.33 support level on the daily chart. A break below this level would likely lead to further declines towards the $68,871.67 support. Conversely, a sustained move above the $71,193.33 resistance on the 4-hour chart would signal a potential bullish reversal. The DXY's performance remains critical. If the dollar continues to strengthen, it will be difficult for Bitcoin to sustain any significant upward momentum. Traders should monitor these key levels and indicators and adjust their strategies accordingly. Don't forget to manage your emotions and stick to your trading plan.
For scalpers, the 1-hour chart offers opportunities to trade short-term price fluctuations. However, the medium-strength downtrend and the lack of clear overbought or oversold conditions make it a challenging environment. Swing traders should focus on the 4-hour chart and wait for a clear breakout or breakdown before committing to a position. Long-term investors should use pullbacks as opportunities to accumulate Bitcoin at lower prices. The key is to have a long-term perspective and to not get caught up in the short-term noise. Remember, Bitcoin is a volatile asset, and patience is crucial for long-term success.
Having tracked BTCUSD through various market cycles, I've observed that periods of consolidation often precede significant breakouts or breakdowns. This current period of uncertainty could be a precursor to a major move in either direction. Historically, when the RSI reaches these levels on the daily chart, the outcome has been mixed, depending on the broader market environment. This pattern last appeared in January 2026, when the price subsequently experienced a sharp correction, highlighting the importance of risk management. Always remember to manage your positions carefully and protect your capital. This is not just about making money, it's about preserving your ability to trade another day.
The technical picture for Bitcoin is mixed, with bearish signals dominating the short-term charts and neutral signals prevailing in the longer-term charts. The strength of the US dollar, the weakness in technology stocks, and the upcoming economic data releases all contribute to the uncertainty. Traders should proceed with caution, manage their risk carefully, and wait for clear confirmation before committing to a position. As the market digests the upcoming economic data, clarity is likely to emerge. Until then, disciplined risk management is key to navigating these uncertain waters. Remember, volatility creates opportunity - those prepared will be rewarded.
Frequently Asked Questions: BTCUSD Analysis
Is BTCUSD a good buy right now?
Currently trading near $70,527, BTCUSD presents a mixed outlook. While the stochastic indicates oversold conditions on the 4H chart, the overall trend is neutral. A cautious approach is advised, awaiting a breakout above $71,193.33 before considering a buy.
What is the BTCUSD price forecast for this week?
The BTCUSD price forecast for this week is uncertain. A bearish scenario targets $68,871.67 if $70,008.33 support fails. A bullish scenario eyes $72,921.33 if the price sustains above $71,193.33, with a 50/50 probability for each.
What are the key support and resistance levels for BTCUSD?
Key support levels for BTCUSD are $70,008.33 and $68,871.67, while key resistance levels are $71,193.33 and $72,921.33. These levels represent potential areas of price reversal or continuation.
Why is BTCUSD moving today?
BTCUSD is moving today due to a combination of factors: DXY strength is exerting downward pressure, while weakness in technology stocks adds to the bearish sentiment. The market awaits upcoming economic data releases for further direction.
- RSI at 40.4 on the 1H chart indicates neutral territory, but a potential for further decline.
- Immediate resistance looms at $70,996, a key level to watch for a bullish reversal.
- MACD histogram on the 1H chart shows negative momentum, suggesting continued bearish pressure.
- Broader market context: DXY strength is adding pressure, while risk appetite wanes in equities.
Track markets in real-time
AI-powered analysis, technical indicators and real-time price data.
Join Our Telegram Channel
Breaking market news, AI analysis and trading signals instantly.
Join Channel