Bitcoin is holding near $69,540, but the bulls aren't exactly celebrating. The price action feels tentative, like everyone's waiting for the other shoe to drop. The manufacturing data due later today could be that shoe, and traders need to be ready.
- RSI at 49.33 on the daily chart suggests neutral momentum, leaving room for a downside move.
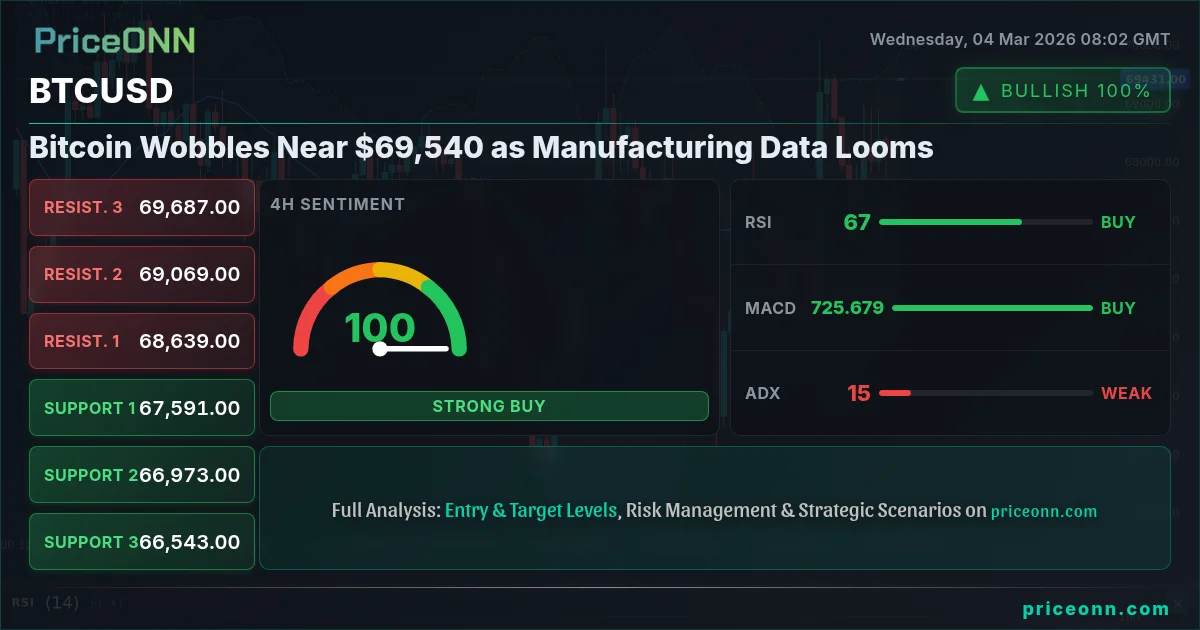
- Key resistance looms at $69,628; a break above this level could trigger a fresh rally.
- ADX at 43.08 indicates a strong downtrend on the daily, warning of potential further declines.
- The upcoming manufacturing data releases are likely to drive BTCUSD volatility and determine the short-term direction.
The "bitcoin price analysis today" is all about uncertainty. We're seeing a tug-of-war between bullish sentiment and bearish technicals. The price is hovering just below the $69,628 resistance, a level that's been tested multiple times without a clear breakout. This consolidation suggests a potential build-up of energy, but the direction of the eventual move remains unclear.
Why $69,628 is the Line in the Sand
Look, this isn't just another arbitrary number. The $69,628 level represents a confluence of resistance. It's a psychological barrier, a technical hurdle, and a point where profit-taking is likely to occur. A daily close above this level would signal a clear bullish intent and could open the door for a run towards $71,228 and potentially even $72,951.
But let's be real: the bears aren't going to give up without a fight. Failure to break above $69,628 could lead to a retest of the $66,305 support. A break below that level would be a major red flag, potentially triggering a deeper correction towards $64,582 and even $62,982.
What the Indicators Are Telling Us
The daily RSI at 49.33 isn't exactly screaming bullish momentum. It's neutral, suggesting that the market is waiting for a catalyst. The MACD histogram, while positive, is showing signs of flattening, indicating that bullish momentum may be waning. And then there's the ADX at 43.08. A reading this high on the daily chart suggests a strong downtrend is still in play. This is where it gets interesting: we have conflicting signals. The short-term indicators are hinting at a potential bullish move, but the longer-term indicators are warning of further downside.
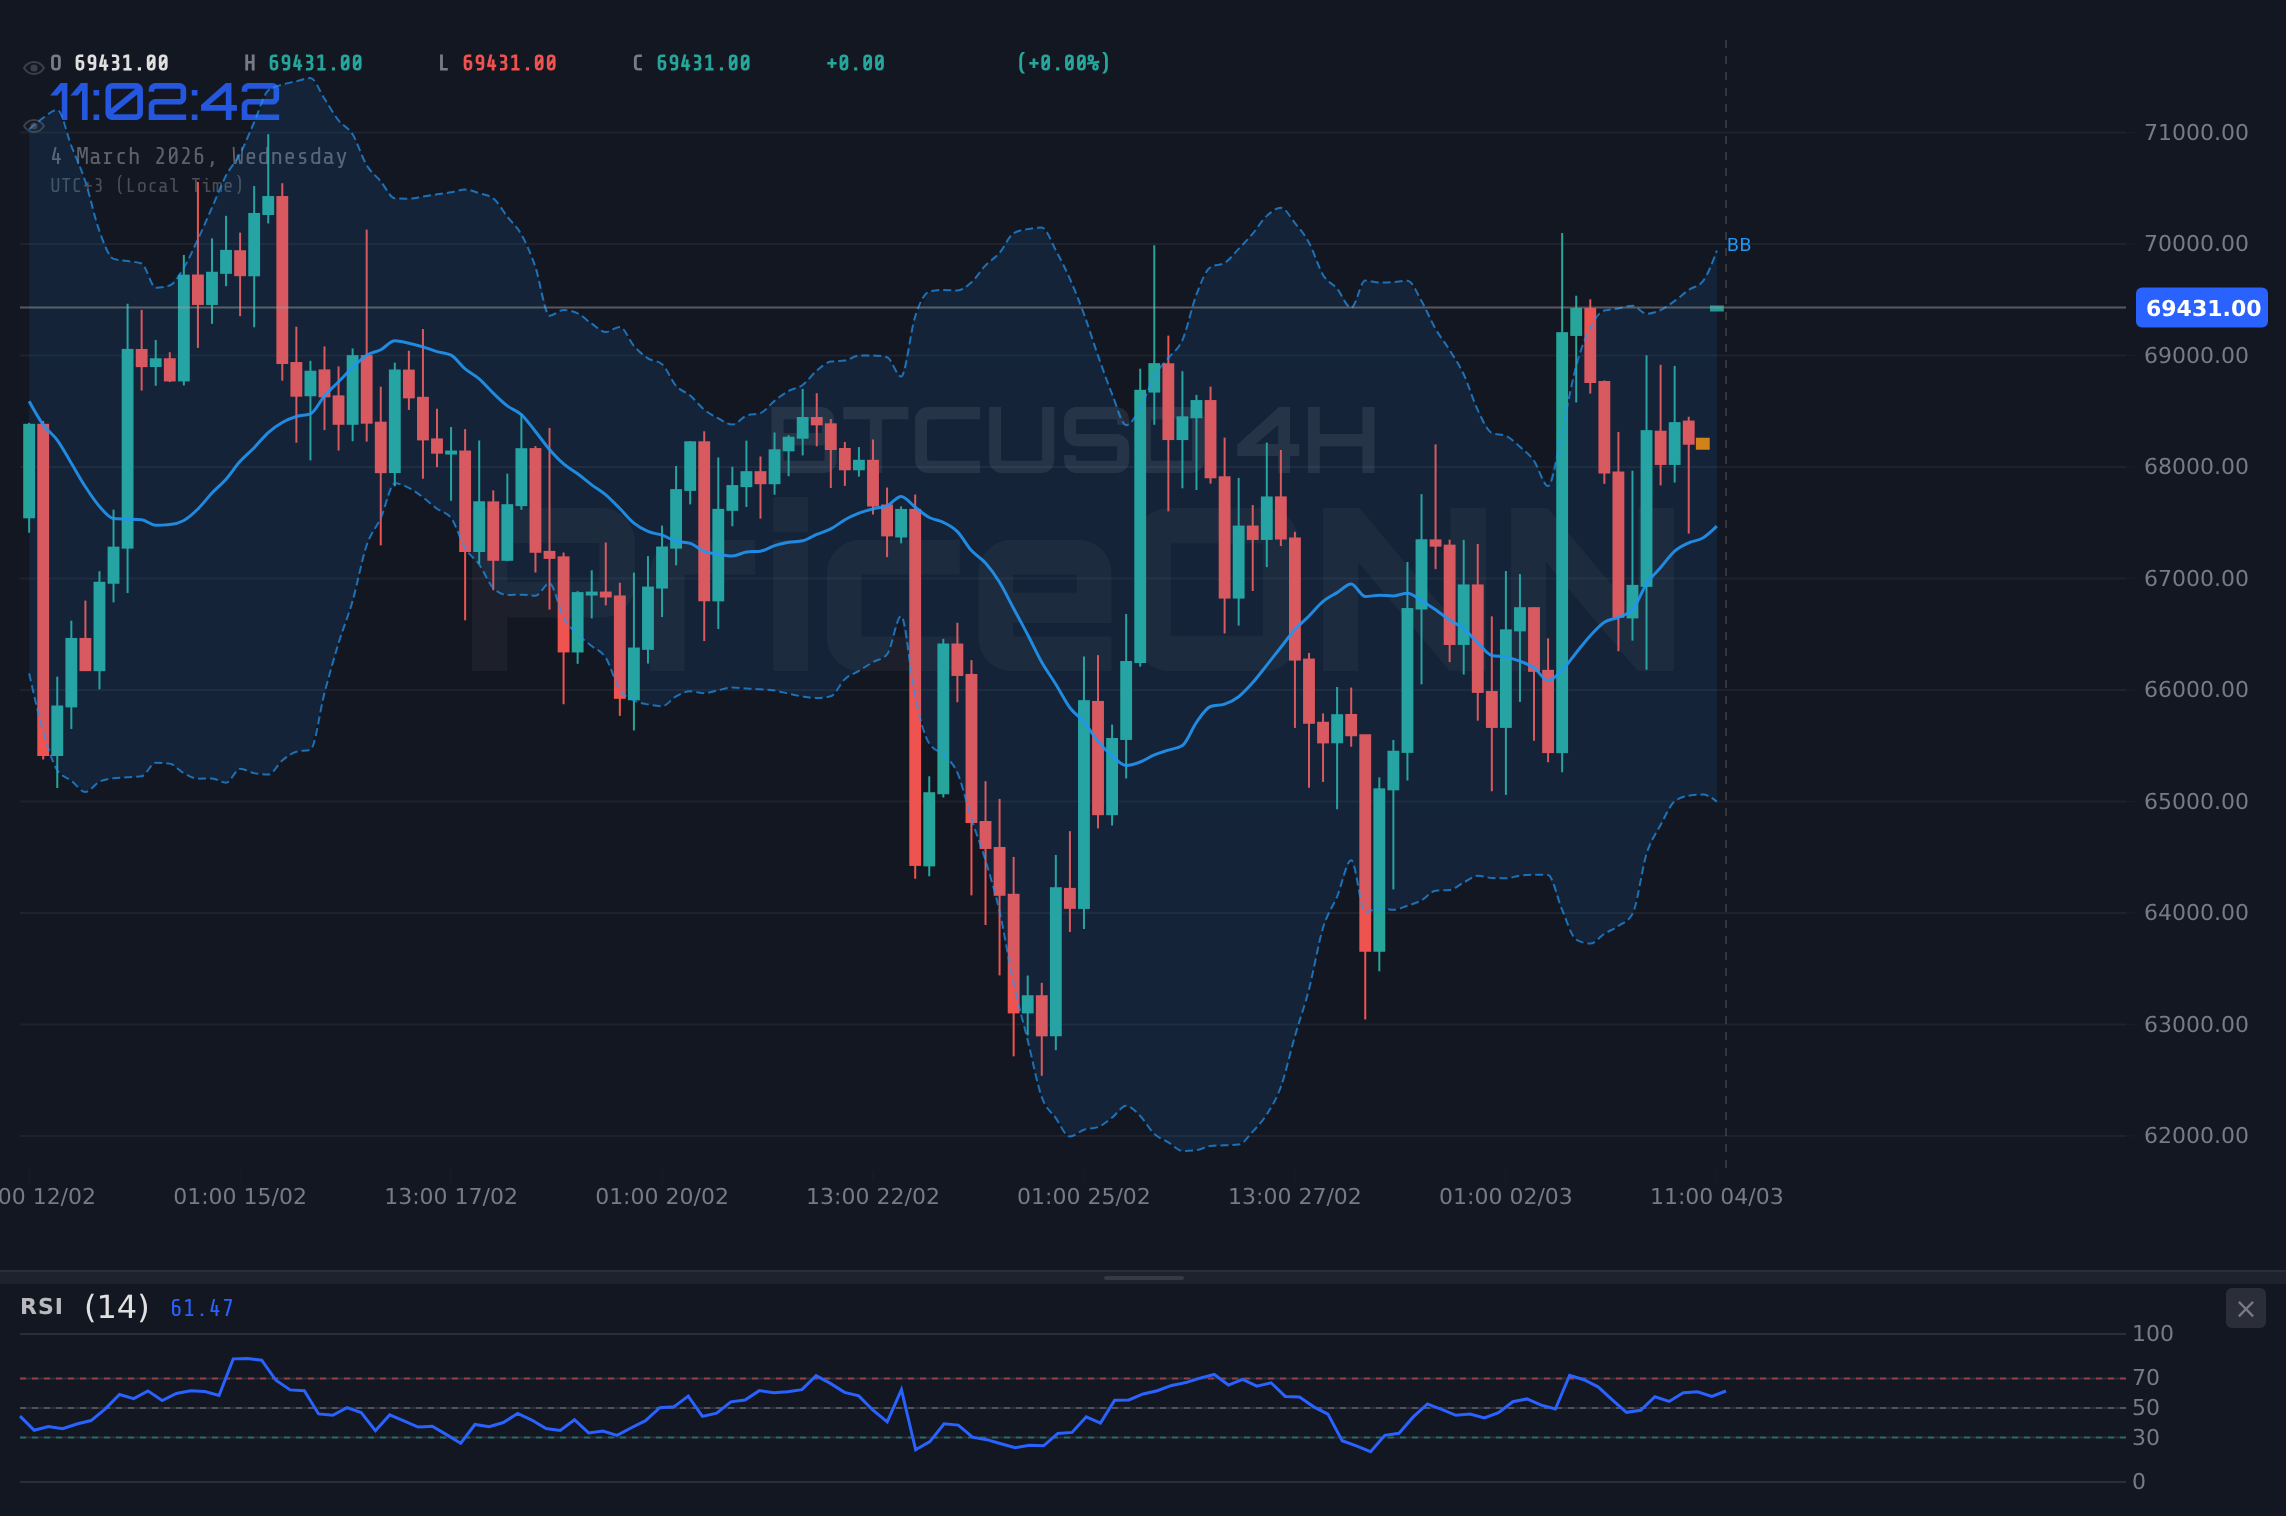
On the 4-hour timeframe, the RSI sits at 60.47, still within neutral territory, but inching closer to overbought conditions. The Stochastic oscillator, currently at K=73.98, D=54.33, is signaling a potential overbought condition as well, suggesting a possible pullback. However, the MACD on this timeframe remains positive, further complicating the picture. This market is indecisive, to say the least!
The Dollar's Role in Bitcoin's Fate
Don't ignore the DXY (Dollar Index). With the DXY at 98.69 and in a generally bullish posture across the 1H, 4H, and 1D timeframes, BTCUSD is under pressure. A stronger dollar often translates to weaker Bitcoin, and that's exactly what we're seeing here. The upcoming manufacturing data is likely to have a significant impact on the dollar, and therefore, on Bitcoin. A strong reading could fuel further dollar strength and put even more pressure on BTCUSD. According to Reuters, "Fed officials are closely monitoring inflation data for any signs of stickiness." This hawkish stance is keeping the dollar supported.
The SP500 is also playing a role. Currently at 6800.9, the SP500 is showing signs of weakness. A decline in risk appetite, as reflected by a falling SP500, could drive investors towards safe-haven assets, but it could also trigger a broader market sell-off, dragging Bitcoin down with it. It's a complex interplay of factors, and traders need to be aware of these correlations.
Manufacturing Data: The Catalyst to Watch
The upcoming manufacturing data releases are the key catalyst to watch. On Monday, the USD saw a negative reading, with Actual lower than Forecast. The market will be watching today's numbers closely. A strong reading would likely fuel further dollar strength and put downward pressure on Bitcoin. A weak reading, on the other hand, could provide some relief for BTCUSD.
Here's the bottom line: The market is waiting for a signal. Until we get that signal, BTCUSD is likely to remain range-bound, oscillating between the $66,305 support and the $69,628 resistance. Patience will be rewarded here. Manage your risk, wait for your setup - the market always gives a second chance.
The Trade Decision: Patience is Key
Given the conflicting signals and the looming economic data releases, the best course of action is to remain patient. A daily close above $69,628 would open the door for a bullish trade, targeting $71,228 and potentially $72,951. Conversely, a break below $66,305 would signal a bearish move, with potential targets at $64,582 and $62,982. Until we see a clear break in either direction, it's best to stay on the sidelines and wait for confirmation.
Frequently Asked Questions: BTCUSD Analysis
Is BTCUSD a good buy right now?
BTCUSD is currently at $69,540. Given the conflicting signals and the upcoming manufacturing data, it's not a clear buy right now. Wait for a confirmed break above $69,628 or a drop below $66,305 before making a decision.
What is the BTCUSD price forecast for this week?
The BTCUSD price forecast for this week is highly dependent on the manufacturing data. A bullish scenario targets $71,228, while a bearish scenario targets $64,582. The probability of either scenario playing out is roughly 50/50 until the data is released.
What are the key support and resistance levels for BTCUSD?
Key support levels for BTCUSD are $66,305, $64,582, and $62,982. Key resistance levels are $69,628, $71,228, and $72,951. These levels are derived from daily chart analysis and represent significant areas of price congestion.
Why is BTCUSD moving today?
BTCUSD is primarily moving due to uncertainty surrounding the upcoming manufacturing data releases. A strong dollar, influenced by hawkish Fed expectations, is also putting downward pressure on Bitcoin. Market sentiment is mixed, contributing to the current volatility.
Track markets in real-time
AI-powered analysis, technical indicators and real-time price data.
Join Our Telegram Channel
Breaking market news, AI analysis and trading signals instantly.
Join Channel