The cryptocurrency market is holding its breath as Bitcoin (BTCUSD) dances around the critical $71,798 level. While the digital asset has shown resilience, a complex tapestry of technical signals and a dominant macro backdrop suggest that the path forward might be more nuanced than a simple continuation of the recent upward momentum. This isn't a time for blind faith; it's a moment for sharp analysis, understanding the conflicting indicators, and discerning the true market sentiment. What does the chart tell us when the signals are this mixed, and how should traders position themselves for the potential volatility ahead?
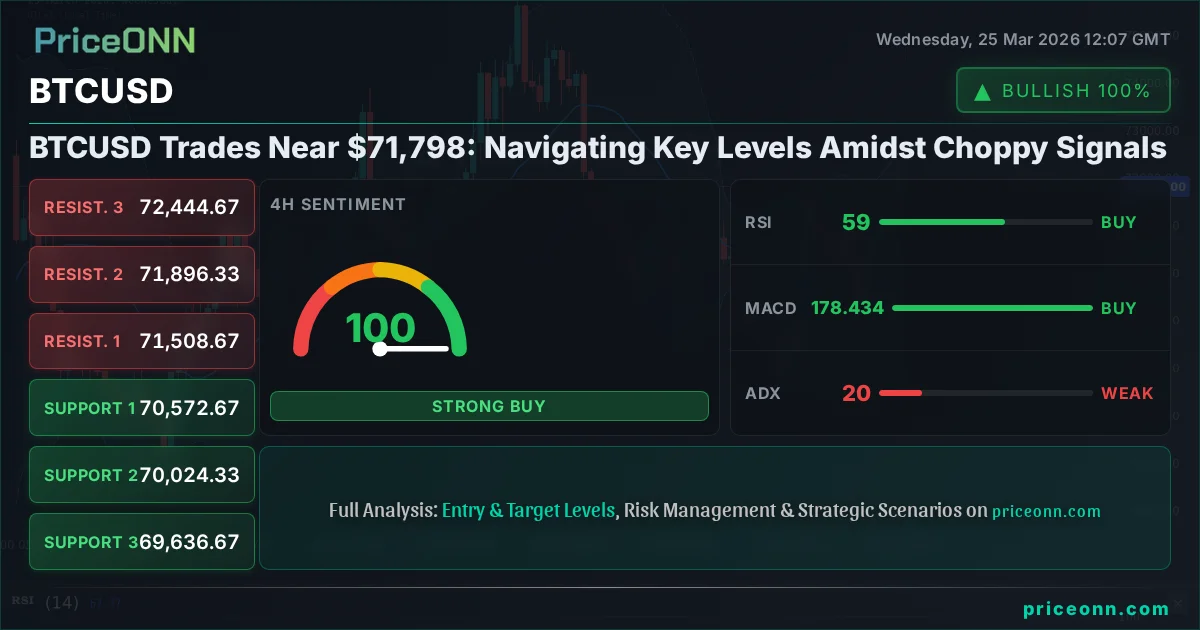
- RSI at 68.13 suggests bullish momentum is present but approaching overbought territory on the 1H chart, indicating a need for caution.
- The critical support for BTCUSD sits at $71,328.33, tested in recent 1H trading, with further levels at $71,152.67 and $71,011.33.
- MACD histogram shows positive momentum on the 1H and 4H charts, but ADX readings below 20 across most timeframes indicate a weak overall trend, suggesting a lack of strong directional conviction.
- Correlation with the DXY, currently at 99, and SP500, trading near 6625.95, provides context, though BTCUSD's independent drivers are paramount.
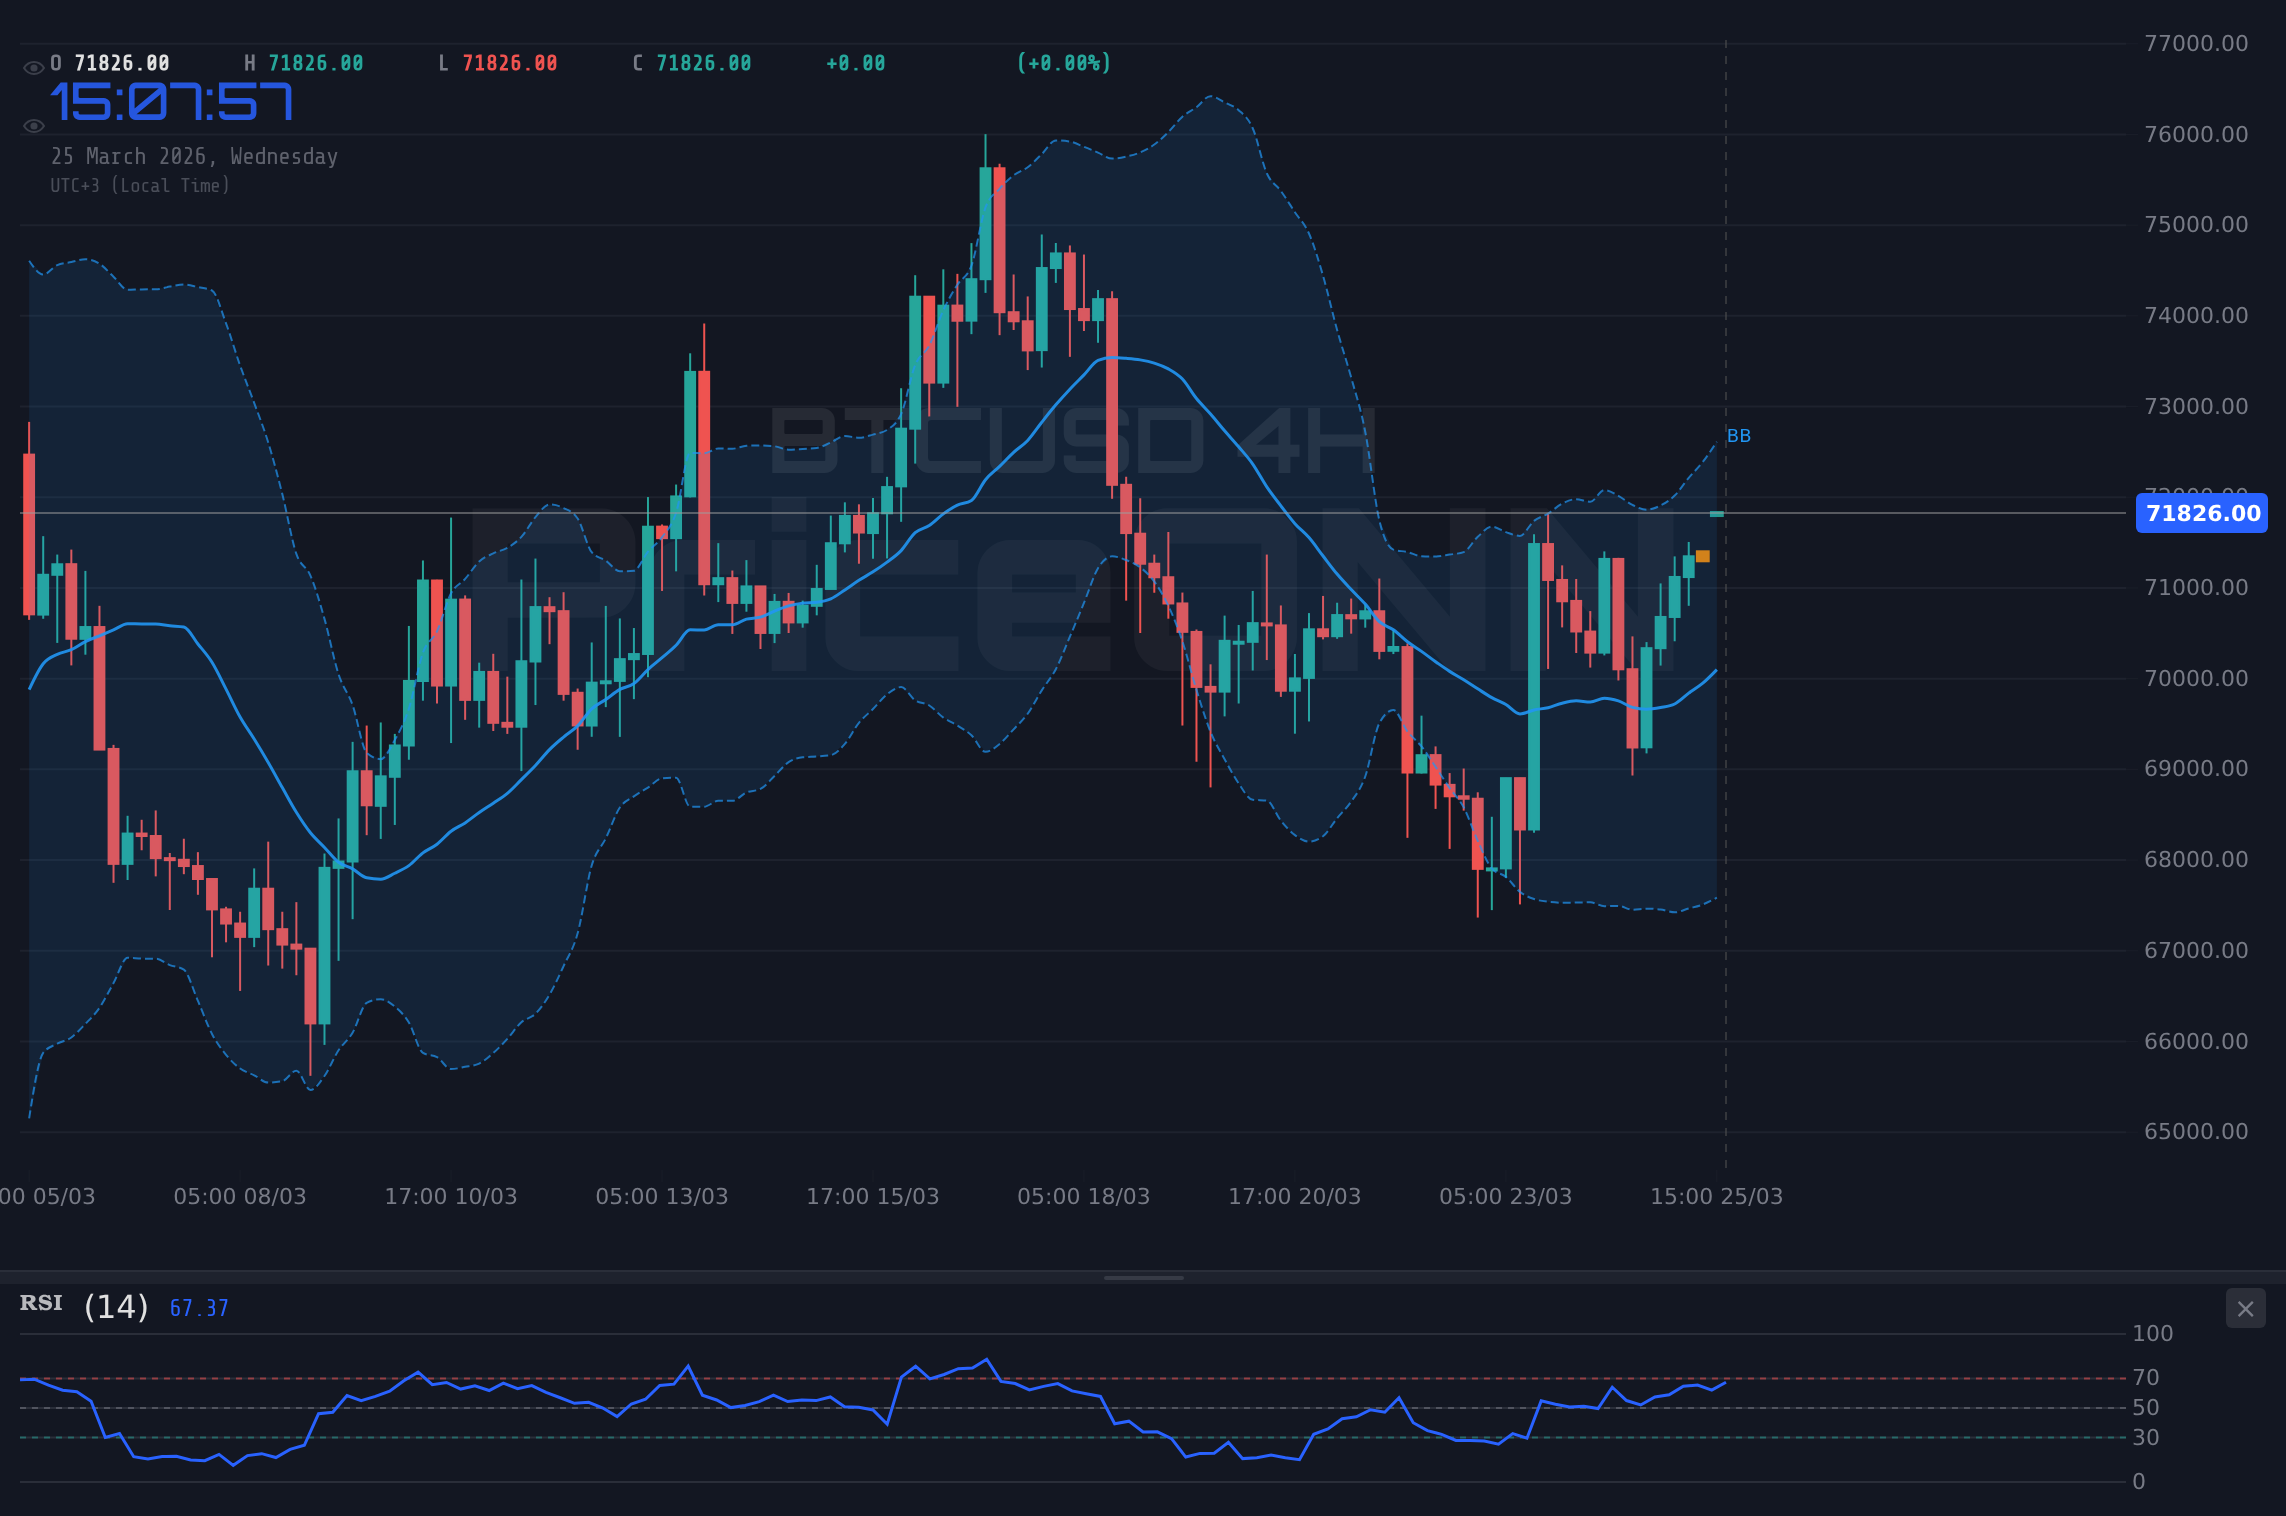
The current market environment for Bitcoin presents a fascinating dichotomy. On one hand, the price action around $71,798 shows a persistent bid, with the 1-hour chart displaying a bullish inclination. The MACD is painting a positive picture, and the Stochastic oscillator is showing strength, even flirting with overbought conditions. This suggests that short-term traders might find opportunities on the buy side. However, delving deeper into the technicals reveals a less convincing narrative. The Average Directional Index (ADX) across multiple timeframes, particularly the 1H at 19.71 and 4H at 19.62, points towards a weak trend. This is the real story here; a weak-trend reading means the breakout hasn't truly committed. It’s like a car revving its engine but not yet engaging the gear – the potential is there, but the conviction is missing.
This lack of strong directional conviction is amplified when we examine the daily chart. Here, the trend is technically neutral with a 50% power rating, but the RSI sits at a more subdued 53.16, and the MACD, while positive, is not showing the explosive momentum seen on shorter timeframes. The daily Stochastic is also showing a more moderate upward signal. This divergence between the short-term bullish signals and the longer-term neutral to cautiously optimistic outlook highlights the current indecision in the market. It’s a tug-of-war between short-term traders looking for quick gains and longer-term investors assessing the broader macroeconomic landscape and the underlying strength of the cryptocurrency market's trend. Patience is key; this isn't a market that's screaming 'buy now' with a single, clear voice.
The correlation with traditional markets adds another layer to this analysis. The US Dollar Index (DXY) is currently trading around 99, showing a mixed signal with a bullish leaning on the daily chart but neutral on the hourly. Historically, a strengthening dollar can put pressure on risk assets like Bitcoin. Meanwhile, the SP500 is showing strength, trading above 6625.95, which generally supports a positive risk appetite. However, the Nasdaq 100, while also showing upward momentum on shorter timeframes, has a predominantly bearish daily trend signal, indicating potential headwinds for tech-heavy assets. This mixed correlation means that while broader market sentiment might offer some support, it’s not a definitive tailwind for Bitcoin. Traders must therefore rely more heavily on BTCUSD's internal technical structure and its direct drivers rather than assuming a seamless correlation with equities.
When we look at the price action itself, the $71,798 mark is more than just a number; it's a psychological and technical battleground. The 1-hour chart shows immediate resistance at $71,786.67, closely followed by $71,962.33. A decisive break above these levels, backed by increasing volume and stronger ADX readings, would signal a shift towards a more committed bullish trend. However, the immediate support levels are also crucial. The $71,328.33 mark, which has already seen some testing, is the first line in the sand. Below that, $71,152.67 and $71,011.33 represent more significant floors. A failure to hold these supports could quickly shift the sentiment and open the door for a deeper correction, especially if broader market risk appetite falters.
The Bullish Case: Momentum and Short-Term Strength
The immediate allure for traders lies in the short-term bullish signals. On the 1-hour chart, the BTCUSD is trading above its middle Bollinger Band, and the Stochastic oscillator is firmly in bullish territory, with %K above %D. The MACD histogram is also printing positive values, suggesting that the buyers have had the upper hand in recent hours. With a general 'BUY' signal count of 8 on the 1H timeframe, it’s clear that short-term momentum is favoring the upside. If Bitcoin can decisively clear the immediate resistance hurdles around $71,786.67 and $71,962.33, we could see a move towards higher targets. This scenario is predicated on the continuation of this intra-day buying pressure, perhaps fueled by renewed retail interest or short-covering activity.
A sustained push above $71,962.33 could potentially target the $72,444.67 level identified on the 4-hour chart. This would require a significant increase in bullish conviction, reflected in a rising ADX and a stronger RSI reading above 60 on the daily timeframe. However, it's crucial to remember that the overall trend strength remains weak. A breakout above current resistance would need to be confirmed by increasing volume and a gradual increase in the ADX, signaling that the market is indeed building conviction behind the move. Without this confirmation, any upside could be a 'bull trap,' luring unsuspecting traders into positions that are quickly reversed.
The Bearish Scenario: Weak Trends and Daily Caution
On the flip side, the longer-term technical picture presents a more cautious outlook, leaning towards a bearish scenario if key levels fail. The daily chart, despite showing some positive signals from Stochastic, is dominated by a bearish trend signal (though with only 94% power, it's not absolute yet). The RSI at 53.16 is in neutral territory, but the MACD is less enthusiastic than on shorter timeframes. More importantly, the ADX on the daily chart is at 17.71, indicating a weak trend overall. This means that any upward movement might lack fundamental strength and could be susceptible to a sharp reversal.
If BTCUSD fails to hold the immediate support at $71,328.33, the bearish scenario gains significant traction. The next support levels are at $71,152.67 and $71,011.33 on the 1-hour chart. A break below these could lead to a more substantial decline, potentially targeting the 4-hour support at $70,572.67 and subsequently $70,024.33. This downside move would be confirmed if the daily RSI begins to dip below 50 and the MACD shows bearish divergence or crosses below its signal line. The key invalidation for this bearish outlook would be a strong, decisive close above the daily resistance level at $71,515.33, indicating that the short-term strength is indeed translating into a broader trend shift.
The Neutral Consolidation: Range-Bound Uncertainty
Given the conflicting signals, a period of consolidation or range-bound trading is a highly plausible scenario. The current price of $71,798 sits within a zone where both buyers and sellers have shown interest, but neither has established clear dominance. The weak ADX readings across multiple timeframes strongly support this view. This suggests that Bitcoin might trade sideways for a period, oscillating between the immediate support and resistance levels identified. Such a phase could be characterized by choppy price action, false breakouts, and a general lack of clear direction, making it challenging for traders seeking strong directional trades.
In a consolidation phase, traders might look for opportunities to trade within the defined range, buying near support and selling near resistance. However, this strategy requires strict risk management, as a breakout from the range could occur suddenly. The key levels to watch in this scenario are the immediate support at $71,328.33 and resistance at $71,786.67 on the 1-hour chart. A sustained period of trading between these levels, without a clear break, would confirm the neutral outlook. The market is essentially waiting for a catalyst – perhaps a significant macroeconomic announcement, a shift in institutional sentiment, or a clear technical breakout – to break this indecision.
The influence of economic data, though not directly dictating Bitcoin's price in the same way as traditional currencies, cannot be ignored. While there were no high-impact USD events today, upcoming releases like the US Services PMI (forecast: 52.4) and ISM Manufacturing PMI (forecast: 51.1) will be closely watched. Stronger-than-expected economic data could bolster the DXY and potentially weigh on risk assets like BTCUSD, while weaker data might have the opposite effect. Similarly, any shifts in the Fed's stance, even implied, can ripple through the crypto markets. The market is currently pricing in a specific path for interest rates, and any deviation from these expectations could introduce volatility.
Navigating the Choppy Waters: What Traders Should Watch
For those looking to navigate this complex market, a multi-faceted approach is essential. Short-term traders might find opportunities in the hourly momentum, targeting immediate resistance levels, but must be prepared for rapid reversals. They should pay close attention to the $71,328.33 support – a break here invalidates the short-term bullish thesis. Longer-term investors should focus on the daily chart and the overall trend strength, or lack thereof. The ADX remains the most telling indicator of conviction. A sustained move above 25 on the daily chart, coupled with RSI moving decisively above 55 and MACD confirming momentum, would be needed to signal a more robust upward trend.
Risk management remains paramount. The current environment, characterized by mixed signals and weak trend strength, is ripe for false moves. Setting tight stop-losses, being prepared to take profits quickly, and waiting for clear confirmation before committing to significant positions are crucial. The $71,798 level is a pivot point; its ability to hold as support or break as resistance will dictate the immediate direction. Until a clearer trend emerges, caution and a focus on defined risk levels should be the guiding principles.
Bearish Scenario: Breakdown Below Support
60% ProbabilityNeutral Scenario: Range-Bound Consolidation
30% ProbabilityBullish Scenario: Breakout Confirmation
10% ProbabilityFrequently Asked Questions: BTCUSD Analysis
What happens if BTCUSD breaks below the $71,328.33 support level?
A break below $71,328.33 on the 1-hour chart would invalidate the immediate bullish sentiment and likely trigger a move towards lower supports at $71,152.67 and potentially $70,572.67. This would align with the bearish scenario, especially if confirmed by daily chart indicators.
Should I buy BTCUSD at current levels around $71,798 given the mixed signals?
Entering at current levels requires extreme caution. While short-term momentum is present, the weak trend strength (ADX below 20) suggests risk. A confirmation above $71,786.67 with increasing volume offers a higher probability bullish entry, while waiting for a retest of support near $71,328.33 could offer a better risk/reward for cautious buyers.
Is the RSI at 68.13 a sell signal for BTCUSD right now?
An RSI of 68.13 on the 1-hour chart indicates strong bullish momentum but is not yet in extreme overbought territory (typically above 70). While it suggests bulls are active, it also warns that the market could be nearing a short-term exhaustion point. A sustained move above 70 would be a stronger overbought signal, potentially leading to profit-taking.
How will upcoming economic data like the US Services PMI affect BTCUSD this week?
Stronger-than-expected US Services PMI data (forecast 52.4) could strengthen the DXY and potentially pressure BTCUSD, as it might imply a more hawkish stance from the Fed. Conversely, weaker data could weaken the dollar and offer some support to risk assets like Bitcoin. The market will be sensitive to any deviations from forecasts.
While the immediate outlook for Bitcoin around $71,798 remains uncertain, characterized by conflicting signals and weak trend conviction, opportunities often emerge from such ambiguity. The market is currently in a state of indecision, waiting for a catalyst to break the stalemate. Patience and disciplined risk management are not just advisable; they are essential. By focusing on the key levels, understanding the interplay of different timeframes, and remaining vigilant for confirmation, traders can position themselves to capitalize on the eventual resolution of this consolidation phase.
Track markets in real-time
AI-powered analysis, technical indicators and real-time price data.
Join Our Telegram Channel
Breaking market news, AI analysis and trading signals instantly.
Join Channel