The US Dollar Index (DXY) is currently testing a critical resistance zone around $99.18. This isn't just another price point; it's a level that, if breached decisively, could signal further strength for the dollar and put pressure on riskier assets. Having watched the DXY navigate various economic crosscurrents, this current juncture feels particularly pivotal. The question on many traders' minds is whether the dollar has the fundamental backing and technical momentum to push higher, or if this resistance will hold, leading to a potential pullback.
The recent surge in the DXY, currently trading at $99.18, is underpinned by a confluence of factors, most notably the perceived resilience of the US economy relative to other major blocs and persistent inflation concerns that keep the Federal Reserve's hawkish stance in play. The daily chart paints a picture of a strong uptrend, with the ADX indicator registering a robust 32.74, indicating significant trend strength. This suggests that the upward momentum isn't merely a fleeting reaction but a more sustained move, potentially targeting the next significant resistance level at $99.56.
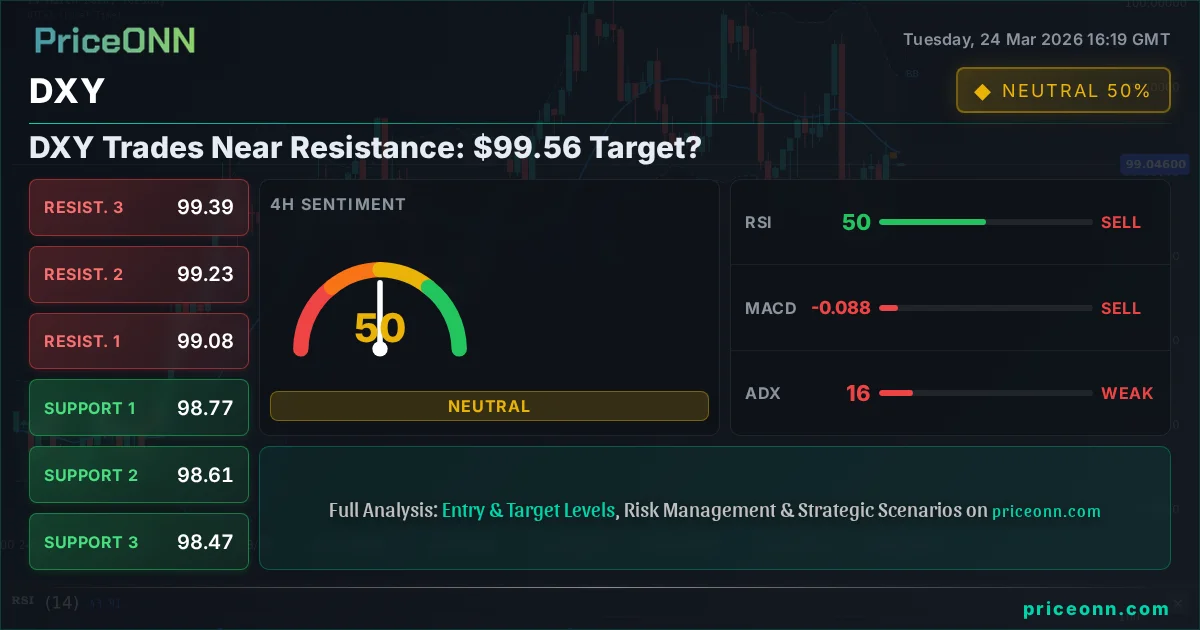
- The DXY is trading at $99.18, approaching a key resistance level.
- The daily ADX is at 32.74, indicating a strong uptrend and potential for further gains towards $99.56.
- RSI at 55.7 suggests upward momentum, but Stochastic's K=42.09, D=59.03 shows potential for a pullback.
- Geopolitical tensions and differing central bank policies are key drivers for dollar strength.
Navigating the Dollar's Ascent: Technical Signals
Daily Timeframe Dynamics: A Bullish Undercurrent
On the daily chart, the DXY displays a compelling uptrend, currently supported by an ADX reading of 32.74. This strength suggests that the market is committed to the current direction, making a break above the immediate resistance at $99.18 a distinct possibility. The RSI(14) at 55.7 further reinforces this bullish sentiment, sitting comfortably in neutral territory with an upward inclination, signaling room for further appreciation. However, the Stochastic oscillator presents a note of caution: the %K line at 42.09 is below the %D line at 59.03, hinting at potential downward pressure or a consolidation phase ahead. This divergence between RSI and Stochastic warrants close observation; it suggests that while the overall trend is up, short-term buying pressure might be waning, opening the door for profit-taking or a minor retracement before any significant move higher.
The 1-Hour and 4-Hour Perspectives: Short-Term Crosscurrents
Looking at the shorter timeframes, the picture becomes more nuanced. On the 1-hour chart, the DXY shows a neutral trend with a strength of 50%, trading near resistance at $99.11. The RSI is at 55.18, indicating upward inclination, while the Stochastic is showing a bearish signal (%K
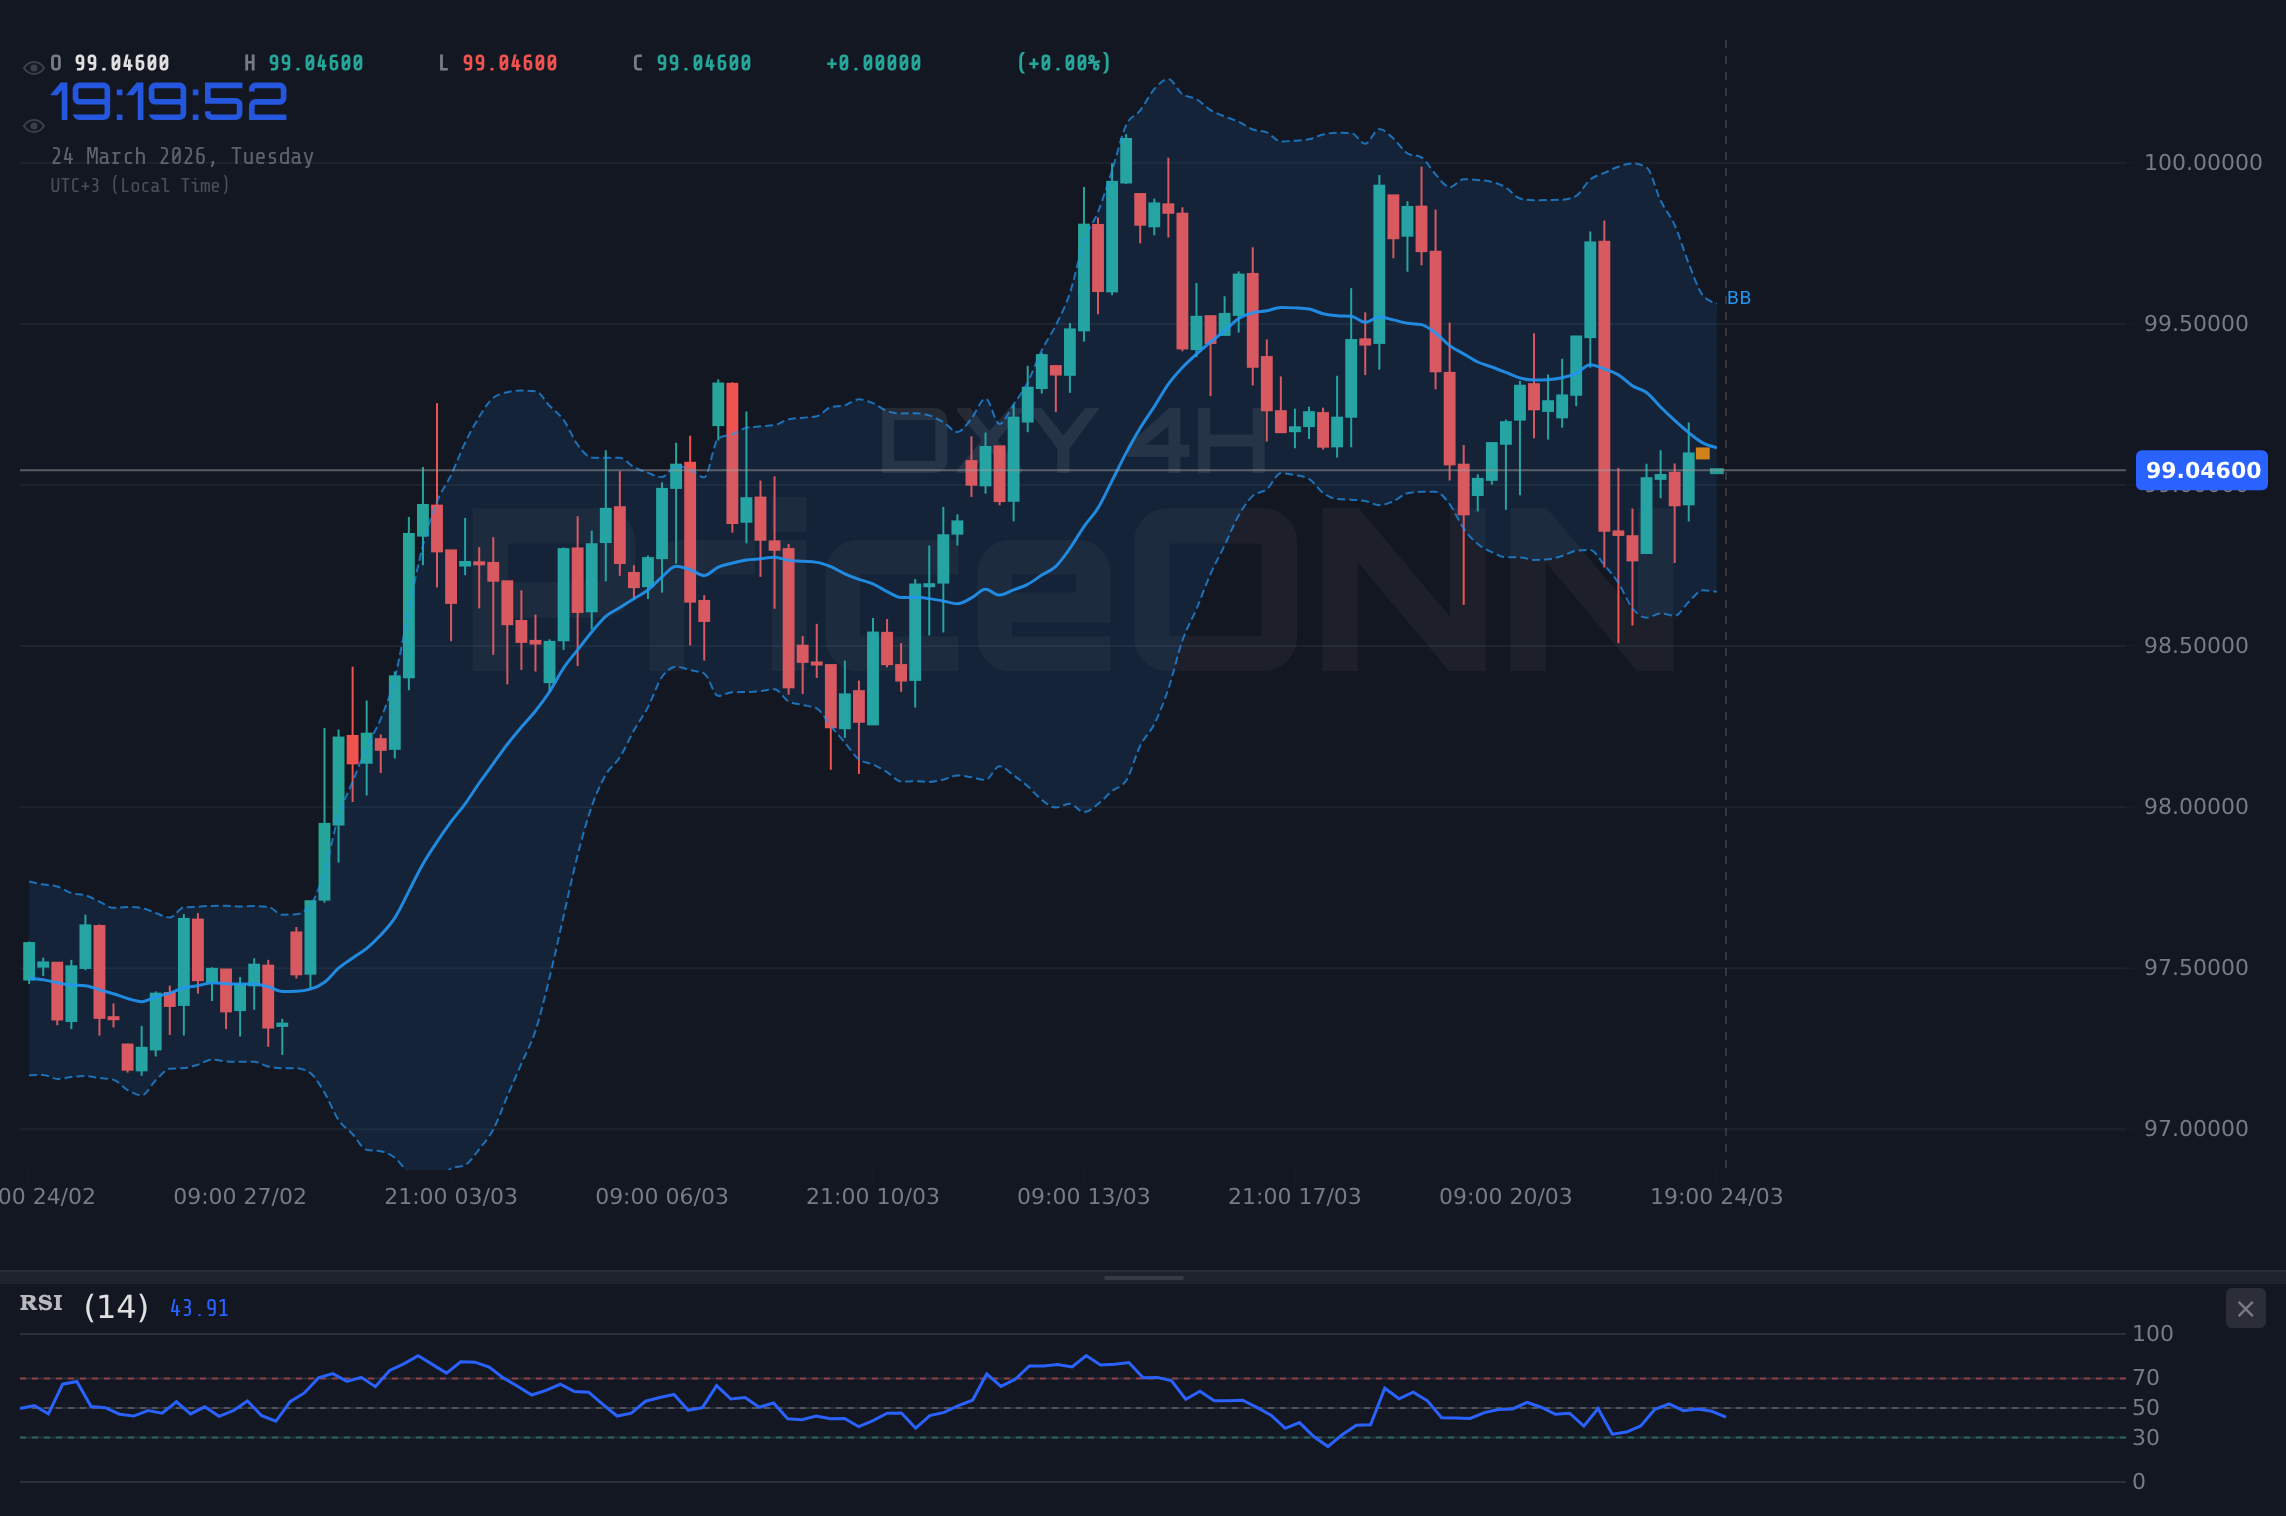
The 4-hour chart presents a slightly different narrative. Here, the trend is also neutral with 50% strength, but the RSI is dipping towards 49.63, suggesting a slight cooling of momentum. The Stochastic, with %K at 41.13 and %D at 33.64, shows a bullish signal, indicating potential upside from current levels. The MACD is negative, however, and the ADX remains weak at 15.8. This mixed signal environment on the intraday charts implies that while the daily trend points upwards, the immediate path forward for the DXY might involve consolidation or even a brief dip before the next significant directional move. Traders will be closely watching the interplay between these shorter-term indicators and the overarching daily trend.
Fundamental Drivers: What's Fueling the Dollar?
Central Bank Policies: The Fed's Tightrope Walk
The Federal Reserve's monetary policy remains a primary driver for the US Dollar Index. While inflation has shown signs of cooling, it remains stubbornly above the Fed's 2% target. This persistent inflation, coupled with a resilient labor market, has forced the Fed into a delicate balancing act. The market is pricing in a higher probability of interest rates remaining elevated for longer, a scenario that traditionally supports a stronger dollar. The CME FedWatch tool, if available, would likely show probabilities shifting towards fewer rate cuts in the near term. This uncertainty about the Fed's next move, and the market's interpretation of it, creates significant volatility. Any hawkish commentary from Fed officials, such as San Francisco Fed President Mary Daly's recent remarks about navigating uncertain monetary policy paths, tends to bolster the dollar. Conversely, any hint of a dovish pivot could trigger a sharp dollar sell-off. This policy divergence, where the Fed appears more resolute in its fight against inflation compared to some other major central banks, is a key reason for the DXY's current strength.
Macroeconomic Landscape: US Strength vs. Global Headwinds
The US economic data continues to paint a picture of relative strength, even as global growth prospects dim. Recent GDP figures and PMI data have generally exceeded expectations, showcasing a more robust economic engine than many of its peers. This economic outperformance naturally attracts capital, increasing demand for the dollar. In contrast, economic indicators from Europe and Asia have been more mixed. For instance, the cooler-than-expected Japanese inflation report for February, as noted in recent news, is weakening the Yen and contributing to USD/JPY's rise near 158.55, indirectly supporting the DXY. This global economic dichotomy is a powerful tailwind for the dollar, as investors seek the safest and most productive haven for their capital. The 'trust gap' mentioned in recent forex news, potentially limiting peace hopes, also contributes to a risk-off sentiment that favors the dollar as a safe-haven asset.
Geopolitical Tensions: The Dollar as a Safe Haven
In times of global uncertainty, the US dollar often acts as a safe-haven currency, and current geopolitical tensions are no exception. News regarding potential escalations in the Middle East or other flashpoints tends to drive capital towards perceived safe assets, with the dollar often being a primary beneficiary. The recent erratic trading in USD/CAD, influenced by geopolitical détente hopes being counteracted by other factors, illustrates how sensitive currency pairs are to these global events. Similarly, USD/CHF's recovery towards 0.7900 amid escalating geopolitical risks highlights the dollar's role as a refuge. While the specific catalysts may shift, the underlying theme of geopolitical risk often translates into dollar strength, especially when it appears to be a more stable option compared to other global currencies or regions.
Correlations and Market Impact: What Does It Mean?
Impact on Gold (XAUUSD) and Silver (XAGUSD)
The DXY's current position near resistance at $99.18 has significant implications for precious metals. A strengthening dollar typically exerts downward pressure on gold and silver, as they become more expensive for holders of other currencies. Currently, XAUUSD is trading at $4419.46, showing a neutral trend on the 1-hour chart but a strong bearish trend on the 4-hour chart with an ADX of 57.57. The daily RSI is in oversold territory at 28.24, suggesting a potential bounce, but a sustained DXY rally could cap gold's upside. Similarly, XAGUSD at $69.98 shows a mixed picture, with a strong bullish trend on the 1-hour chart but a strong bearish trend on the 4-hour chart. If the DXY breaks decisively above $99.56, we could see further pressure on both gold and silver, potentially testing their respective support levels.
Forex Pair Dynamics: EUR/USD, USD/JPY, GBP/USD
The DXY's strength is intrinsically linked to the performance of major forex pairs. EUR/USD, currently at 1.15857, is under pressure, with a strong daily downtrend indicated by an ADX of 35.48. A continued rise in the DXY would likely push EUR/USD towards its support at 1.15184. Conversely, USD/JPY, trading near 158.848, benefits from dollar strength and Yen weakness, with recent news highlighting its upward trajectory. The ADX on the 1D chart is 21.48, indicating a moderate trend. GBP/USD, at 1.33866, shows a bearish daily trend with an ADX of 29.21, suggesting that a stronger dollar would further weigh on the pair, pushing it towards support levels.
Equity Markets: Risk Sentiment and the Dollar
The relationship between the DXY and equity markets, particularly US indices like the S&P 500 and Nasdaq 100, is complex but often inversely correlated. A strengthening dollar can signal risk aversion, leading to sell-offs in equities as investors move to safer assets. The S&P 500, currently at 6585.2, shows a strong daily downtrend (ADX 45.34), while the Nasdaq 100 at 24120.44 also exhibits a bearish daily trend (ADX 39.41). If the DXY continues its ascent, particularly if it breaks above $99.56, it could exacerbate the downward pressure on these indices, potentially triggering further declines. This dynamic highlights the DXY's role as a barometer for global risk sentiment.
The Road Ahead: What to Watch
Upcoming Economic Calendar: Key Catalysts
The coming week is packed with crucial economic data that could significantly influence the DXY's trajectory. All eyes will be on key US inflation reports, such as the Personal Consumption Expenditures (PCE) price index, which is a favored inflation gauge for the Fed. Stronger-than-expected inflation figures would likely reinforce the Fed's hawkish stance, potentially sending the DXY above $99.56. Conversely, any signs of inflation cooling more rapidly than anticipated could lead to a reassessment of Fed policy, potentially causing the dollar to retreat. Additionally, employment data, including Non-Farm Payrolls (NFP), will be critical. A robust jobs report would support the dollar, while a weaker one might prompt speculation about Fed rate cuts, pressuring the DXY. Investors will also be monitoring speeches from Fed officials for any hints about future policy direction.
Potential Scenarios for the DXY
Bearish Scenario: Resistance Holds Firm
40% ProbabilityNeutral Scenario: Consolidation Around Resistance
30% ProbabilityBullish Scenario: Breakout Above Resistance
30% ProbabilityFrequently Asked Questions: DXY Analysis
What happens if DXY breaks decisively above $99.18 resistance?
A sustained move above $99.18, particularly with a strong daily close, would likely target the next resistance at $99.56 and potentially extend towards $100.34. This would signal increased dollar strength, potentially pressuring EUR/USD below 1.1518 and XAUUSD below $4400.
Is the current RSI at 55.7 a buy signal for DXY, given the strong ADX?
The RSI at 55.7 indicates upward momentum, which aligns with the strong daily ADX of 32.74. However, the conflicting Stochastic signal (K
How will upcoming inflation data impact DXY trading around $99.18?
Hotter-than-expected inflation data would likely reinforce a hawkish Fed stance, supporting a DXY rally towards $99.56 and beyond. Cooler data might lead to profit-taking, pushing DXY back towards $98.86 support, as the market reassesses Fed rate cut expectations.
Should traders consider buying DXY at current levels near $99.18 resistance?
Buying directly at resistance carries significant risk. A more prudent approach might involve waiting for a confirmed breakout above $99.18 with follow-through, or a pullback to a key support level like $98.86 for a better risk-reward ratio. Patience is key here.
Track markets in real-time
AI-powered analysis, technical indicators and real-time price data.
Join Our Telegram Channel
Breaking market news, AI analysis and trading signals instantly.
Join Channel