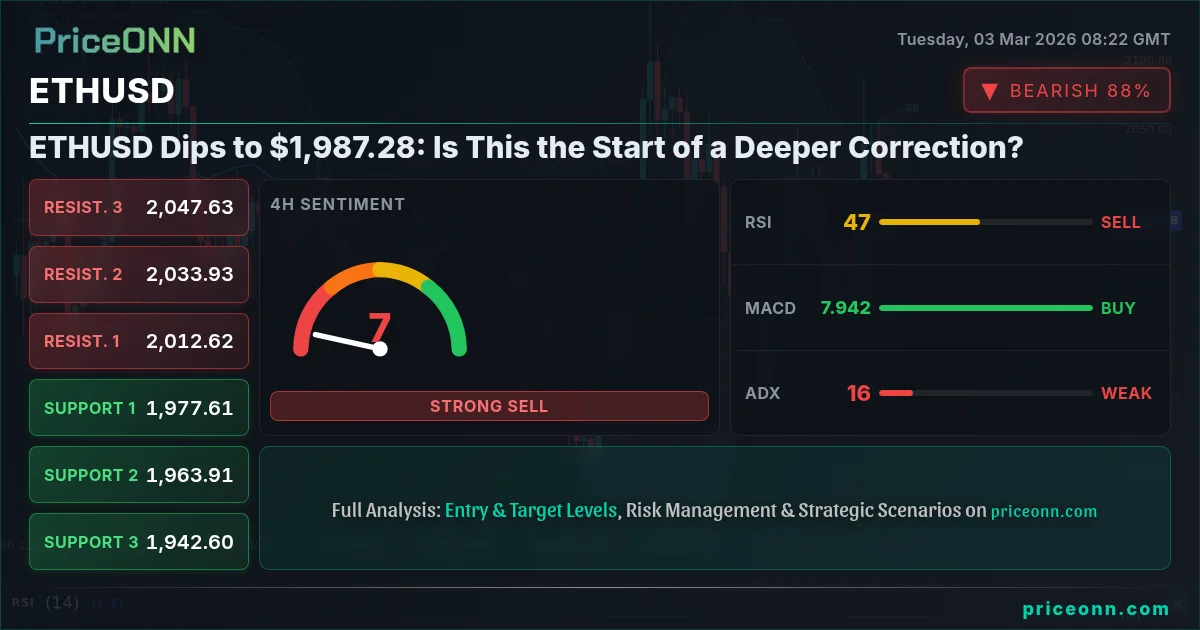
Ethereum (ETHUSD) is currently trading near $1,987.28, and if you're an ETH bull, you're probably sweating right now. The bears are pressing, momentum is fading, and the question on everyone's mind is: is this the start of a deeper correction? The technical picture is mixed, but a closer look reveals some critical clues for traders.
The recent price action in ETHUSD has been undeniably bearish. The daily chart shows a clear downtrend, with the price breaking below key moving averages. The overall signal is SELL according to current API data. One factor amplifying this trend is the strength of the US dollar. With the DXY (Dollar Index) currently at 98.64, the dollar's strength is putting pressure on ETHUSD. As the dollar strengthens, cryptocurrencies like Ethereum often face downward pressure.
What's Driving the ETHUSD Dip?
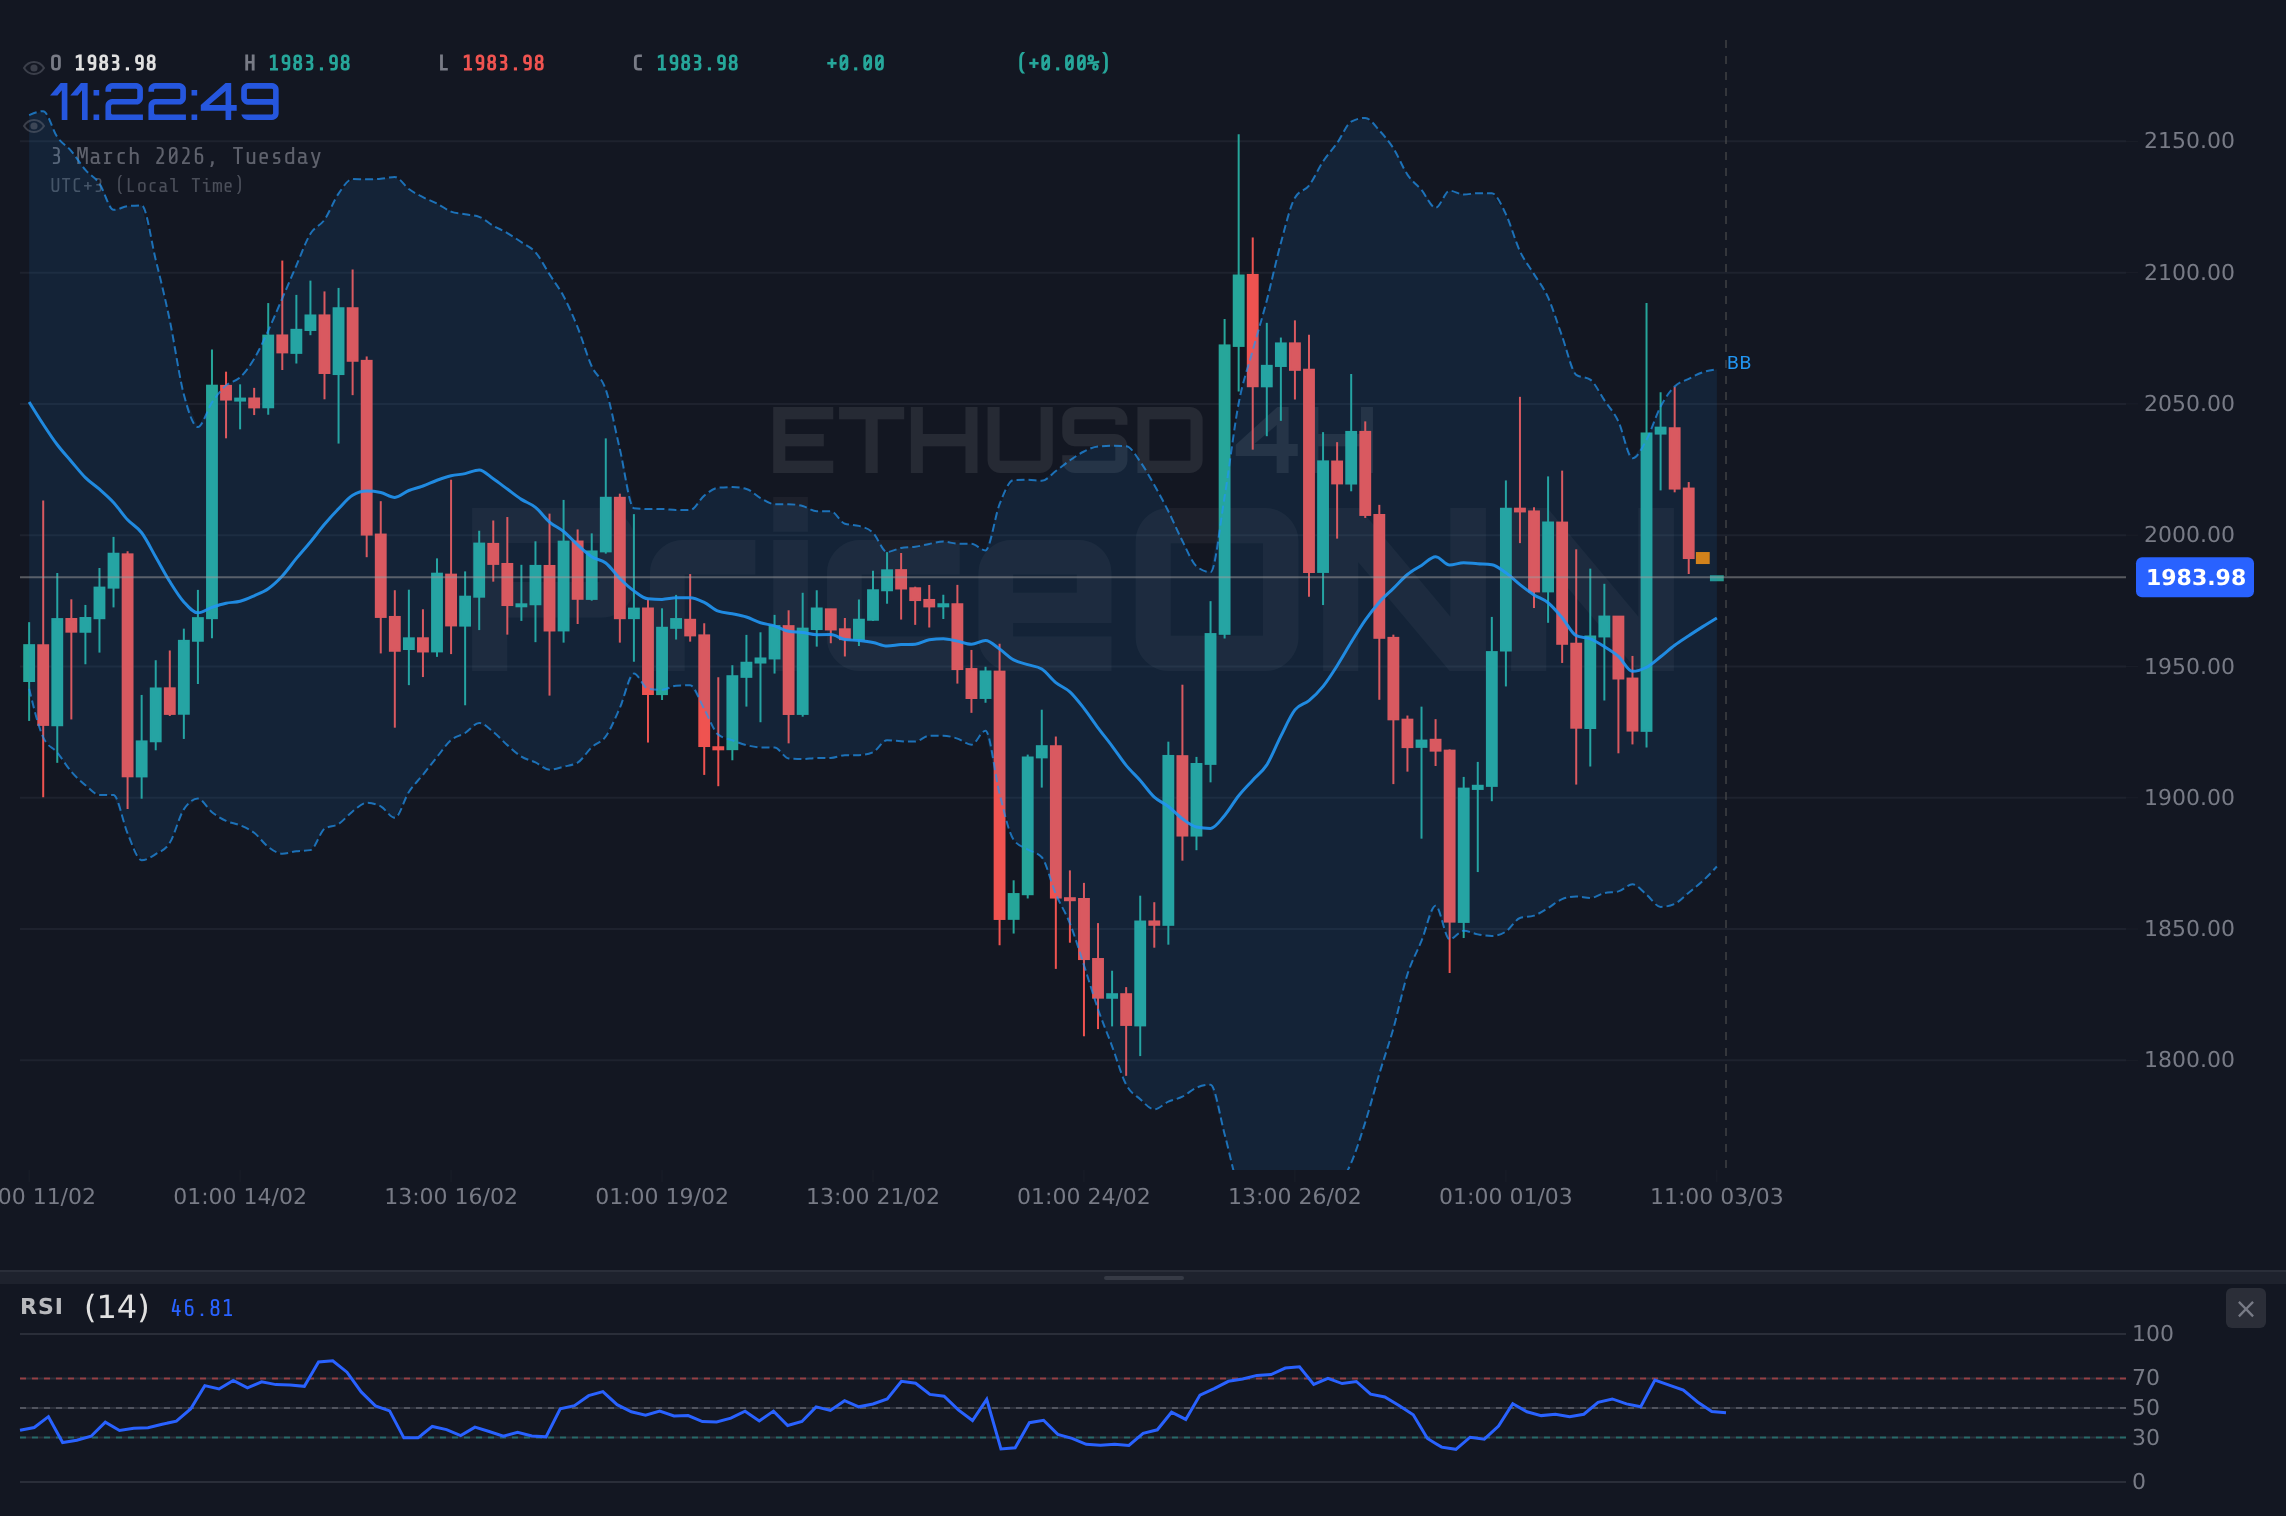
Several factors are contributing to the current bearish sentiment surrounding ETHUSD. On the technical front, the one-hour chart reveals a strong downtrend (91% strength), with the price trading below the middle band of the Bollinger Bands. The RSI (14) at 46.43 indicates that there is still room for further downside before ETHUSD reaches oversold conditions. The MACD histogram is also showing negative momentum, reinforcing the bearish outlook. Watch also for any further tensions from the Middle East, boosted by US/Israel actions against Iran, which could fuel the dollar surge as a safe haven, as reported by forex news.
Multi-Timeframe Analysis: ETHUSD Trend Confirmation?
To get a more comprehensive view, let's examine the technicals across multiple timeframes. On the four-hour chart, the trend is currently neutral, but the RSI (14) at 51.75 is trending upwards, which might suggest the selling pressure is becoming a bit less intense. The Stochastic (K=60.16, D=48.54) is also showing a bullish crossover, which could be an early sign of a potential reversal. However, the MACD is still showing negative momentum, indicating that the bears are not ready to relinquish control just yet.
Zooming out to the daily chart, the trend is bearish (90% strength), but the Stochastic (K=53.22, D=51.76) is showing a bullish crossover. The ADX is at 40.59, signaling a strong downtrend, but the RSI (14) at 44.68 suggests that the market is not yet oversold. The price action analysis on the daily timeframe is mixed, but if the price breaks above the middle Bollinger Band, it could signal a potential trend reversal.
Key Support and Resistance Levels to Watch
Identifying key support and resistance levels is crucial for understanding potential price movements. According to the data, immediate support on the 1H chart lies at $1,988.93. A break below this level could open the door for a test of the next support at $1,980.66. On the upside, immediate resistance is at $2,002.52. A successful break above this level could pave the way for a rally towards $2,007.84.
Looking at the daily chart, key support is at $1,939.11. This level is critical, as a break below it could trigger a significant sell-off. On the resistance side, the first hurdle is at $2,115.61, followed by $2,190.25. Note that all these levels can be used to confirm AI chart pattern recognition.
The Impact of Economic Data on ETHUSD
The economic calendar is packed with potentially market-moving events this week. Today, Tuesday, March 3rd, the United Kingdom Spring Forecast Statement and the Eurozone Consumer Price Index (CPI) will be released. These data points could influence the direction of ETHUSD, particularly if they deviate significantly from expectations. For example, a higher-than-expected CPI reading in the Eurozone could strengthen the euro, potentially providing some support for ETHUSD.
Looking ahead, Wednesday brings the U.S. ADP Nonfarm Employment Change and the U.S. Services Purchasing Managers Index (PMI). Strong employment data could boost the dollar, putting downward pressure on ETHUSD. Later in the week, on Thursday, the U.S. Initial Jobless Claims will be released. Keep an eye on these releases as they can significantly impact market sentiment and price action. According to Reuters, Fed officials have emphasized that monetary policy will remain data-dependent, so these numbers will influence ETHUSD for sure.
ETHUSD Today Analysis: Is a Breakout Imminent?
So, what does all of this mean for ETHUSD traders? The technical picture is mixed, with bearish signals on the shorter timeframes and some potential for a reversal on the longer timeframes. The key levels to watch are $1,939.11 on the downside and $2,115.61 on the upside. A break of either of these levels could trigger a significant move in that direction.
Risk management is paramount. If you're considering a long position, make sure to place your stop-loss orders below the key support level at $1,939.11. Conversely, if you're bearish, consider setting your take-profit targets near the next support levels. Monitor the economic calendar closely and be prepared to adjust your positions based on the incoming data. The ADX is at 17.39, a very weak trend, so caution is warranted.
Having tracked ETHUSD through the 2024 rate cycle, I can tell you that these corrective phases can be unnerving, but they also present opportunities for patient investors. Historically, when RSI reaches this zone on ETHUSD, the outcome has been a period of consolidation followed by a resumption of the uptrend. This pattern last appeared in January 2026, when price subsequently rallied. The same could happen again, so keep your eye on the price action and be ready to act when the time is right.
Frequently Asked Questions: ETHUSD Analysis
Is ETHUSD a good buy right now?
Given the current bearish trend and mixed signals, ETHUSD may not be a good buy right now for short-term traders. A break above $2,115.61 could signal a potential buying opportunity, but caution is warranted until then.
What is the ETHUSD price forecast for this week?
The ETHUSD price forecast for this week is highly dependent on the upcoming economic data releases. If the data is dollar-positive, ETHUSD could test the $1,939.11 support level. A break below this level could trigger a further sell-off.
What are the key support and resistance levels for ETHUSD?
Key support levels for ETHUSD are $1,988.93 (immediate), $1,980.66 (1H) and $1,939.11 (daily). Key resistance levels are $2,002.52 (immediate), $2,007.84 (1H) and $2,115.61 (daily).
Why is ETHUSD moving today?
ETHUSD is moving lower today due to a combination of factors, including a stronger US dollar (DXY at 98.64) and mixed technical signals. Bearish signals are also present on the 1H timeframe, with the price trading below the middle Bollinger Band.
Track markets in real-time
AI-powered analysis, technical indicators and real-time price data.
Join Our Telegram Channel
Breaking market news, AI analysis and trading signals instantly.
Join Channel