ETHUSD Surges 4.58% to $2,180.02; Can the Rally Continue?
ETHUSD is up 4.58%, reaching $2,180.02 amid strong bullish momentum. Is this a buying opportunity or a potential trap?
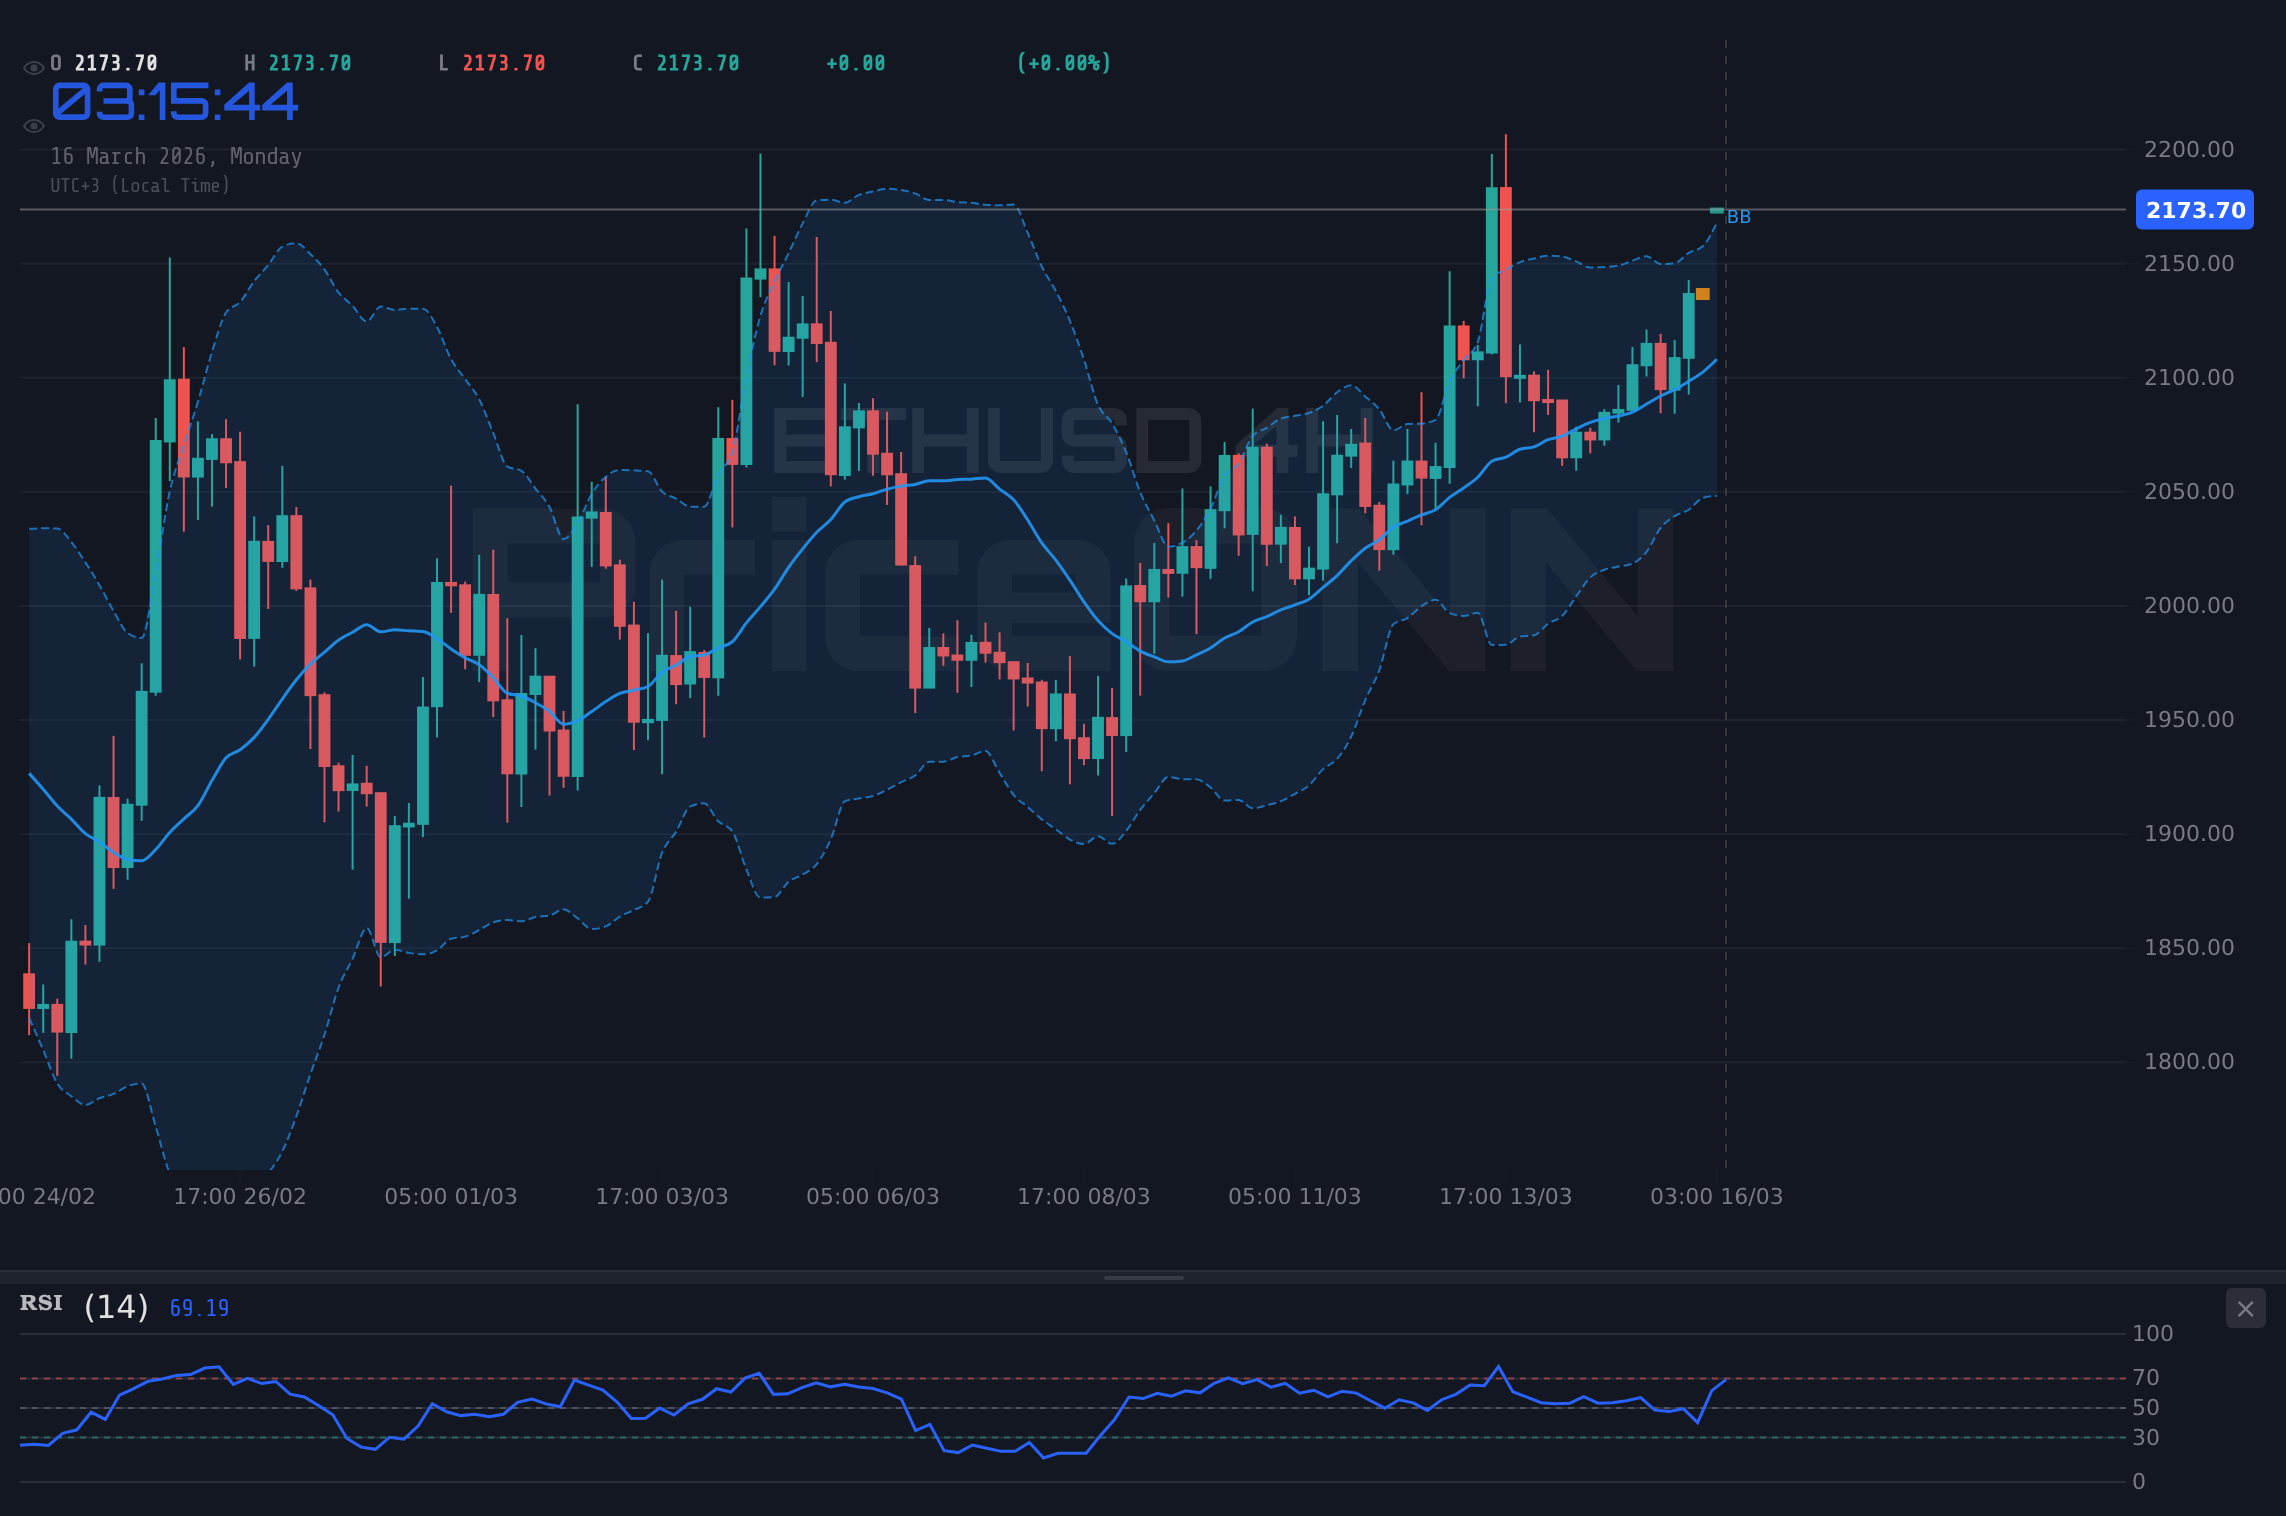
ETHUSD's recent surge to $2,180.02 has captured the attention of traders, raising questions about the sustainability of this bullish trend. The cryptocurrency has experienced a 4.58% increase today, driven by strong momentum, but key technical indicators suggest caution.
- RSI at 75.77 signals overbought conditions, potentially indicating a pullback.
- Immediate resistance lies at $2,207.68; a break above this level could trigger further gains.
- MACD histogram confirms positive momentum, supporting the current uptrend.
- DXY's rise to 99.95 could exert downward pressure on ETHUSD if the trend continues.
Why $2,207.68 is the Level to Watch
The immediate resistance level for ETHUSD sits at $2,207.68. This level represents a critical threshold for the current bullish trend. A sustained break above $2,207.68 could signal further upward momentum, potentially targeting the next resistance levels at $2,232.79 and $2,274.86. However, failure to breach this level could indicate a weakening of the bullish trend, paving the way for a potential retracement. ETHUSD today analysis reveals that the bulls are pushing hard but need to overcome this hurdle to confirm their dominance.
The Bull's Roadmap: Targeting $2,274.86
For the bullish scenario to unfold, ETHUSD needs to maintain its upward trajectory and successfully breach the $2,207.68 resistance. If this occurs, the next target would be $2,232.79, followed by $2,274.86. This bullish move would likely be supported by continued positive sentiment in the broader crypto market and potentially some weakness in the DXY. Key indicators to watch include the RSI, which is currently in overbought territory at 75.77, and the MACD histogram, which is showing positive momentum. However, the strong DXY at 99.95 could limit the upward moment.
Click to expand
Where Bears Take Control: A Retracement to $2,140.50
The bearish scenario would come into play if ETHUSD fails to break above the $2,207.68 resistance. A rejection at this level could trigger a retracement towards the immediate support at $2,140.50. A break below this support could lead to further declines towards $2,098.43 and $2,073.32. This bearish move could be fueled by profit-taking after the recent rally, or a strengthening of the DXY. The Stochastic indicator, with K=87.88 and D=70.22, also supports the view that ETHUSD may be overbought in the short term.
The Waiting Game: Range-Bound Between $2,140.50 and $2,207.68
A neutral scenario could develop if ETHUSD enters a consolidation phase, trading within a range between the $2,140.50 support and the $2,207.68 resistance. This scenario could play out if there is a lack of clear catalysts to drive the price in either direction. In this case, traders may look for range-bound trading opportunities, buying near the support and selling near the resistance. The ADX, currently at 33.67, indicates a strong uptrend, but this could weaken if the price remains range-bound.
Which Scenario is Most Likely?
Considering the current technical picture, the bullish scenario appears to have a slightly higher probability (60%) in the short term. The strong upward momentum, as indicated by the MACD histogram and the overall bullish trend in the 1H timeframe, suggests that ETHUSD may have enough strength to breach the $2,207.68 resistance. However, the overbought RSI and the potential for a DXY rally to exert downward pressure, reduce the conviction. The 4H RSI is only at 66.56, so there is room to run.
Key Triggers to Watch This Week
Several key triggers could influence ETHUSD's price action this week. Firstly, traders should closely monitor the DXY. A sustained rally in the dollar index could weigh on ETHUSD. Secondly, any significant news or developments in the broader crypto market could also impact ETHUSD's price. Finally, the market will be watching economic data. There is a lack of economic data today, Monday March 16th. The market will be watching out for GBP and USD data released on Friday March 13th. Any surprises in these releases could trigger volatility in the market.
Technical Outlook Summary
| Indicator | Value | Signal |
|---|---|---|
| RSI (14) | 75.77 | Overbought |
| MACD Histogram | Positive | Bullish |
| Stochastic | K=87.88, D=70.22 | Overbought |
| ADX | 33.67 | Strong Uptrend |
| Bollinger | Upper Band | Watch |
Key Levels
Support Levels
Resistance Levels
If ETHUSD breaks above the $2,207.68 resistance, it could target $2,232.79 and potentially reach $2,274.86. This scenario would require continued positive momentum and a weakening of the DXY.
If ETHUSD fails to break above $2,207.68, it could retrace towards $2,140.50. A break below this support could lead to further declines towards $2,098.43 and $2,073.32.
Frequently Asked Questions: ETHUSD Analysis
What happens if ETHUSD breaks above $2,207.68 resistance?
If ETHUSD successfully breaks above the $2,207.68 resistance, it would likely target the next resistance levels at $2,232.79 and potentially $2,274.86. This move would be supported by continued positive momentum and a weakening of the DXY.
Should I buy ETHUSD at current levels of $2,180.02 given RSI at 75.77?
While the current uptrend is strong, the RSI at 75.77 indicates overbought conditions, suggesting a potential pullback. A more conservative approach would be to wait for a dip towards the $2,140.50 support before considering a long position.
Is RSI at 75.77 a sell signal for ETHUSD right now?
An RSI reading of 75.77 does indicate overbought conditions, but it's not necessarily a definitive sell signal. It suggests that the bullish momentum may be weakening, and a pullback is possible. Traders should look for further confirmation, such as a break below a key support level, before initiating a short position.
How will the potential GBP and USD Data releases affect ETHUSD this week?
Given that the market is watching out for GBP and USD data released on Friday March 13th, surprises in these releases could trigger volatility in the market. The strong DXY at 99.95, could provide downward pressure on the asset. Traders should monitor the releases.
Track markets in real-time
AI-powered analysis, technical indicators and real-time price data.
Join Our Telegram Channel
Breaking market news, AI analysis and trading signals instantly.
Join Channel