USDJPY Tests $159.72 Resistance as Dollar Strength Persists
USDJPY hovers around $159.72, facing resistance as the Dollar Index (DXY) strengthens. Will the pair break through, or will Yen bulls defend this key level?
The battle between bulls and bears is intensifying around the $159.72 level for USDJPY, as the pair grapples with a strengthening Dollar Index (DXY) and lingering concerns about intervention from the Bank of Japan (BoJ). The outcome of this tug-of-war could dictate the pair's trajectory in the coming week.
- USDJPY is testing resistance at $159.72 amid a strong Dollar Index (DXY) at 100.07.
- RSI at 64.15 on the 1-hour chart suggests upward momentum, though not yet overbought.
- ADX at 22.07 on the 4-hour chart indicates a moderate uptrend, but needs confirmation.
- Upcoming economic data releases and BoJ intervention threats will be key catalysts.
The Bull Case: Dollar Strength and Technical Momentum
The bullish argument for USDJPY rests primarily on the continued strength of the US dollar. The Dollar Index (DXY) currently sits at 100.07, a level not seen in weeks, reflecting strong demand for the greenback amid geopolitical tensions and rising oil prices. As reported by PriceONN Market News, the dollar has been gaining traction as a safe-haven asset, particularly amid concerns about the ongoing conflict in the Middle East. This risk-off sentiment is bolstering the dollar's appeal, putting upward pressure on USDJPY.
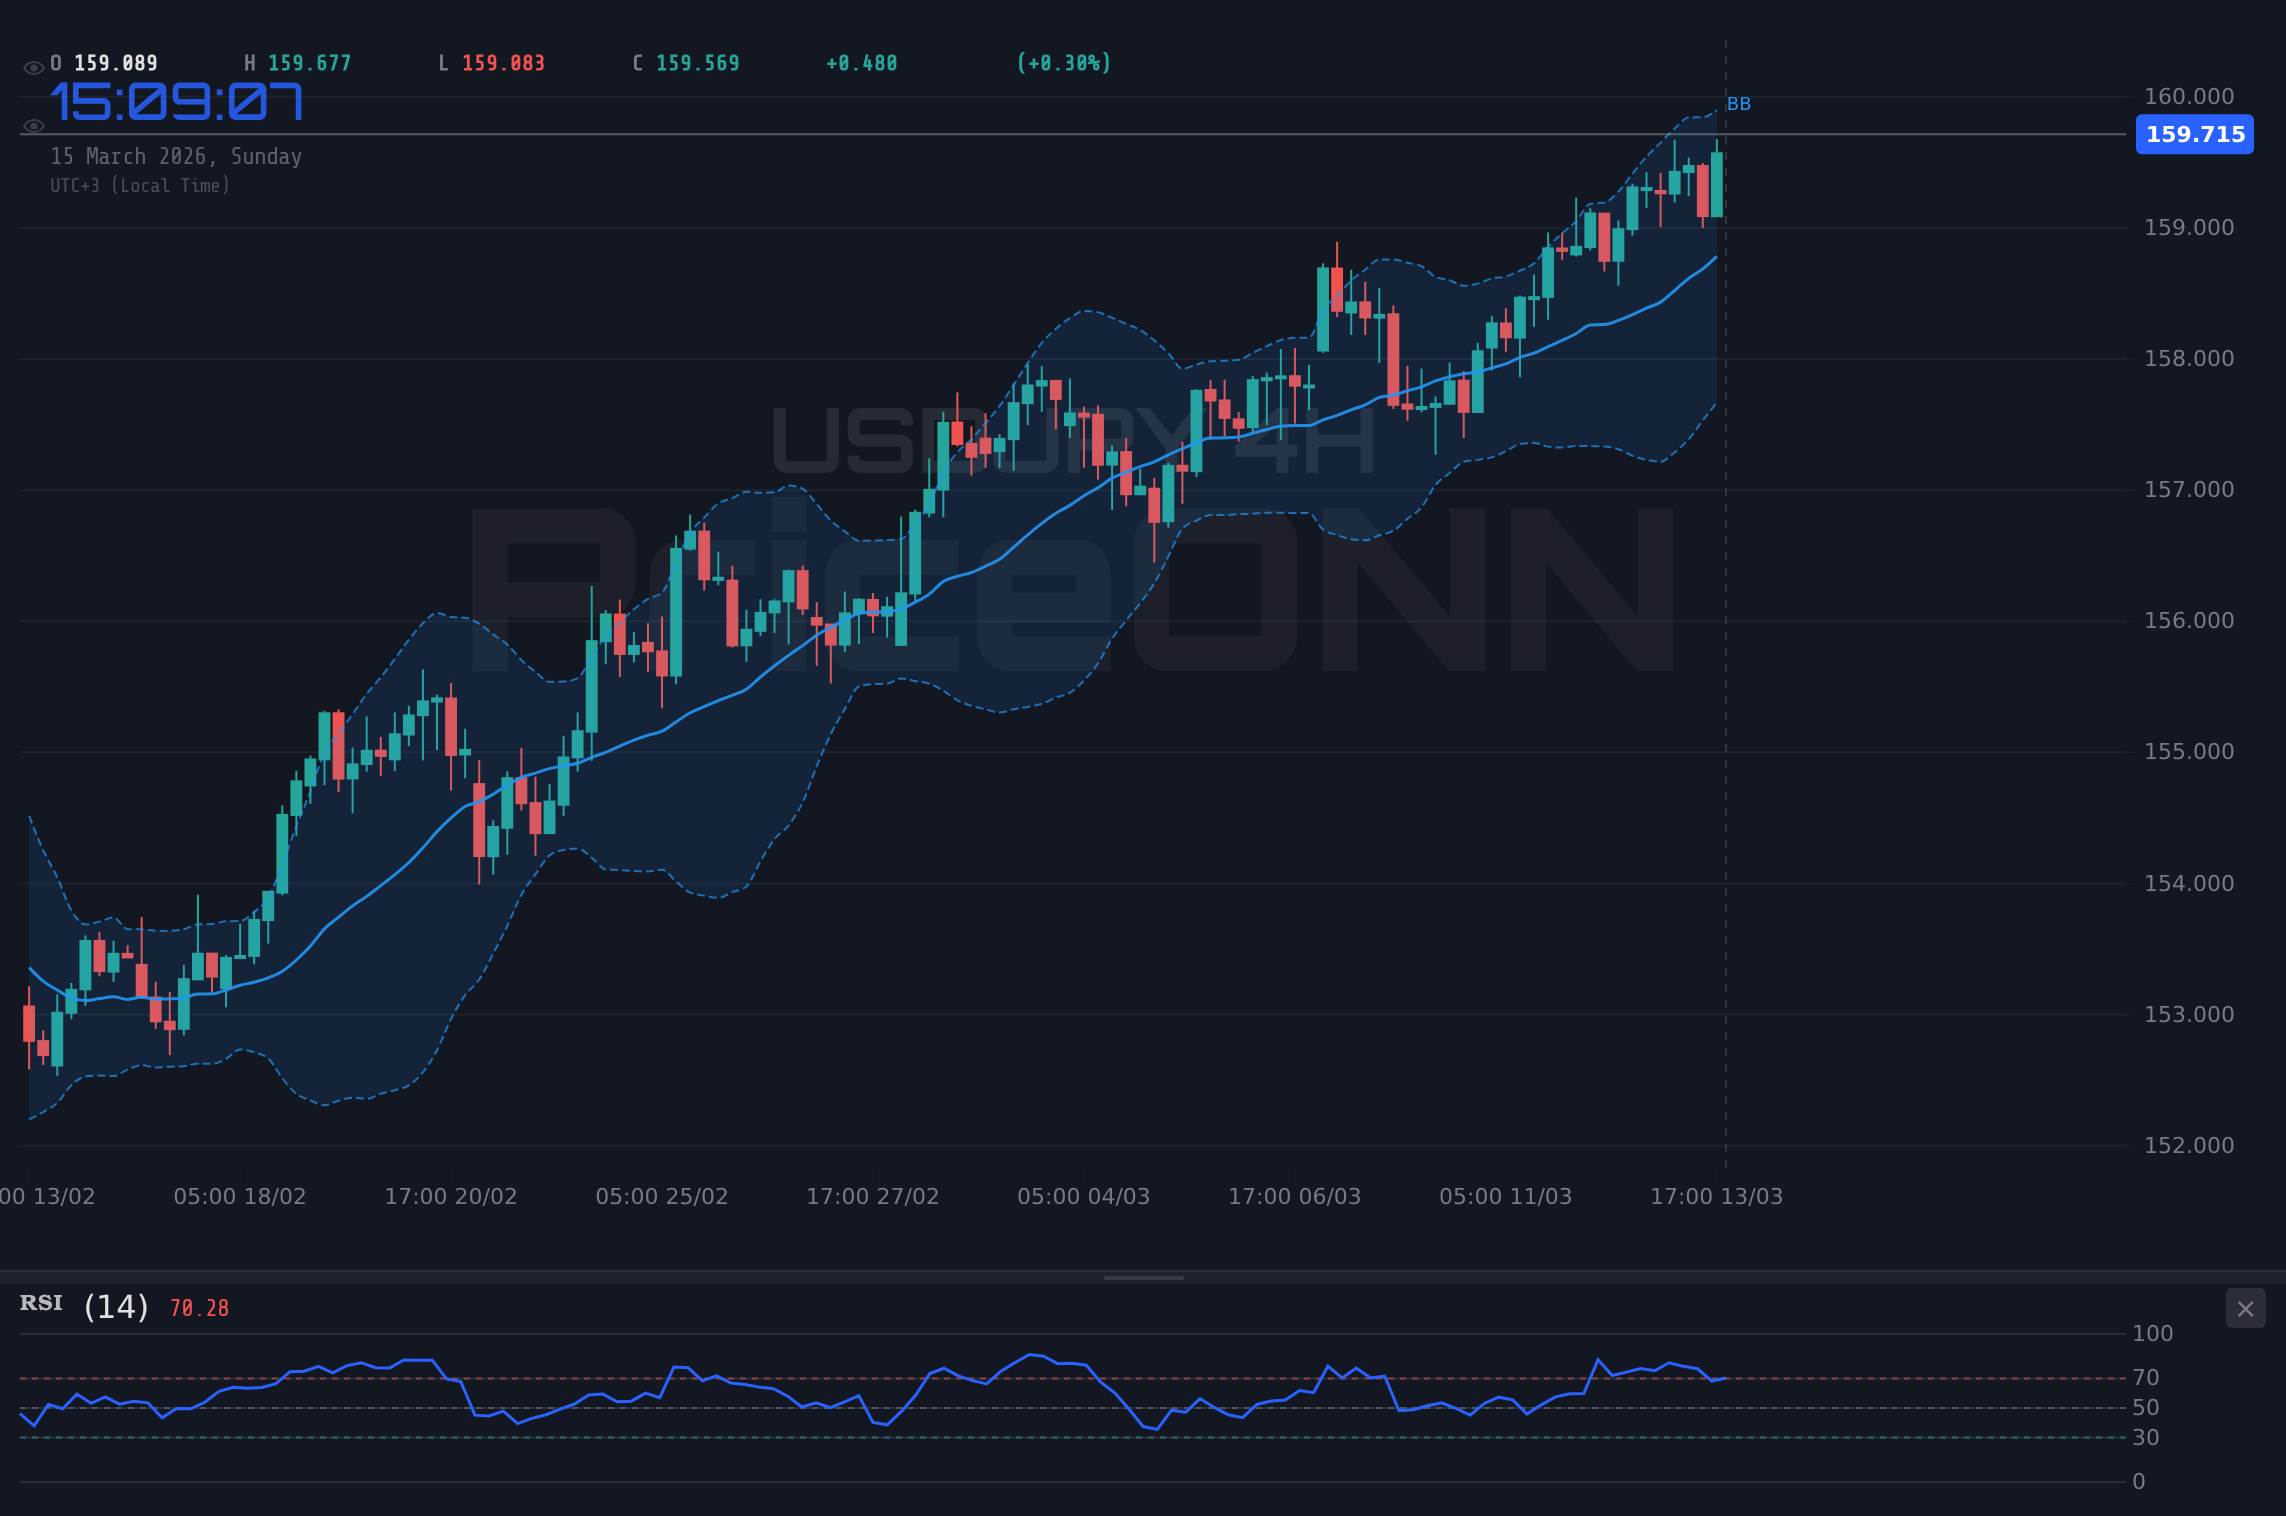
From a technical perspective, the 1-hour chart for USDJPY paints a cautiously optimistic picture. The Relative Strength Index (RSI) sits at 64.15, indicating upward momentum without yet reaching overbought territory. This suggests that there is still room for the rally to continue. The Moving Average Convergence Divergence (MACD) histogram is also positive, further supporting the bullish case. The price action is trading above the middle band of the Bollinger Bands, which also suggests that the pair is in an uptrend. The support levels to watch are 159.568, 159.507 and 159.455. A hold above these levels would confirm the bullish scenario.
Click to expand
On the daily timeframe, the RSI sits at 69.99, not yet signaling overbought conditions. A break above the immediate resistance at 159.633 could pave the way for a test of higher levels, potentially targeting 159.961 and even 160.498. The market sentiment is also leaning bullish, with the general signal on the 1-hour chart indicating a "Buy" with a score of 8/0/0 (Al/Sat/Neutral). The crypto industry may also play a role, as Bitcoin eyes $70,000, and overall risk sentiment could support the bullish case for USDJPY.
Furthermore, the Brent crude oil price is currently trading at $103.42, reflecting a 1.71% daily gain. Rising oil prices tend to fuel inflation expectations, which can lead to a stronger dollar as investors anticipate more hawkish policy from the Federal Reserve. This correlation provides an additional tailwind for USDJPY.
The Bear Case: BoJ Intervention and Overbought Signals
Conversely, the bearish case for USDJPY centers around the threat of intervention from the Bank of Japan (BoJ) and potential overbought conditions. As USDJPY approaches the psychologically significant 160.00 level, the risk of intervention from the BoJ becomes increasingly acute. PriceONN Market News has repeatedly highlighted this risk, noting that the market is keenly awaiting any signs of action from the Japanese central bank.
Technically, while the 1-hour chart appears bullish, the 4-hour and daily charts offer some cause for concern. The Stochastic oscillator on the 4-hour chart shows a potential overbought signal, with %K at 76.52 and %D at 82.2, suggesting that the rally may be losing steam. The Average Directional Index (ADX) on the 1-hour chart sits at a relatively weak 16.26, indicating that the current uptrend lacks significant strength. This is also supported by the Dow Jones 30 index which is currently trending downwards. The price action on the daily chart is testing the upper band of the Bollinger Bands, which can be seen as a point of resistance.
The daily chart also shows that the Stochastic oscillator is in overbought territory, with %K at 97.33 and %D at 85.16. The 1-day RSI is at 27.41 suggesting the market is oversold and could be due for a correction. A break below the immediate support at 158.768 could trigger a deeper pullback, potentially targeting 158.231 and even 157.903. The general signal for USDJPY on the 1-day chart is "Buy" but this is not a strong signal. The fact that the SP500, Nasdaq and DowJones30 are all in a daily downtrend also suggests there is a level of risk aversion in the market, and the bear case should not be ignored.
Furthermore, the recent news of Zimbabwe's lithium export ban, as reported, could impact battery supply chains and potentially lead to concerns about global economic growth. While not directly related to USDJPY, such events can contribute to a risk-off environment, which could indirectly strengthen the Yen.
Technicals as Tiebreaker: A Cautious Bullish Stance
Given the conflicting signals, a balanced approach is warranted. While the fundamental backdrop favors dollar strength, the technical indicators suggest caution. The RSI on the 1-hour chart is 64.15, not yet signaling overbought conditions. However, the Stochastic oscillator on the 4-hour chart is showing a potential overbought signal. The 1-hour ADX is at a relatively weak 16.26, while the 4-hour ADX sits at 22.07, suggesting a moderate uptrend. The 1-day ADX is at 21.00, suggesting a moderate uptrend.
The key levels to watch are the immediate resistance at 159.633 and the immediate support at 158.768. A decisive break above resistance could signal a continuation of the uptrend, while a break below support could trigger a pullback. The daily RSI at 27.41 is in oversold territory, which may be a leading indicator that the market is due for a correction. Traders should also closely monitor the DXY, as further gains in the dollar could put additional pressure on USDJPY.
Trade Plan: Cautious Long with Tight Stops
Given the overall bullish bias, a cautious long position could be considered. However, it's crucial to implement a tight stop-loss to manage the risk of BoJ intervention or a sudden shift in market sentiment.
USDJPY breaks above $159.73, fueled by continued dollar strength and positive risk sentiment. Targets are $159.96 and $160.50. This scenario is contingent on DXY holding above 100.00.
USDJPY fails to hold above $159.57 and drops below $158.77, triggering a pullback towards $158.23 and $157.90. This scenario is more likely if the BoJ signals intervention or risk aversion intensifies.
The following trade plan is presented:
- Entry Trigger: A decisive break above 159.73
- Target 1: 159.96
- Target 2: 160.50
- Stop/Invalidation Level: 159.57
This setup carries an estimated probability of 60% based on the current technical picture. Traders should also be aware that the market may be volatile due to the upcoming economic data releases and the potential for BoJ intervention. Traders should also be aware that jet fuel prices have exploded to $200 a barrel because of the Iran war and this may impact the USDJPY pair.
Risk Management
As mentioned, the primary risk to this trade is the potential for intervention from the Bank of Japan (BoJ). This risk is difficult to quantify but should be factored into any trading decision. Traders should also be aware of the upcoming economic data releases, which could trigger volatility in the market.
Economic Calendar
Friday's [GBP] and [USD] data releases will be closely watched by investors. Any surprises in these releases could trigger significant movement in USDJPY. The previous [USD] was 4.3, [USD] was 0.4, [USD] was 3, [USD] was -1.4 and the [USD] was 6.542.
Frequently Asked Questions: USDJPY Analysis
What happens if USDJPY breaks above $159.73 resistance?
A break above $159.73 resistance could signal a continuation of the uptrend, potentially targeting $159.96 and even $160.50. This scenario is contingent on DXY holding above 100.00 and continued dollar strength.
Should I buy USDJPY at current levels of $159.72 given RSI at 64.15?
With the RSI at 64.15, a cautious long position could be considered, but it's crucial to implement a tight stop-loss to manage the risk of BoJ intervention or a sudden shift in market sentiment. The Stochastic on the 4H chart is near overbought, so caution is warranted.
Is the Stochastic oscillator at 76.52 on the 4H chart a sell signal for USDJPY right now?
The Stochastic oscillator at 76.52 on the 4-hour chart suggests that the rally may be losing steam and that the market may be due for a pullback. However, it's important to consider other factors, such as the overall trend and the fundamental backdrop, before making a trading decision.
How will the upcoming economic data releases affect USDJPY this week?
Friday's [GBP] and [USD] data releases will be closely watched by investors. Any surprises in these releases could trigger significant movement in USDJPY, particularly if they deviate significantly from expectations.
Technical Outlook Summary
| Indicator | Value | Signal |
|---|---|---|
| RSI (14) | 64.15 | Neutral |
| MACD Histogram | Positive | Bullish |
| Stochastic | 76.52 | Bearish |
| ADX | 22.07 | Moderate Trend |
| Bollinger | Upper Band | Watch |
Key Levels
Support Levels
Resistance Levels
Track markets in real-time
Empower your investment decisions with AI-powered analysis, technical indicators and real-time price data.
Join Our Telegram Channel
Get breaking market news, AI analysis and trading signals delivered instantly to your Telegram.
Join Channel