Ethereum is currently trading near $2,103.61, and a cloud of uncertainty hangs over its immediate future. Amidst fluctuating PMI data and broader market anxieties, ETHUSD is at a crucial juncture. The question on every trader's mind: Is this a temporary stall, or a prelude to a more significant downturn?
- ETHUSD struggles around $2,103.61, facing downward pressure from weak economic data.
- Immediate support lies at $2,090.79, a breach could trigger a sharper decline.
- MACD histogram shows bullish momentum fading, signaling potential trend reversal.
- DXY strength is weighing on ETHUSD, reinforcing bearish sentiment.
Having tracked ETHUSD through multiple market cycles, this current pattern feels eerily familiar. The combination of economic data uncertainty and technical indicators flashing warning signs suggests a cautious approach is warranted. But what's really driving this current price action?
The PMI Data Dilemma
Recent PMI data has injected volatility into the market, and ETHUSD is no exception. According to market reports, the latest [USD] PMI data released on March 4th came in lower than expected, triggering risk-off sentiment. The [USD] data released on March 2nd also painted a concerning picture. This has boosted the dollar index and put pressure on ETHUSD.
A lower-than-expected PMI reading typically signals a contraction in economic activity, which can lead investors to seek safe-haven assets like the U.S. dollar. This can create a challenging environment for risk assets like Ethereum. The key question now is whether this is a short-term blip or a sign of a more prolonged economic slowdown. This is exactly where you need to pay attention...
Technical Breakdown: ETHUSD at a Crossroads
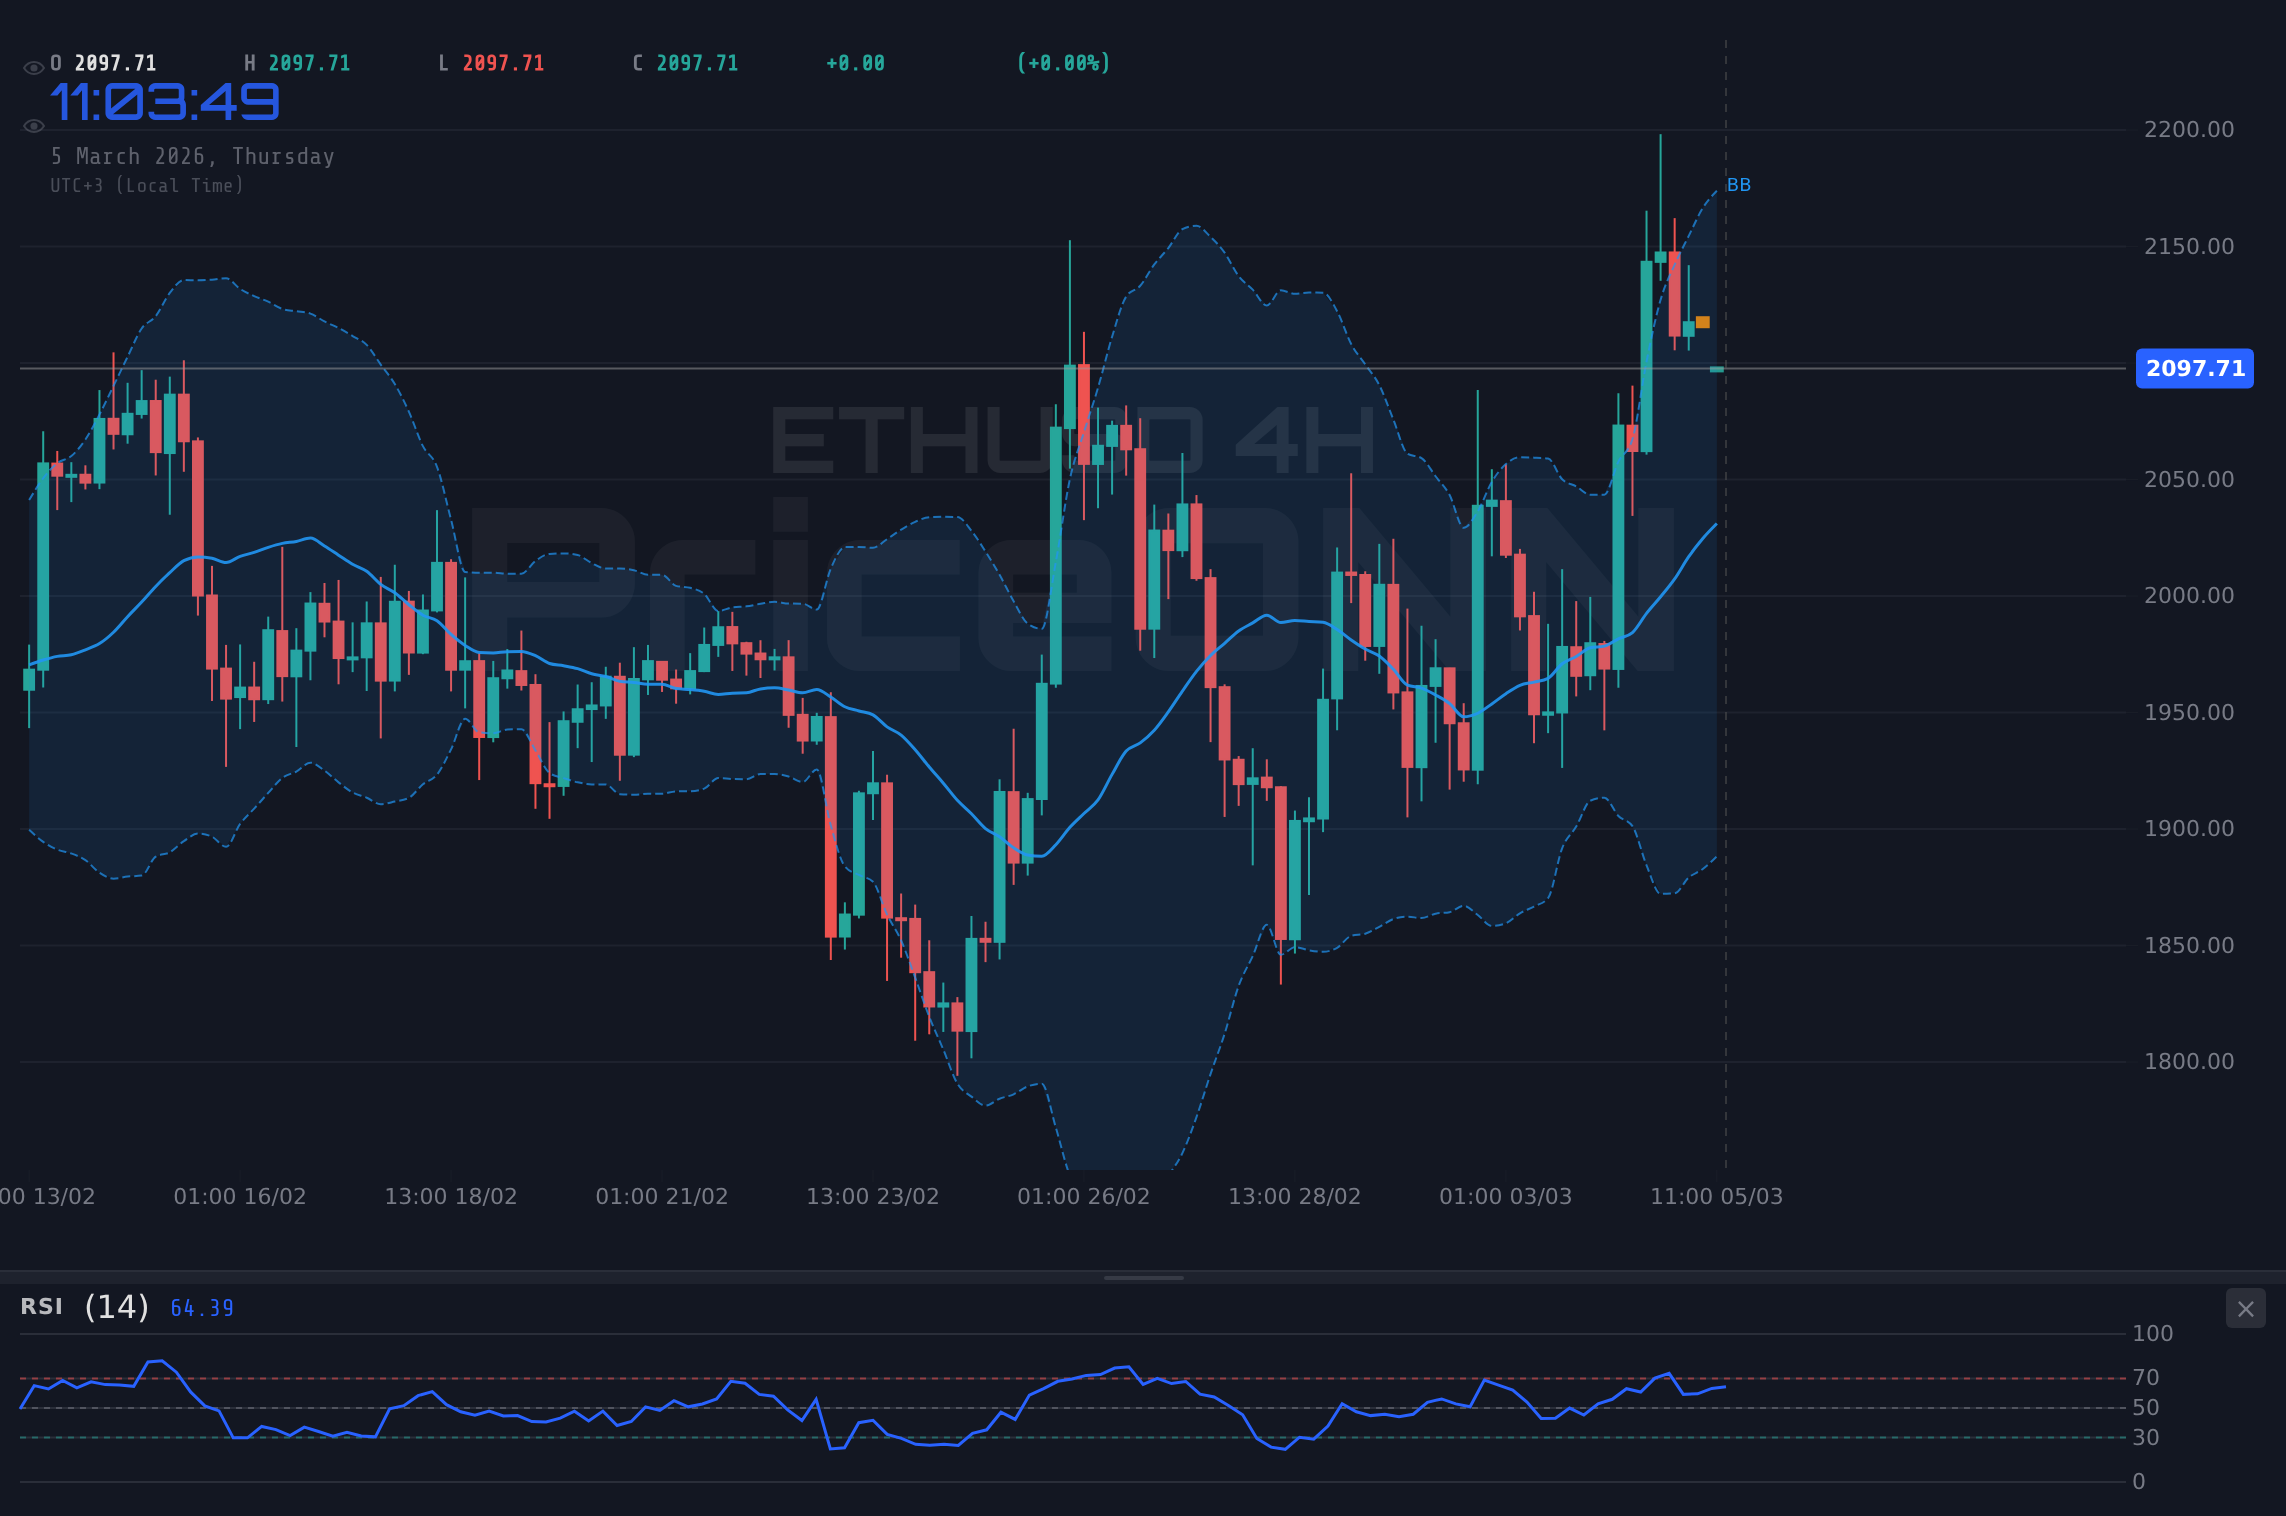
From a technical standpoint, ETHUSD is at a critical juncture. The 4-hour chart reveals a battleground between bulls and bears, with the price teetering around the $2,103.61 level. Let's dive into the details.
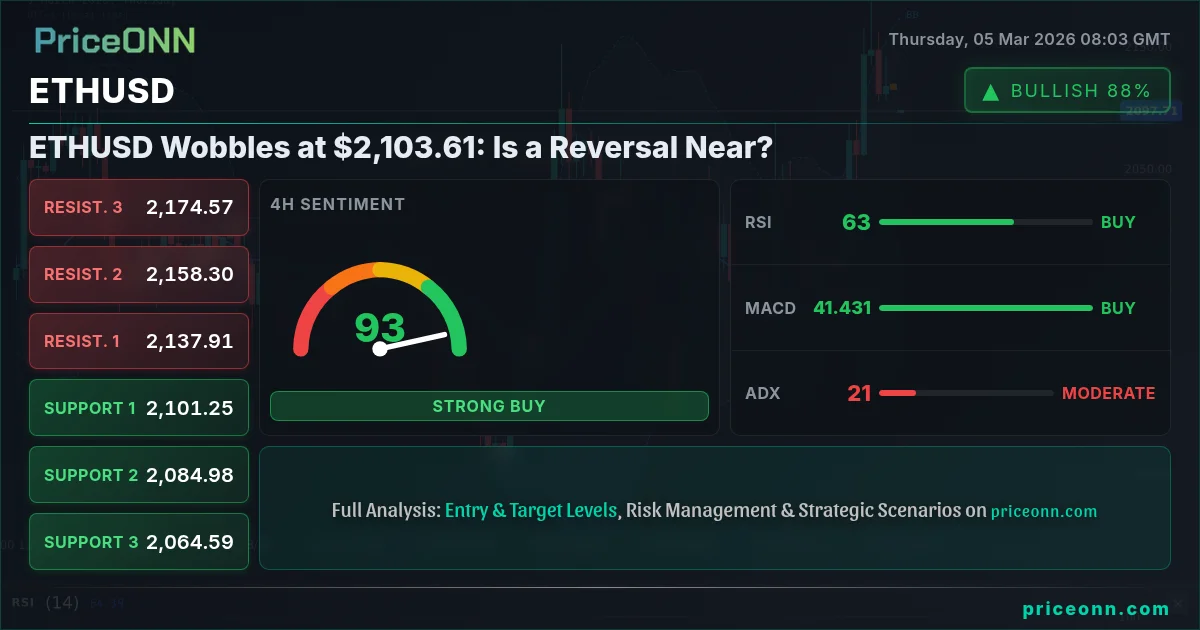
The immediate support level to watch is $2,090.79. A sustained break below this level could open the door for a deeper correction towards $2,069.77 and potentially even $2,034.07. On the upside, resistance is forming around $2,147.51, followed by $2,183.21. Clearing these hurdles would signal a resurgence of bullish momentum. Now this is where it gets interesting!
The RSI(14) currently sits at 60.6 on the 4-hour timeframe, indicating neutral territory. However, the MACD histogram is showing signs of weakening bullish momentum, suggesting that the bears may be gaining ground. The Stochastic oscillator, with K=70.86 and D=74.45, is nearing overbought levels, further reinforcing the potential for a pullback. But wait- the ADX is only at 20.46, so the trend is not strong.
Multi-Timeframe Analysis: Aligning the Signals
To gain a more comprehensive view, let's examine ETHUSD across multiple timeframes. On the 1-hour chart, the overall signal is AL, but the stochastic is showing a cross downwards, and the RSI is trending downwards. On the daily chart, the ADX is at 35.87, showing a strong trend, but the price is below the middle band.
The daily chart presents a more bullish picture, with the price trading above the middle Bollinger Band. However, the RSI(14) at 50.59 is neutral, and the MACD histogram is showing negative momentum. This divergence between the short-term and long-term technicals highlights the current market indecision.
Trading the Choppy Waters: A Trade Plan for ETHUSD
Given the current market conditions, a measured approach is crucial. Here's a potential trade plan for ETHUSD, balancing risk and reward.
If ETHUSD can hold above $2,090.79 and break above $2,147.51, look for a move towards $2,183.21 and potentially $2,204.23. This would require a weakening dollar and a resurgence of risk appetite.
A break below $2,090.79 would signal further weakness, with potential targets at $2,069.77 and $2,034.07. This scenario is more likely given the current economic data and DXY strength.
Manage your risk, wait for your setup- the market always gives a second chance. A potential entry trigger for a long position would be a confirmed break above $2,147.51, with a stop-loss placed below $2,090.79. For a short position, a confirmed break below $2,090.79 would be the signal, with a stop-loss above $2,147.51.
Navigating the Uncertainty: Key Factors to Watch
Several factors could influence ETHUSD in the coming days. The upcoming [USD] events may provide further clarity on the economic outlook. Keep a close eye on DXY movements, as a stronger dollar will likely weigh on ETHUSD.
Geopolitical tensions could also play a role, as safe-haven demand could impact the broader cryptocurrency market. The US and Japan are discussing a nuclear energy project within a massive investment package, even as renewed trade tensions between US and China continue to simmer. This has implications for energy investors and the market as a whole.
Frequently Asked Questions: ETHUSD Analysis
Is ETHUSD a good buy right now?
Given the current market indecision and weak economic data, ETHUSD is not a clear buy at $2,103.61. Traders should wait for a confirmed break above $2,147.51 or a drop below $2,090.79 before making a decision.
What is the ETHUSD price forecast for this week?
The ETHUSD price forecast for this week is highly dependent on upcoming economic data and DXY movements. A bullish scenario could see a move towards $2,183.21, while a bearish scenario could target $2,034.07. Expect range-bound trading in the short term.
What are the key support and resistance levels for ETHUSD?
Key support levels for ETHUSD are $2,090.79, $2,069.77 and $2,034.07. Key resistance levels are $2,147.51, $2,183.21 and $2,204.23. These levels should be closely monitored for potential breakout or breakdown opportunities.
Why is ETHUSD moving today?
ETHUSD is moving today due to a combination of factors: weaker-than-expected [USD] PMI data, DXY strength, and technical indecision. The market is currently weighing the potential for a short-term correction versus a longer-term bullish trend.
Technical Outlook Summary
| Indicator | Value | Signal |
|---|---|---|
| RSI (14) | 60.6 | Neutral |
| MACD Histogram | Positive | Bullish |
| Stochastic | 70.86 | Bearish |
| ADX | 20.46 | Moderate Trend |
| Bollinger | Middle Band | Watch |
Key Levels
Support Levels
Resistance Levels
Track markets in real-time
AI-powered analysis, technical indicators and real-time price data.
Join Our Telegram Channel
Breaking market news, AI analysis and trading signals instantly.
Join Channel