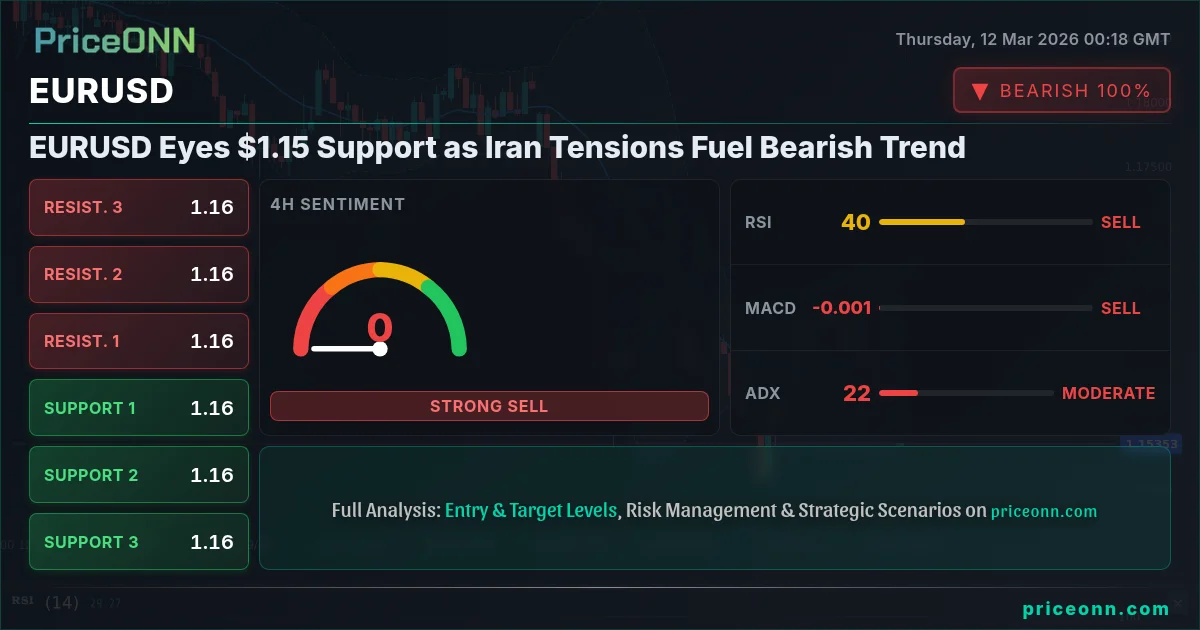
EURUSD is under pressure, currently trading around $1.15, as geopolitical tensions in the Middle East and a strengthening dollar weigh on the pair. The battle between bulls and bears is intensifying around this key support level, with technical indicators suggesting further downside potential.
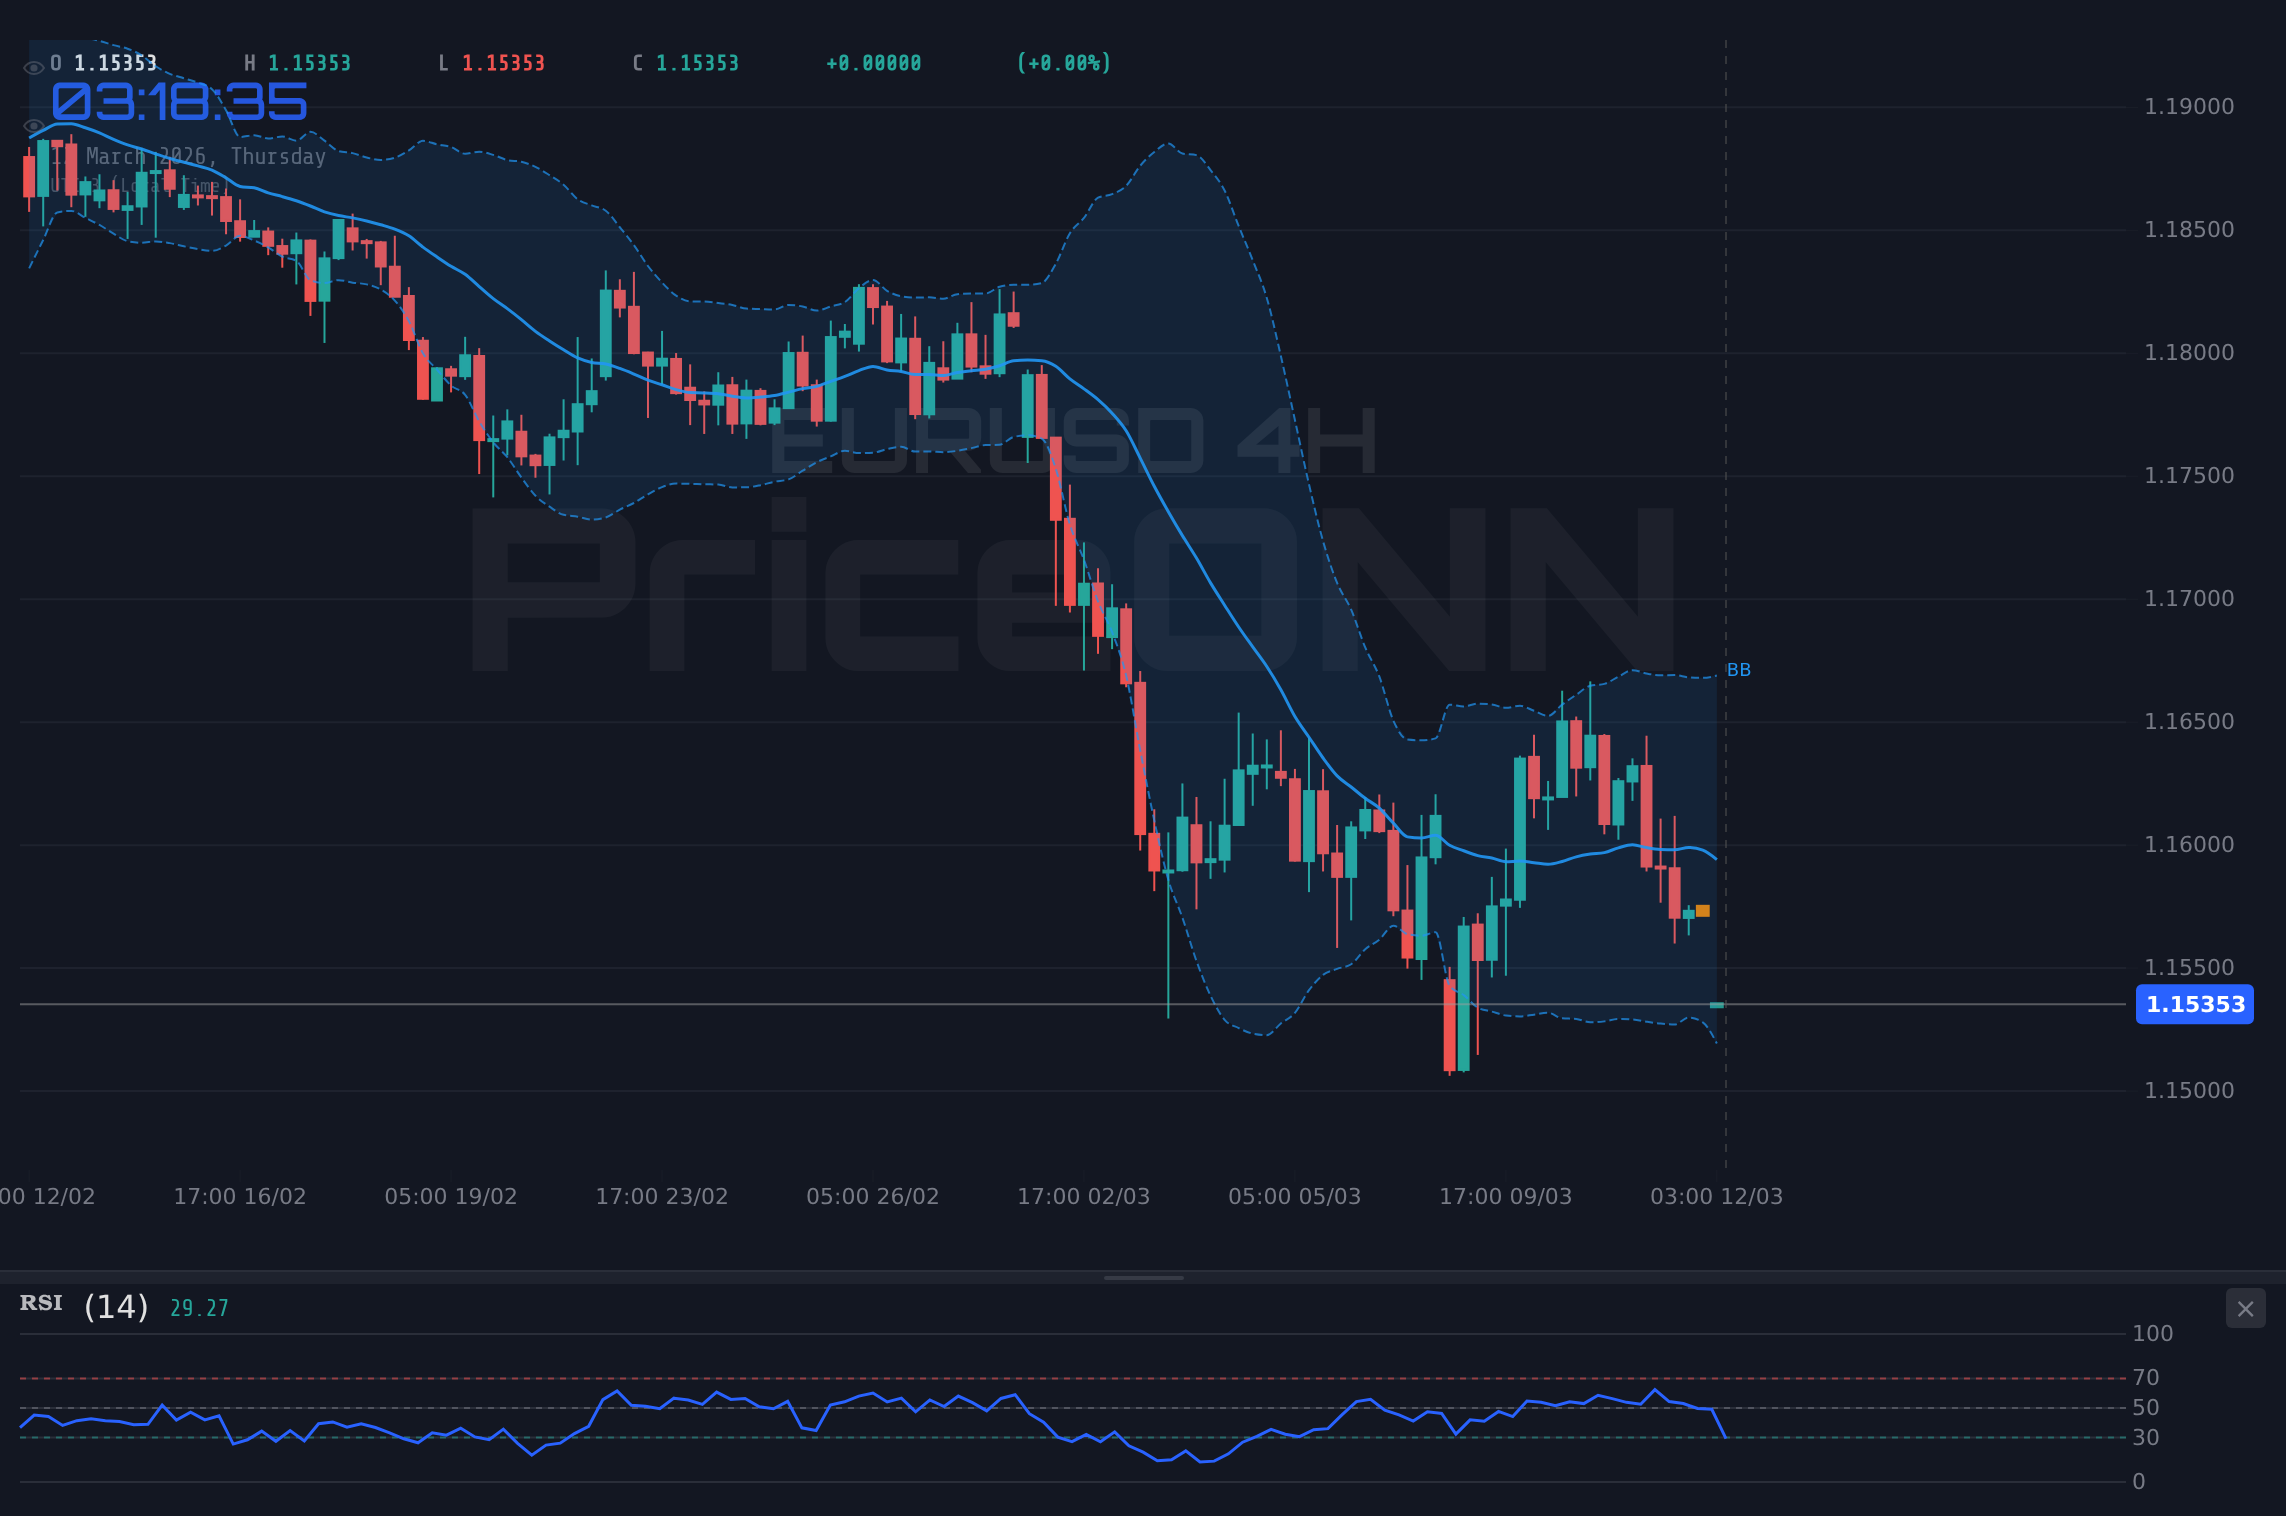
- RSI at 29.45 signals oversold conditions, but the downtrend remains strong.
- Critical support level at 1.15409, a break below could trigger further declines.
- MACD histogram is negative, indicating sustained bearish momentum.
- DXY strength, driven by safe-haven demand, is exacerbating EURUSD's weakness.
Why $1.15 is the Line in the Sand
For EURUSD, the $1.15 level is more than just a price point - it's a critical psychological and technical support. Having tracked EURUSD through multiple rate cycles, breaks below this key level have historically led to accelerated selling pressure. The pair's inability to sustain rallies above $1.16 in recent sessions underscores the dominance of bearish sentiment.
The Bull Case: Is a Reversal Possible?
Despite the prevailing bearish trend, there are arguments to be made for a potential bullish reversal. The most compelling is the oversold condition indicated by the 1-hour RSI reading of 29.45. This suggests that the pair may be due for a short-term bounce as sellers begin to take profits. The Stochastic oscillator, with K=11.29 and D=17.12 in the oversold region, supports this view. However, a sustained recovery would require a significant shift in market sentiment and a weakening of the dollar.
Another factor supporting a potential bullish scenario is the daily Stochastic oscillator, showing a bullish crossover with %K at 30.95 and %D at 29.28. This suggests that the downside momentum may be waning on the daily timeframe. However, the overall trend remains bearish, and any rallies are likely to be capped by strong resistance levels.
The Bear Case: Iran Tensions and Dollar Strength
The bearish case for EURUSD is primarily driven by two factors: escalating geopolitical tensions involving Iran and the resulting strength of the US dollar. As reported by several news outlets, concerns about Eurozone stability are rising. The DXY, currently at 99.26 and in a strong uptrend, is putting significant pressure on EURUSD. Historically, when the DXY strengthens, EURUSD tends to weaken, and the current situation is no exception.
Furthermore, the daily ADX reading of 29.03 confirms the strength of the downtrend. The MACD histogram is negative, indicating sustained bearish momentum. These technical indicators, combined with the fundamental drivers, suggest that the path of least resistance for EURUSD is to the downside.
Technical Showdown: Bulls vs Bears at Key Levels
The technical picture for EURUSD is complex, with conflicting signals across different timeframes. On the 1-hour chart, the pair is trading below the middle Bollinger Band, indicating a bearish trend. The 4-hour RSI of 43.3 is in neutral territory but trending downwards, suggesting further downside potential. The 1-hour ADX of 24.18 confirms the moderate strength of the downtrend.
However, on the 4-hour chart, the Stochastic oscillator shows a bearish crossover with %K at 12.7 and %D at 36.79, signaling further downside potential. The daily RSI of 32.71 is in neutral territory but trending downwards, suggesting that the bears remain in control. The daily ADX of 29.03 confirms the strength of the downtrend on the daily timeframe.
Having tracked EURUSD through the 2024 rate cycle, such conflicting signals often lead to choppy price action and increased volatility. Traders should exercise caution and wait for clear confirmation before entering any positions.
EURUSD Trade Plan: Riding the Bearish Wave
Given the prevailing bearish sentiment and technical indicators, a short trade setup for EURUSD appears to be the most prudent approach. However, it is essential to manage risk carefully and wait for a clear entry trigger before initiating any positions.
A break below the immediate support at 1.15409 could trigger a sharp sell-off towards the next support level at 1.15325, followed by 1.15163. This scenario is supported by the negative MACD histogram and the strength of the dollar.
A sustained rally above the initial resistance at 1.15655 could lead to a test of the next resistance level at 1.15817, followed by 1.15901. This scenario is contingent on a weakening of the dollar and a positive shift in market sentiment.
EURUSD and Macroeconomic Factors in March 2026
The EURUSD pair's movements are intricately linked to macroeconomic factors, particularly in March 2026. US Inflation Watch: CPI data is expected to hold steady, putting pressure on the Fed. Traders should watch for USD volatility around these releases. The pair is navigating a complex landscape as ECB officials express concerns over persistent inflation, particularly in the service sector.
The combination of geopolitical risks, central bank policies, and macroeconomic data creates a challenging environment for EURUSD traders. A disciplined approach to risk management and a focus on key technical levels will be crucial for navigating these turbulent waters.
Frequently Asked Questions: EURUSD Analysis
What happens if EURUSD breaks below 1.15409 support?
A break below the 1.15409 support level could trigger a sharp sell-off, potentially pushing EURUSD towards the next support at 1.15325 and then 1.15163, as bears look to exploit further weakness.
Should I short EURUSD at current levels of $1.15 given the RSI?
While the RSI at 29.45 indicates oversold conditions, the overall downtrend remains strong. A short position could be considered, but only with a tight stop-loss above 1.15655 to manage risk effectively.
Is the negative MACD histogram a reliable sell signal for EURUSD?
The negative MACD histogram confirms the bearish momentum, suggesting that the downtrend is likely to continue. However, traders should also consider other indicators and price action before making any trading decisions.
How will the upcoming US data affect EURUSD this week?
Upcoming US data releases, particularly the inflation data on Friday, could significantly impact EURUSD. A stronger-than-expected inflation reading could further strengthen the dollar and push EURUSD lower, while a weaker-than-expected reading could trigger a short-term bounce.
Technical Outlook Summary
| Indicator | Value | Signal |
|---|---|---|
| RSI (14) | 29.45 | Oversold |
| MACD Histogram | Negative | Bearish |
| Stochastic | 11.29/17.12 | Oversold |
| ADX | 24.18 | Moderate Trend |
| Bollinger | Lower Band | Watch |
Key Levels
Support Levels
Resistance Levels
Track markets in real-time
AI-powered analysis, technical indicators and real-time price data.
Join Our Telegram Channel
Breaking market news, AI analysis and trading signals instantly.
Join Channel