EURUSD is currently trading at $1.1542, inching closer to a critical resistance zone. The pair has shown a steady upward bias, but a confluence of technical indicators and macroeconomic factors suggests a pivotal moment is approaching. This EURUSD today analysis delves into the intricate dance between the Euro and the US Dollar, examining the key levels, indicators, and broader market forces shaping its trajectory.
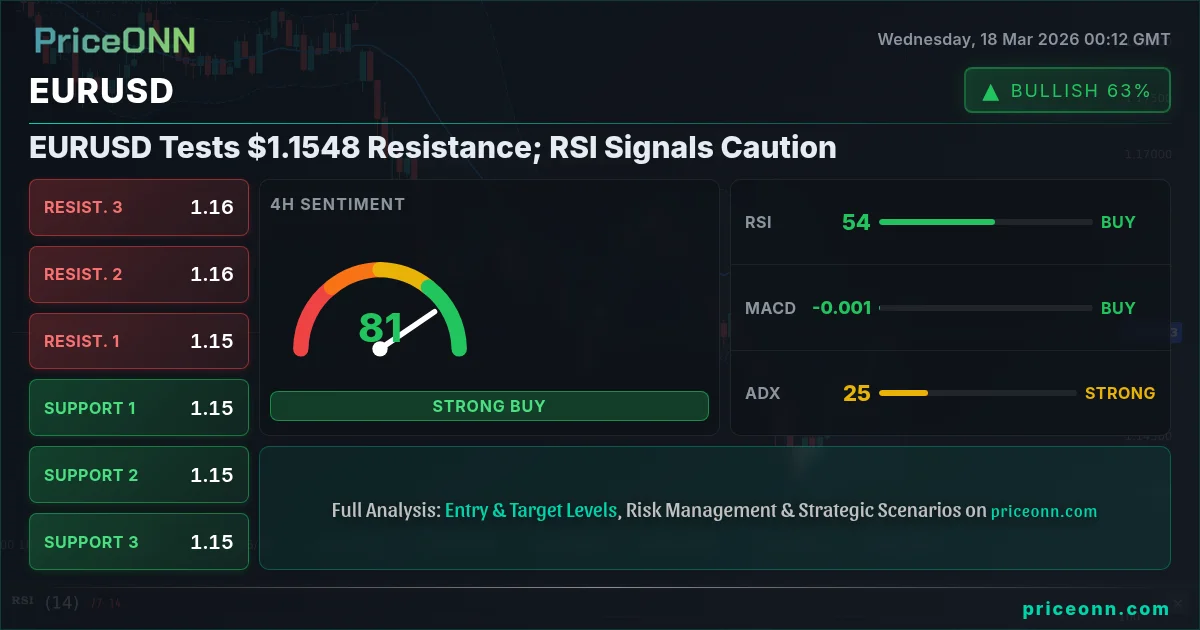
- EURUSD is trading at $1.1542, approaching resistance at $1.1548.
- RSI(14) at 63.39 indicates a bullish trend but nearing overbought territory on the 1H chart.
- ADX at 29.34 on the 1H chart suggests a strong uptrend, but 4H ADX at 25.05 and 1D ADX at 36.18 show mixed trend strength.
- The US Dollar Index (DXY) is consolidating near 99.29, potentially capping EURUSD gains.
- Key support levels for EURUSD are identified at $1.15349 and $1.15245.
The Bull's Roadmap: Navigating Towards $1.1568
The immediate technical picture for EURUSD on the 1-hour chart paints a moderately bullish canvas. With the price currently at $1.1542, bulls are indeed pushing the pair higher, aiming to conquer the immediate resistance found at $1.1548. The ADX reading of 29.34 on this timeframe signifies a relatively strong uptrend, suggesting that momentum is behind the current move. Furthermore, the Stochastic Oscillator is showing a bullish signal, with the %K line at 68.05 crossing above the %D line at 75.41, although this is approaching overbought territory. The RSI(14) at 63.39 also supports an upward bias, indicating that buyers are active, though it's not yet in extreme overbought conditions. This suggests that if the bullish momentum can be sustained, the next logical resistance target could be around $1.15517, followed by a more significant level at $1.15681. The strength of the uptrend on this shorter timeframe is compelling, offering a clear path for traders looking to capitalize on continued upside.
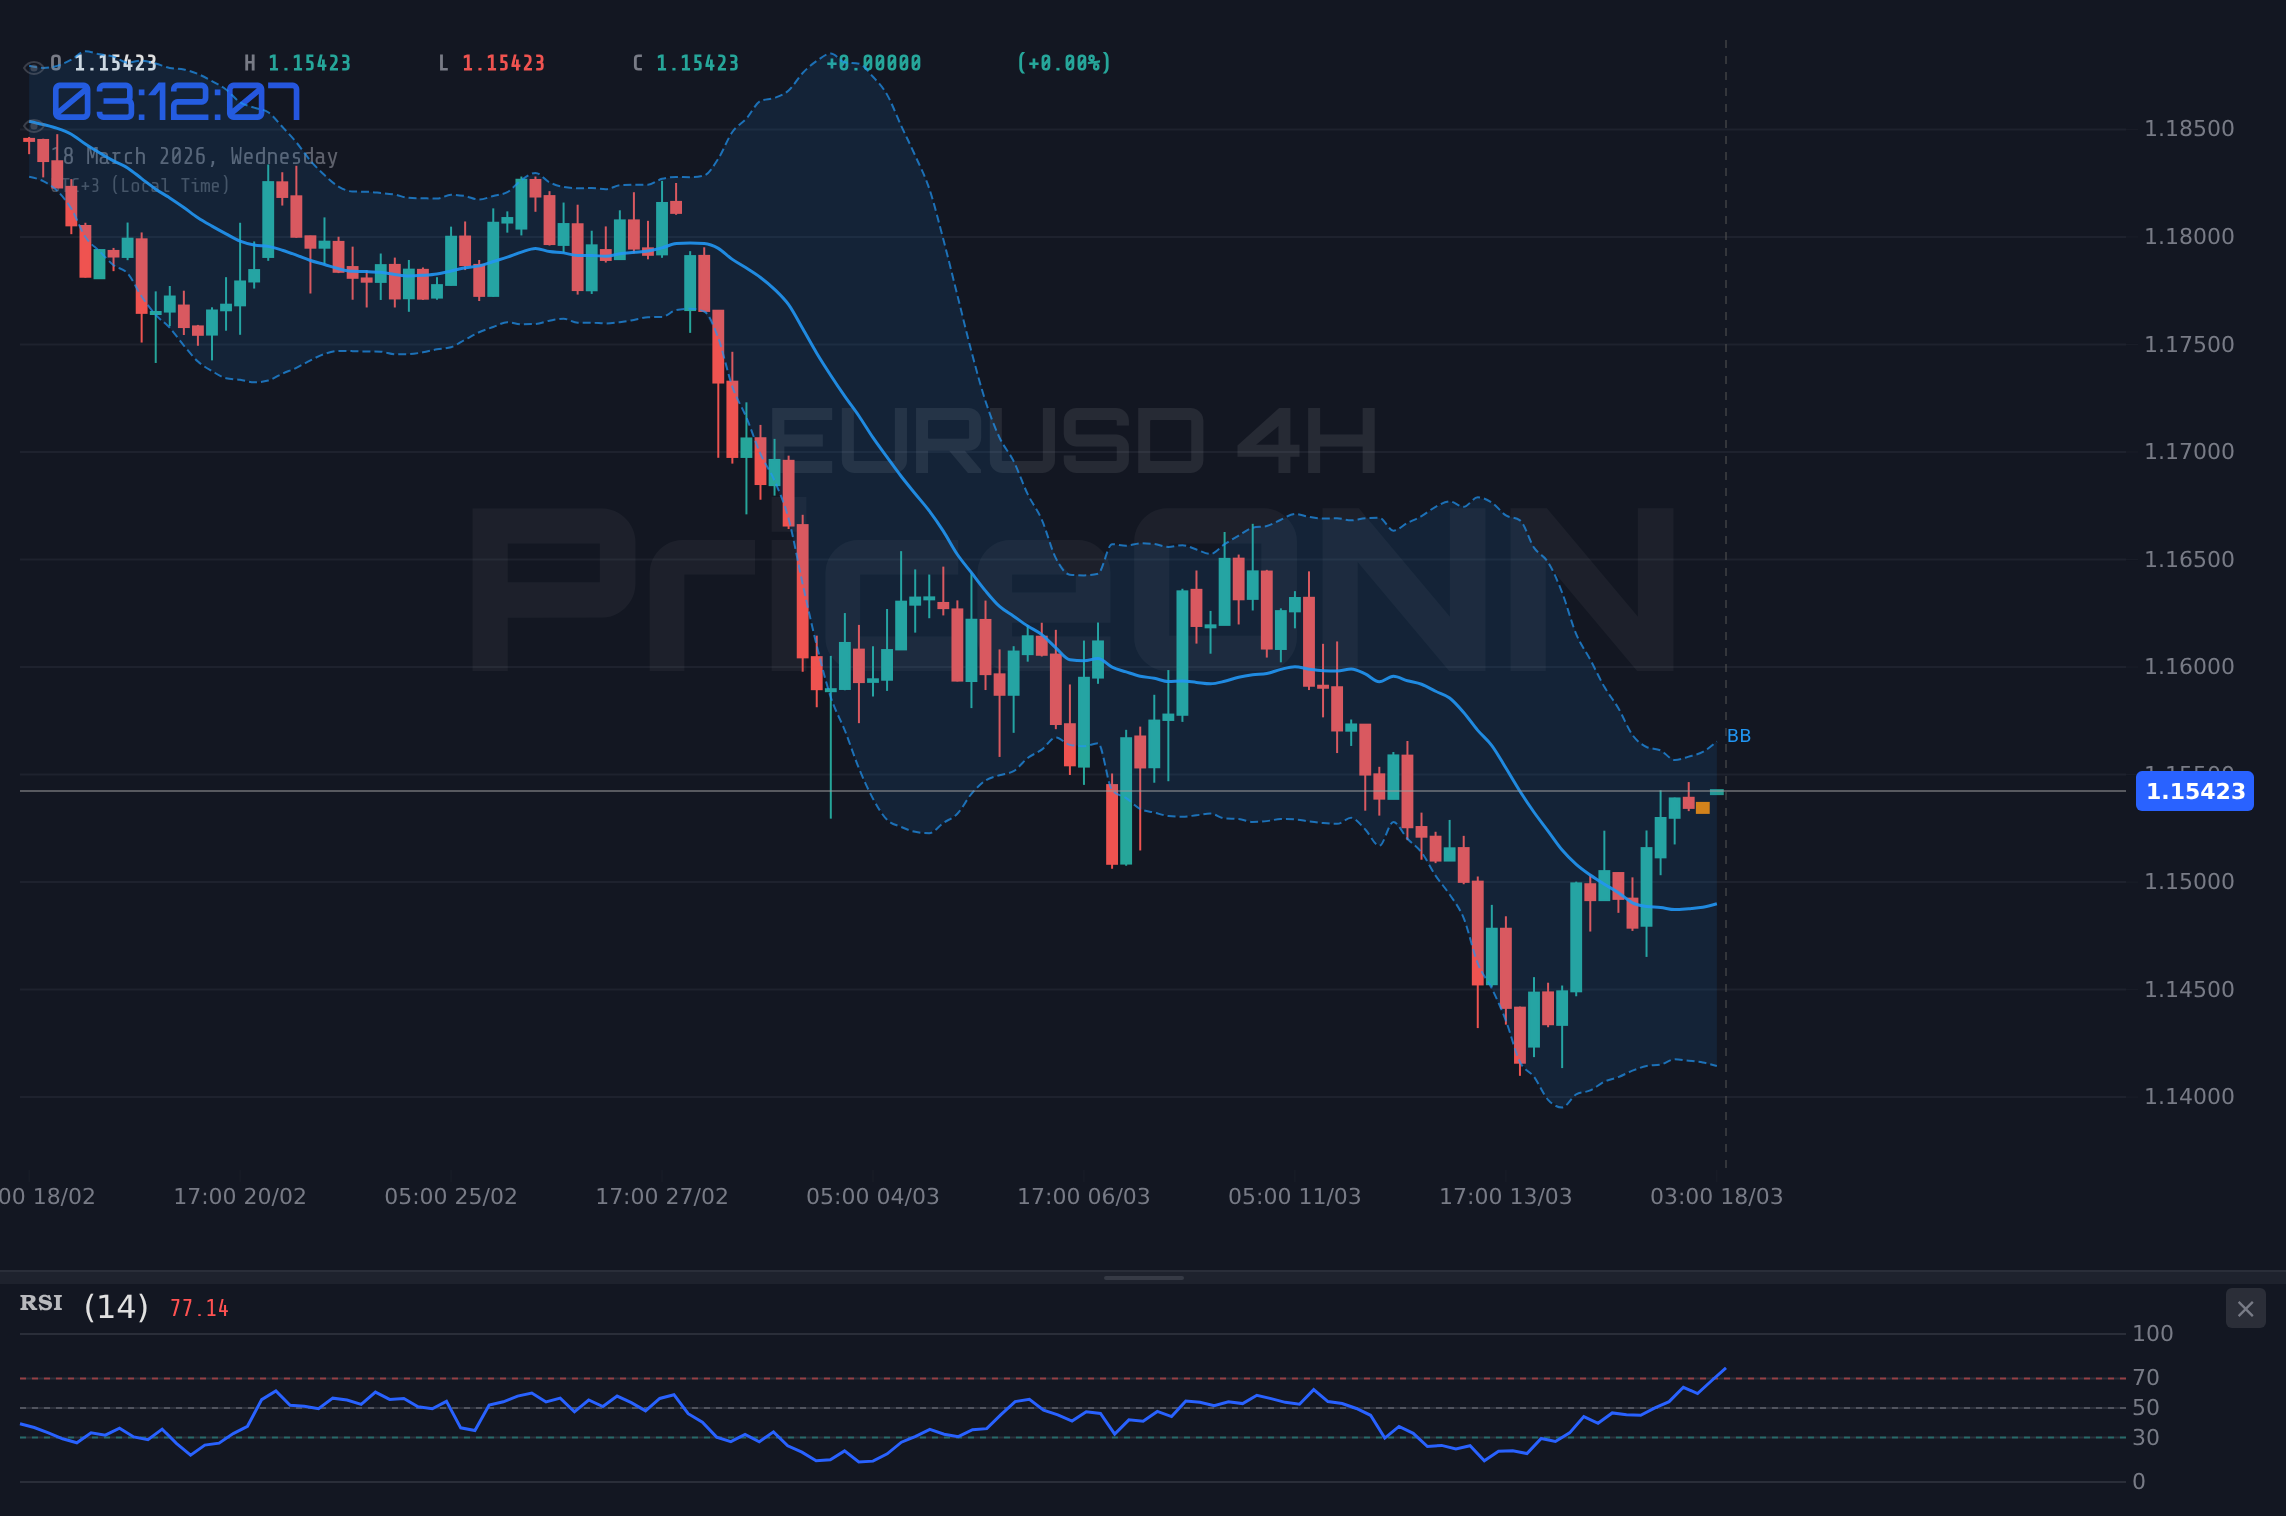
However, this optimistic outlook is tempered when we drill down to the 4-hour and daily charts. The 4-hour chart presents a more neutral stance, with the ADX at 25.05 indicating a trend of moderate strength. While the MACD is showing positive momentum and the Stochastic is in overbought territory (K=91.68, D=82.36), the RSI at 54.43 is less enthusiastic, suggesting a more balanced market sentiment. The Bollinger Bands are also situated above the middle band, aligning with the bullish inclination, but the stochastic signal crossing down from extreme levels warrants caution. On the daily timeframe, the picture becomes decidedly more bearish, with an ADX of 36.18 pointing to a strong downtrend. The MACD shows negative momentum, and the RSI at 38.24 is firmly in neutral-to-bearish territory, indicating a lack of conviction from buyers. This divergence across timeframes is crucial; it highlights that while intraday momentum might favor the bulls, the longer-term trend is still under pressure. The key to sustaining any upward move will be breaking decisively above the $1.1548 resistance and holding there, which would then bring into focus the psychological 1.16000 level.
The EURUSD macroeconomic factors play a significant role in this multi-timeframe analysis. Recent news indicates that the US Dollar Index (DXY) is consolidating near 99.29, showing a slight bearish bias on the 1H and 4H charts, which typically supports EURUSD. However, the DXY's daily chart shows a strong bullish trend, implying that any sustained dollar weakness might be temporary. This dynamic creates a complex environment where currency pair movements can be heavily influenced by the slightest shift in risk sentiment or central bank rhetoric. The Reserve Bank of Australia's narrow rate hike decision last week, while not directly impacting EURUSD, signals a global trend of central banks navigating inflation carefully, creating uncertainty that often favors established safe-haven currencies. For EURUSD, the divergence between the ECB's policy stance and the Federal Reserve's path forward remains a key driver. If the Fed signals a more hawkish outlook in upcoming meetings, it could easily outweigh any short-term bullish technical signals on EURUSD, especially if the DXY resumes its uptrend.
Considering these factors, the bullish scenario hinges on the 1-hour chart's momentum carrying through to the higher timeframes. This would require a decisive break and hold above the $1.1548 resistance level. Such a move would likely be fueled by a weakening DXY and perhaps hawkish signals from the ECB that are more pronounced than expected. If EURUSD can clear $1.1548, the next significant resistance levels to watch would be $1.15517, followed by $1.15681. A sustained push above $1.15500 could signal a shift in short-term sentiment, potentially targeting the $1.15912 resistance on the daily chart. This scenario assumes that the current intraday strength is not merely a short-covering rally but a genuine resumption of the upward trend. The conviction behind this scenario would be amplified if volume picks up significantly on the breakout and if other risk-sensitive assets, like the Nasdaq, also show strength, indicating a broader risk-on environment.
Where Bears Take Control: The $1.15245 Line in the Sand
Conversely, the bearish scenario is strongly supported by the daily chart's technical indicators and the overall trend strength. The daily ADX at 36.18 clearly indicates a robust downtrend is in play, and the RSI at 41.44 suggests considerable room for further downside before reaching oversold territory. The MACD also shows negative momentum. For the bears to gain a stronger foothold, the price must first break below the immediate intraday support at $1.15349. A more significant bearish confirmation would come from a decisive close below the 4-hour support level at $1.15245. If this level gives way, the path opens towards the next support at $1.15101, and potentially down to the daily support at $1.14378. This bearish outlook gains credibility if the DXY resumes its upward trajectory, which would likely be triggered by hawkish signals from the Federal Reserve or a significant increase in global risk aversion. News regarding potential Fed rate hikes or a geopolitical escalation could easily spook markets and send EURUSD lower.
The confluence of indicators on the daily chart provides a strong foundation for a bearish case. The Stochastic Oscillator on the daily chart, while showing a bullish crossover (%K at 29.23, %D at 22.16), is still in the lower half of its range, implying that this crossover might not have enough strength to reverse the prevailing trend. The fact that the price is trading below the middle Bollinger Band on the daily chart further reinforces the bearish sentiment. A break below $1.15245 would not only confirm the bearish bias suggested by the daily indicators but would also invalidate the short-term bullish signals seen on the 1-hour chart. This would likely lead to a cascade of stop-losses being triggered, accelerating the downward move. The target in such a scenario would initially be the $1.15027 level on the 4-hour chart, followed by the more substantial daily support at $1.14378.
The macroeconomic backdrop offers several potential catalysts for a bearish EURUSD scenario. The upcoming Federal Reserve policy decision is a major event on the horizon. If the Fed signals a more aggressive stance on inflation, perhaps by indicating fewer or no rate cuts this year, it would strengthen the US Dollar significantly. This could easily push EURUSD below its current support levels. For instance, a hawkish tone from the Fed could see the DXY surge back above 100.00, creating headwinds for the Euro. Furthermore, any signs of escalating geopolitical tensions, particularly in Eastern Europe or the Middle East, could drive safe-haven flows into the US Dollar, further pressuring EURUSD. The market is also keenly watching inflation data from both the US and the Eurozone. If US inflation proves stickier than expected, it bolsters the case for Fed tightening, while softer Eurozone inflation could weaken the ECB's hand, both scenarios being bearish for EURUSD.
The Waiting Game: Consolidation Around $1.1530
A neutral scenario, characterized by range-bound trading, is also a distinct possibility, especially if market participants adopt a wait-and-see approach ahead of major economic events. This often occurs when conflicting signals emerge from different timeframes or when key economic data releases are imminent. In such a scenario, EURUSD might oscillate between the immediate support and resistance levels identified on the 1-hour chart, likely finding a tight range around the $1.1530-$1.1548 area. This would be a period of consolidation, where neither the bulls nor the bears can establish firm control. Factors that could prolong this consolidation include mixed signals from the DXY, indecisive central bank communication, or a lack of significant geopolitical catalysts. During such periods, traders often look for confirmation signals from higher volume spikes or decisive breaks of key intraday levels before committing to a direction. The ADX readings across different timeframes (1H: 29.34, 4H: 25.05, 1D: 36.18) show a mixture of strong and moderate trend strength, which can sometimes lead to choppy, range-bound price action if conflicting forces are at play.
The key to identifying a potential range-bound environment lies in observing the market's reaction to minor price fluctuations. If price attempts to move higher but quickly retreats from resistance, or if dips towards support are met with immediate buying interest that fails to sustain a rally, it suggests a lack of conviction. The Stochastic Oscillator's behavior can be particularly telling here; if it oscillates between overbought and oversold zones without establishing a clear trend, it confirms consolidation. For EURUSD, this consolidation could occur as traders await the Federal Reserve's policy decision and any related economic data releases. The markets might be pricing in a specific outcome, leading to a temporary pause in price action until the event unfolds. During this phase, risk management becomes paramount, as range-bound markets can trap unwary traders in whipsaws.
The current technical setup, with its divergence between short-term bullish signals and longer-term bearish indicators, lends itself well to a consolidation phase. The 1-hour chart might show upward momentum, but the daily chart's bearish undertones and the strong ADX readings on that timeframe suggest that any rallies might be met with selling pressure. This creates a tug-of-war. The $1.1548 resistance and $1.15349 support levels on the 1-hour chart could act as the boundaries for this potential range. If EURUSD remains trapped within this narrow band, it would suggest that the market is waiting for a significant catalyst to break the deadlock. This could be a surprisingly hawkish or dovish statement from the Fed, a major geopolitical development, or a significant shift in risk sentiment across global markets. Until then, expect choppy trading with limited directional conviction.
Which Scenario Holds the Most Weight?
Considering the data, the bearish scenario on the daily chart appears to have the stronger technical foundation due to its alignment with longer-term trend indicators. The ADX at 36.18 on the daily chart is a significant indicator of a strong downtrend, and the RSI at 42.53 still has considerable room to fall. While the 1-hour chart shows short-term bullish momentum, this is often overshadowed by the prevailing trend on higher timeframes. The divergence across timeframes suggests that the current upward move might be a retracement within a larger downtrend, rather than the start of a new bullish phase. Therefore, I assign a 60% probability to the bearish scenario playing out, with a 30% probability for consolidation and only a 10% probability for a sustained bullish breakout above $1.15681 in the immediate short term, unless significant fundamental catalysts emerge.
The key driver for the bearish case will be the Federal Reserve's upcoming policy decisions and statements. If the Fed maintains a hawkish stance, signaling fewer rate cuts or even a potential for further hikes, the US Dollar would likely strengthen across the board, putting significant downward pressure on EURUSD. Conversely, any dovish surprise from the Fed, or strong positive economic data from the Eurozone, could invalidate this bearish outlook and shift the probabilities towards a bullish scenario. The current consolidation near $1.1530-$1.1548 suggests that the market is indeed waiting for clarity. A break below $1.15245 would be a strong signal to favor the bearish outlook, targeting lower levels. A decisive move above $1.1548, backed by strong volume and positive fundamental news, would then open the door for the bullish scenario.
The probability for consolidation (30%) reflects the current indecision and the proximity of major events. Traders might be hesitant to take large positions until more clarity emerges. This could lead to a period of choppy trading within the established ranges. However, the strong daily trend indicators, particularly the ADX, suggest that this consolidation is likely temporary and that a directional move is more probable in the medium term. The crucial factor will be how price reacts to the key support at $1.15245 and resistance at $1.1548. A failure to break decisively in either direction could lead to a prolonged sideways movement, but the underlying trend strength indicated by the daily ADX suggests that a breakout is more likely than a sustained, wide-ranging consolidation.
What I'm Watching This Week: Key Triggers for EURUSD
My focus this week will be on three primary triggers that could dictate the next significant move for EURUSD. Firstly, the Federal Reserve's policy decision and accompanying statements. Any hint of a hawkish tilt will likely strengthen the USD and push EURUSD lower. I'll be watching for specific language regarding inflation and future rate path expectations. Secondly, I am closely monitoring the US Dollar Index (DXY). A sustained move above its daily resistance at 99.88 would add significant weight to the bearish EURUSD case. Conversely, a break below its 1H support at 99.18 could signal short-term dollar weakness, potentially offering a window for EURUSD to rally. Finally, I'll be watching price action around the key 1H support at $1.15245 and resistance at $1.1548. A decisive break and hold above $1.1548, especially with increasing volume, could signal a bullish reversal. However, a clear break below $1.15245 would likely confirm the bearish bias and open the way for further downside.
| Indicator | Value | Signal | Interpretation |
|---|---|---|---|
| RSI (14) | 63.39 | Neutral | Approaching overbought on 1H, but bullish bias overall. |
| MACD Histogram | Positive | Bullish | Positive momentum on 1H and 4H, but negative on 1D. |
| Stochastic | K=68.05, D=75.41 (1H) | Bearish | Crossing down on 1H, overbought on 4H; mixed signals across timeframes. |
| ADX | 29.34 (1H) | Bullish | Strong trend on 1H, moderate on 4H, strong downtrend on 1D. Trend strength is mixed. |
| Bollinger Bands | Middle Band | Watch | Price above middle band on 1H/4H, below on 1D. |
Scenario A: Bearish Continuation
60% ProbabilityEntry Trigger: A decisive close below the 4H support at $1.15245.
Target Levels: Initial target at $1.15101, with a secondary target at the daily support of $1.14378.
Invalidation Level: A strong close above the 1H resistance at $1.1548.
Scenario B: Consolidation/Range-Bound
30% ProbabilityEntry Trigger: Price action remains capped between $1.15245 and $1.1548 without significant volume.
Target Levels: Trading within the $1.15245 - $1.1548 range.
Invalidation Level: A clear break above $1.1548 or below $1.15245.
Scenario C: Bullish Breakout
10% ProbabilityEntry Trigger: A sustained break and close above the 1H resistance at $1.1548, ideally with increasing volume.
Target Levels: Initial target at $1.15517, followed by $1.15681.
Invalidation Level: Price closing below the 1H support at $1.15349.
Frequently Asked Questions: EURUSD Analysis
What happens if EURUSD breaks below $1.15245 support?
A break below $1.15245 would validate the bearish scenario, signaling a continuation of the downtrend. The next target would be $1.15101, with further downside potential towards $1.14378. This scenario is supported by the daily chart's strong ADX and RSI readings.
Should I buy EURUSD at current levels near $1.1542 given the RSI at 63?
Buying at current levels carries risk, as the RSI at 63.39 on the 1H chart is approaching overbought territory, and the longer-term daily trend is bearish. A more prudent approach would be to wait for a confirmed break above $1.1548 or a pullback to a stronger support level, accompanied by bullish confirmation signals.
Is the ADX at 36.18 on the daily chart a strong sell signal for EURUSD?
An ADX of 36.18 on the daily chart indicates a strong trend, which in this case is a downtrend. While not a direct sell signal on its own, it confirms that significant directional momentum is present, making pullbacks less likely to sustain and favoring downside continuation.
How will the upcoming Federal Reserve decision affect EURUSD this week?
The Fed's decision is a critical catalyst. A hawkish stance, suggesting fewer rate cuts, would likely strengthen the USD and push EURUSD lower towards our bearish targets. Conversely, a dovish surprise could support a move above $1.1548 resistance.
Track markets in real-time
AI-powered analysis, technical indicators and real-time price data.
Join Our Telegram Channel
Breaking market news, AI analysis and trading signals instantly.
Join Channel