The British Pound and US Dollar pair, GBP/USD, is currently navigating a critical juncture, trading precisely at the $1.33 mark. This consolidation phase comes as the market braces for significant economic data releases and grapples with mixed technical signals. The current neutral leaning, underscored by a weak ADX reading, suggests that while short-term traders might find choppy conditions, longer-term direction may hinge on upcoming macroeconomic events and a decisive break from current price confines.
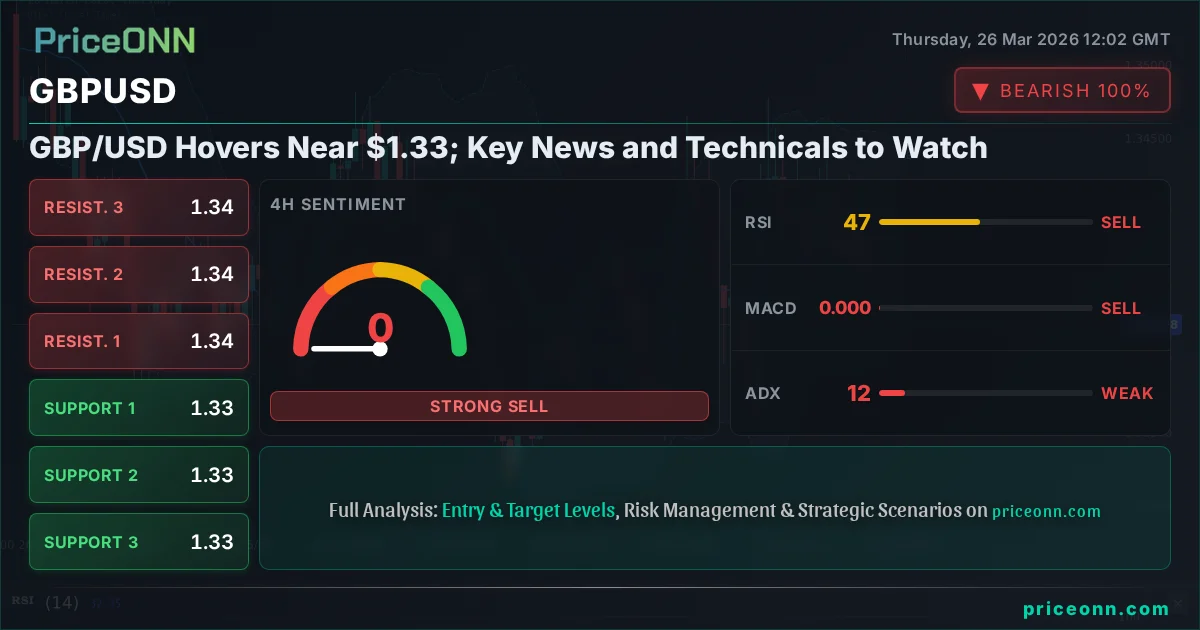
- GBP/USD is trading at $1.33248, showing a neutral technical bias with a weak ADX at 11.72 on the 4H chart.
- Key support for GBP/USD is identified at $1.33236, with resistance eyed around $1.33643.
- The RSI at 46.7 on the 4H suggests a lack of strong directional momentum, while the 1D chart shows a strong downtrend with ADX at 28.99.
- Upcoming high-impact economic data, particularly from the US and UK, will be crucial in determining the next directional move.
The global financial stage is currently set for a period of heightened volatility, particularly for currency markets. With the US Dollar Index (DXY) showing renewed strength, pushing towards 99.71, and major equity indices like the S&P 500 and Nasdaq experiencing significant pullbacks, risk sentiment appears to be shifting. This backdrop of a strengthening dollar and declining risk appetite typically puts pressure on riskier assets and currencies, including the British Pound. However, the GBP/USD pair’s current neutral stance, despite these broader market pressures, suggests a complex interplay of factors is at play. Traders are closely watching the $1.33 level, a psychological and technical pivot point, for clues on the immediate direction.
Navigating the Macroeconomic Crosscurrents
The economic calendar is packed with high-impact events this week, and their interpretation will be key for GBP/USD. While specific data points from the provided market context are sparse for today, the general sentiment surrounding major economies is critical. The US economy, as indicated by recent PMI figures showing an expansion (52.4 actual vs 51.5 forecast on the 1H chart), continues to exhibit resilience, which supports the Dollar Index's upward trajectory. Conversely, the UK’s economic picture, while showing stability in some areas like the 3% Services PMI, faces headwinds that prevent a clear bullish narrative for Sterling. Any deviation from expected inflation or employment figures in either the US or the UK could trigger significant moves, forcing GBP/USD out of its current tight range. The market's reaction to these data points will be amplified by the prevailing risk sentiment, making the upcoming days crucial for establishing a clearer trend.
The relationship between the US Dollar and major currency pairs, especially GBP/USD, remains a cornerstone of forex analysis. As the DXY climbs, it exerts downward pressure on pairs like GBP/USD, making it more expensive for holders of other currencies to purchase dollars. This dynamic is currently playing out, with the DXY showing a strong 0.41% daily gain and pushing towards 99.71. The technical indicators on the DXY’s 1H chart, such as an RSI at 72.83 and Stochastic showing overbought conditions, suggest that while the dollar is strong, it might be approaching a point of temporary exhaustion. However, on the daily timeframe, the ADX at 31.82 confirms a strong upward trend, indicating that the dollar’s strength could persist. This sustained dollar strength is a significant headwind for GBP/USD, pushing it towards its support levels.
Technical Picture: A Standoff at $1.33
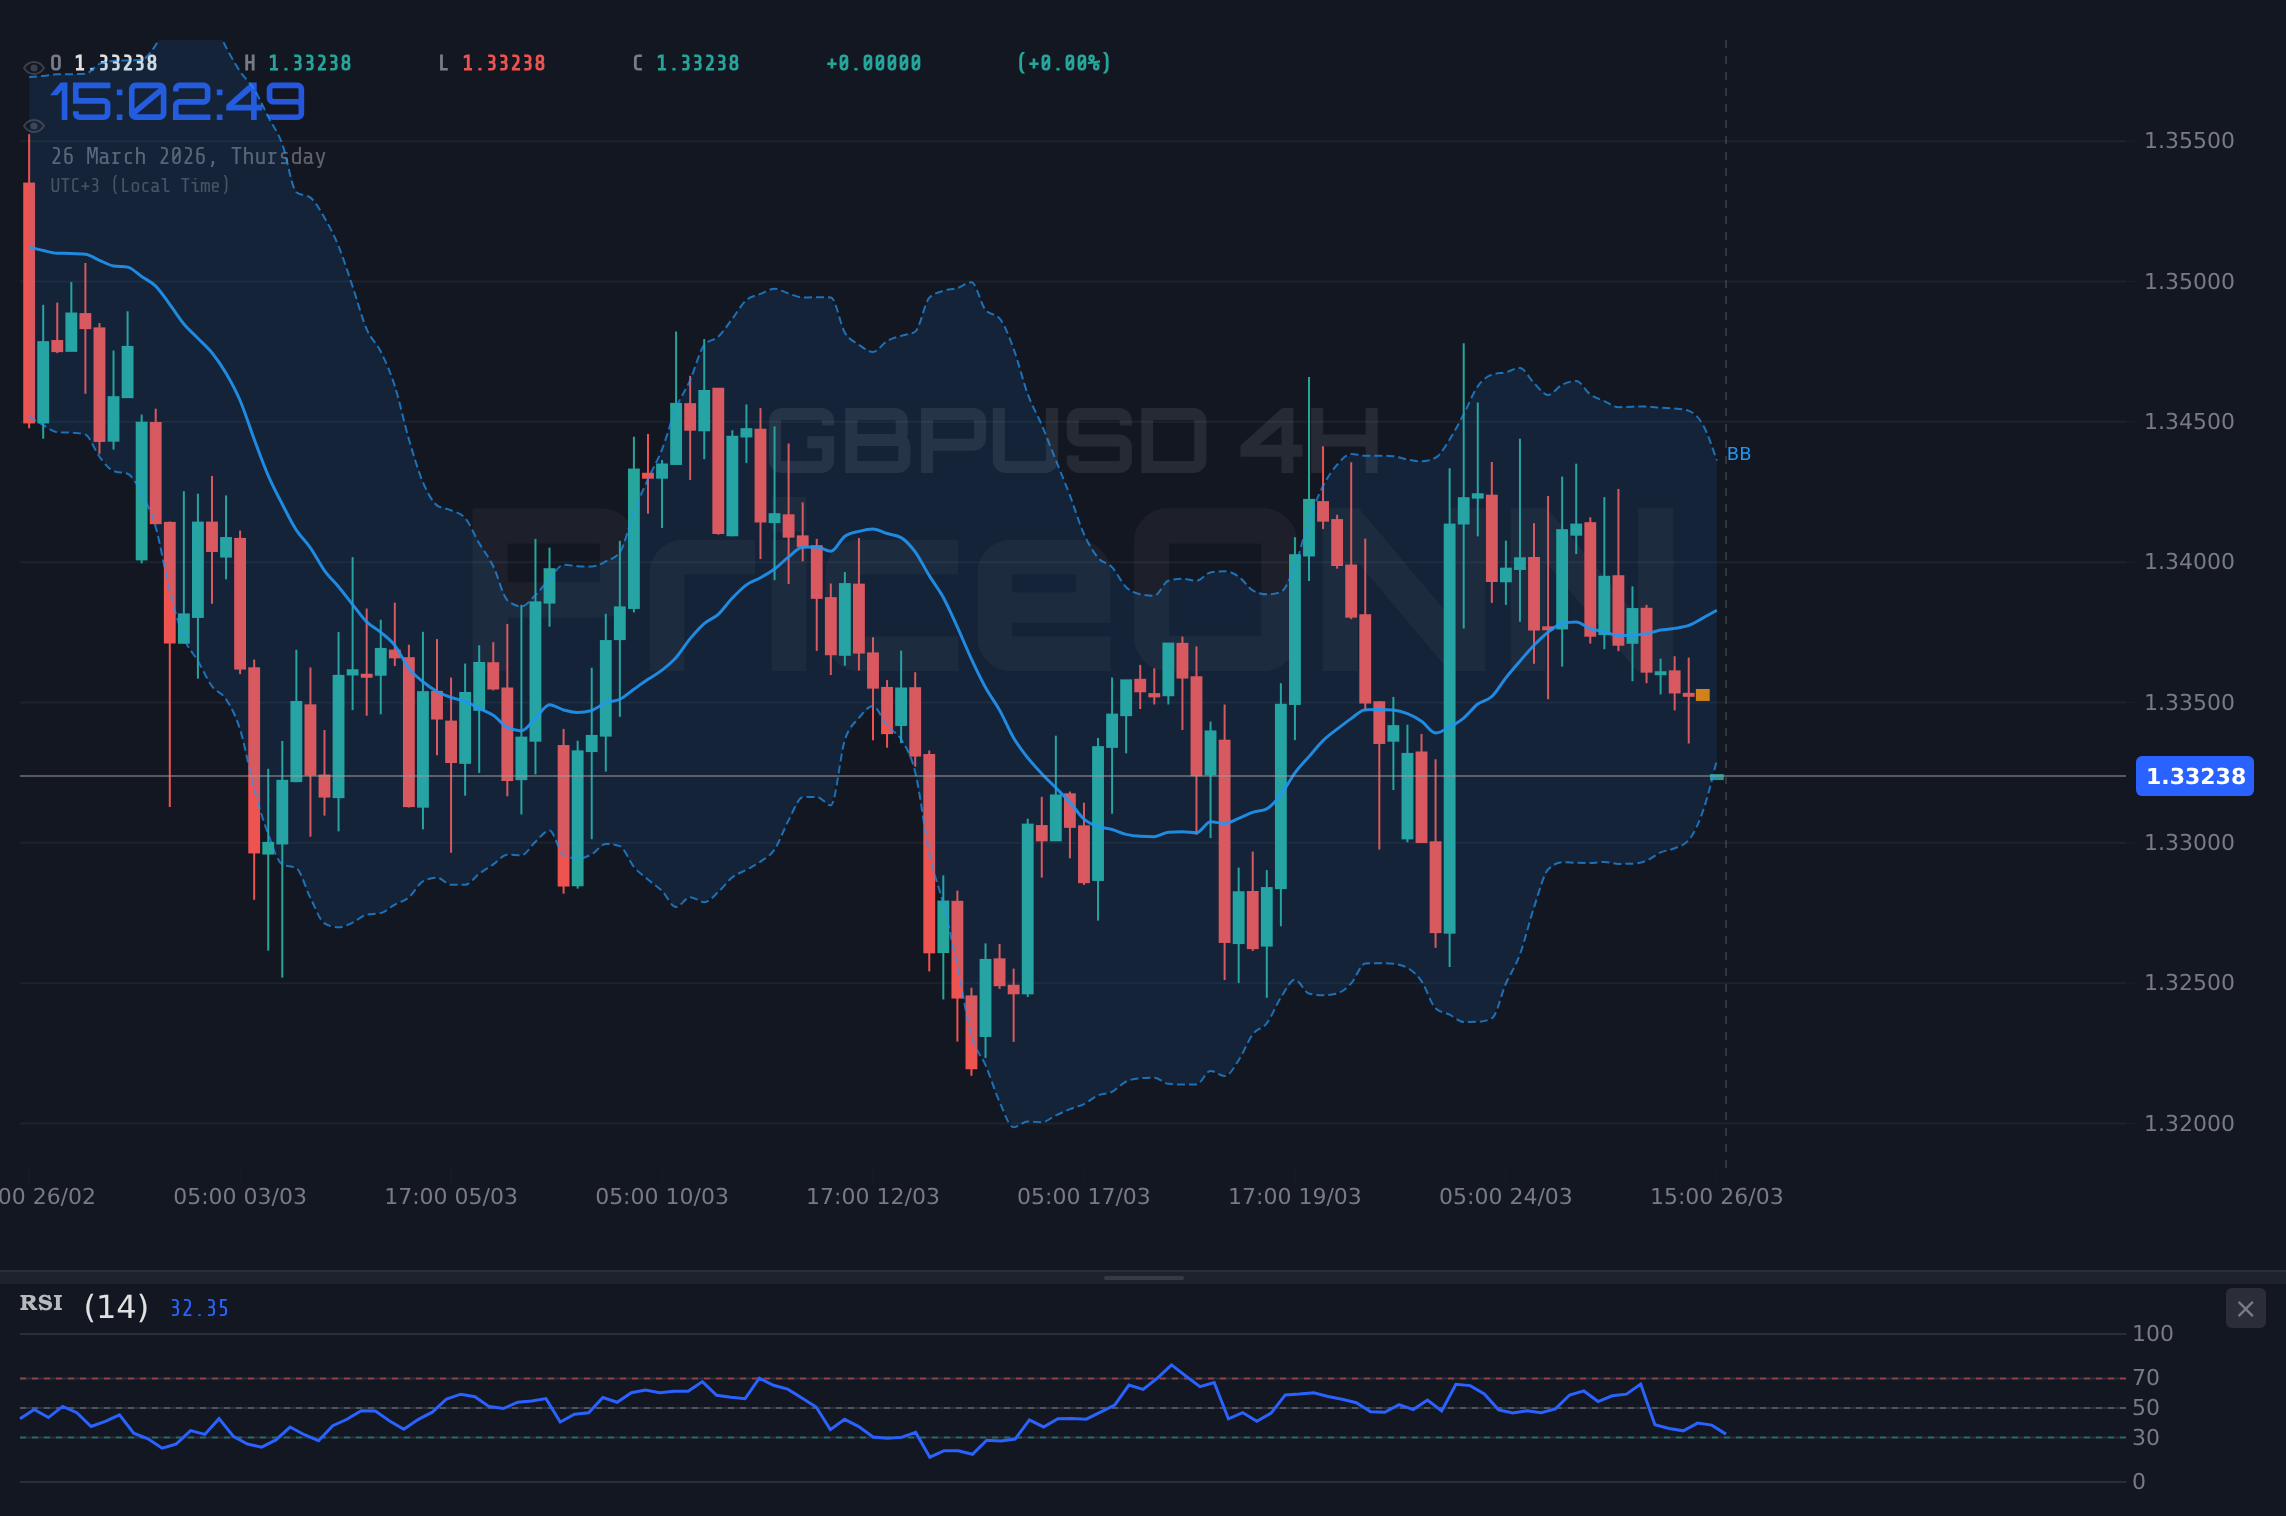
From a technical standpoint, GBP/USD is painting a picture of indecision, particularly on the shorter timeframes. The 1-hour chart shows a neutral trend with an ADX reading of 21.31, indicating a lack of strong directional conviction. The RSI hovers around 33.06, suggesting some bearish momentum but not yet in oversold territory. However, the 4-hour chart presents a slightly different, yet still indecisive, view. While the trend is also marked as neutral (ADX 11.72), the RSI sits at 46.7, indicating a lack of strong momentum in either direction. The Stochastic indicator shows %K below %D, hinting at potential downside, but the weak ADX suggests this might lead to range-bound trading rather than a strong trend. This is the core of our $1.33248 price point – a confluence of weak trend strength across intraday charts.
Delving into the daily timeframe, the picture becomes clearer, albeit still cautionary for bulls. The ADX here is notably higher at 28.99, signalling a strong downtrend is in place. The RSI at 44.42 indicates bearish sentiment but remains well clear of oversold conditions. The MACD on the daily chart shows negative momentum, with the MACD line below its signal line, reinforcing the bearish outlook. Bollinger Bands are also positioned below the middle band, suggesting a downward bias. While the Stochastic indicator on the daily timeframe shows %K above %D (49.46 vs 30.31), suggesting a potential for a short-term bounce, the overall daily trend and the weaker ADX on intraday charts suggest that any upside might be limited. This contrast between intraday neutrality and daily bearishness is exactly why the $1.33 level is so critical.
Key Levels and Price Action
The immediate support for GBP/USD lies at $1.33236, a level that has been tested multiple times in the recent trading sessions. A decisive break below this point, especially on significant volume, could trigger further downside towards the next support at $1.33360. On the upside, resistance is currently faced around $1.33588. A sustained move above this resistance, confirmed by strong buying pressure and increased volume, would be necessary to challenge higher levels. The immediate range between these two points ($1.33236 - $1.33588) is where most of the intraday action is likely to occur until a fundamental catalyst emerges. The current price action is characterized by a lack of conviction, making these levels crucial reference points for any potential trading strategy.
The prevailing market sentiment, as reflected in the correlation with the S&P 500 and Nasdaq, also warrants attention. Both indices are experiencing significant daily declines (-0.94% for S&P 500, -1.12% for Nasdaq 100). This broad risk-off sentiment typically benefits the US Dollar as a safe-haven asset, further pressuring GBP/USD. If these equity markets continue their downward trajectory, it would likely reinforce the bearish bias on GBP/USD, potentially leading to a test of lower support levels. Conversely, any signs of stabilization or recovery in the equity markets could provide some relief to the Sterling, allowing it to challenge near-term resistance levels. The interplay between dollar strength, risk appetite, and specific currency pair dynamics creates a complex trading environment.
Trading Scenarios: What Could Happen Next?
Bearish Scenario: Downside Breakout
65% ProbabilityNeutral Scenario: Range-Bound Consolidation
25% ProbabilityBullish Scenario: Support Holds, Rebound
10% ProbabilityThe current technical setup, characterized by weak intraday trends and a stronger daily bearish bias, presents a challenging environment. The ADX readings across different timeframes highlight this lack of clear direction, with the 4-hour ADX at a mere 11.72, indicating choppy, range-bound conditions. However, the daily ADX at 28.99 suggests that the underlying trend is indeed bearish, even if it’s not currently exhibiting strong momentum. This divergence implies that any upward moves might be met with selling pressure, while downside could be capped by the immediate support at $1.33236. A catalyst is needed to break this stalemate.
The $1.33 price point for GBP/USD is not just a number; it's a battleground where macroeconomic expectations and technical levels collide. The strengthening US Dollar, driven by economic resilience and a risk-off sentiment, provides a fundamental tailwind for bearish scenarios. Meanwhile, the technical indicators present a mixed picture: daily charts lean bearish, but intraday charts show consolidation, suggesting a potential for short-term fluctuations rather than a sustained trend. The crucial support at $1.33236 and resistance at $1.33588 will likely define the trading range in the absence of major news.
For traders, the current environment calls for patience and a focus on risk management. The WATCH_ZONE decision reflects the choppy market conditions indicated by the ADX. A valid setup would likely require a clearer directional signal, perhaps a daily close above the $1.33652 resistance to confirm a bullish reversal, or a decisive break below the $1.33236 support to confirm the bearish trend continuation suggested by the daily chart. Until then, scalping within the range or waiting for a confirmed breakout appears to be the most prudent approach.
Given the current neutral technicals and the looming economic data, volatility is expected to increase. Traders should exercise caution, employ strict stop-losses, and consider position sizing carefully. A break of key support or resistance levels, especially on high volume, could signal the start of a more significant trend. Always manage your risk exposure.
Frequently Asked Questions: GBPUSD Analysis
What happens if GBP/USD breaks below the $1.33236 support level?
A break below $1.33236, especially with increased volume, could trigger a bearish move towards $1.33061 and potentially $1.32554. This would align with the strong downtrend indicated by the daily ADX of 28.99.
Should I buy GBP/USD at current levels of $1.33248 given the neutral technicals?
Buying at current levels is risky due to the neutral intraday ADX (11.72) and strong daily bearish trend. A higher probability setup would involve waiting for a confirmed break above $1.33652 resistance or a bounce from support with bullish divergence.
Is the RSI at 46.7 on the 4H chart a sell signal for GBP/USD?
An RSI of 46.7 is in the neutral zone and indicates a lack of strong momentum rather than a direct sell signal. It suggests that neither buyers nor sellers are in firm control on this timeframe, contributing to the pair's consolidation.
How will upcoming US economic data affect GBP/USD this week?
Stronger-than-expected US data, such as PMI figures (currently at 52.4), could further boost the DXY and pressure GBP/USD lower towards $1.33236. Conversely, weaker data might offer some relief and support a move towards resistance.
The current market environment for GBP/USD demands a measured approach. While the pair hovers around the $1.33 mark, the technical indicators present a conflicting narrative between intraday consolidation and a prevailing daily downtrend. The strengthening US Dollar and broader risk-off sentiment add further bearish pressure. For any sustained upward movement, price needs to decisively break above key resistance levels, particularly $1.33652. Until then, the path of least resistance appears to be downwards, with $1.33236 acting as the immediate level to watch. Traders should prioritize risk management and wait for clearer signals from upcoming economic events.
Track markets in real-time
AI-powered analysis, technical indicators and real-time price data.
Join Our Telegram Channel
Breaking market news, AI analysis and trading signals instantly.
Join Channel