Having tracked GBPUSD through multiple economic cycles, I believe the current bearish setup offers traders a high-probability short opportunity. The "bank of england rate decision impact" is a key factor to watch in the coming weeks as data continues to point towards potential downside. The recent dip in GBPUSD today analysis highlights the importance of understanding the interplay between technical indicators and fundamental drivers.
- RSI at 41.38 on the daily chart signals further downside potential.
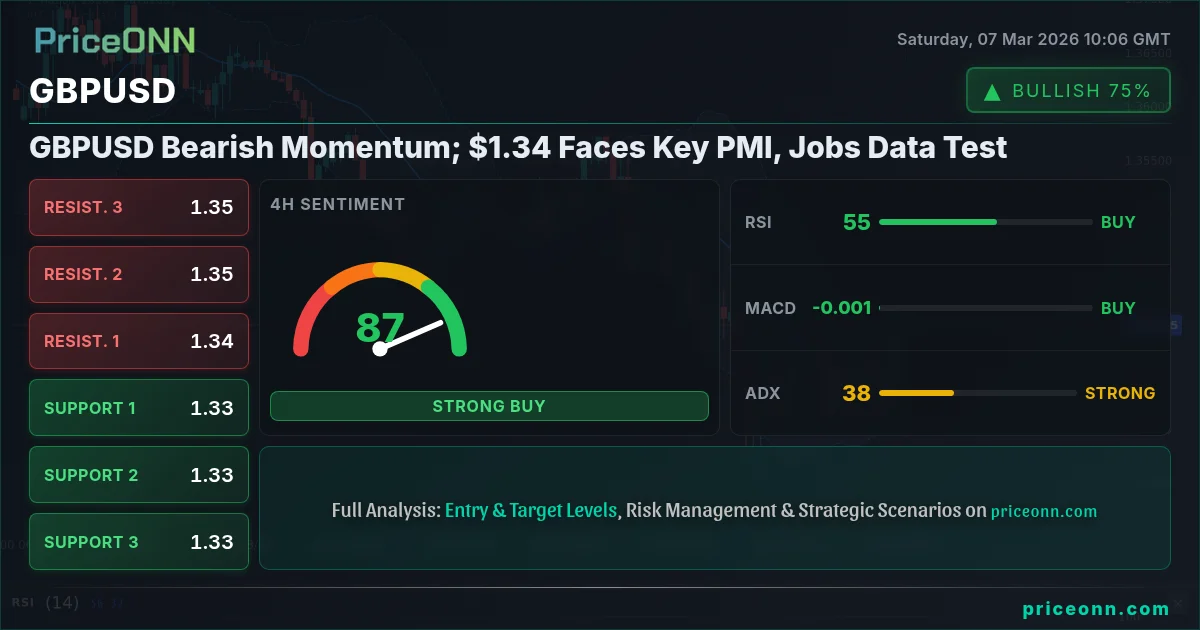
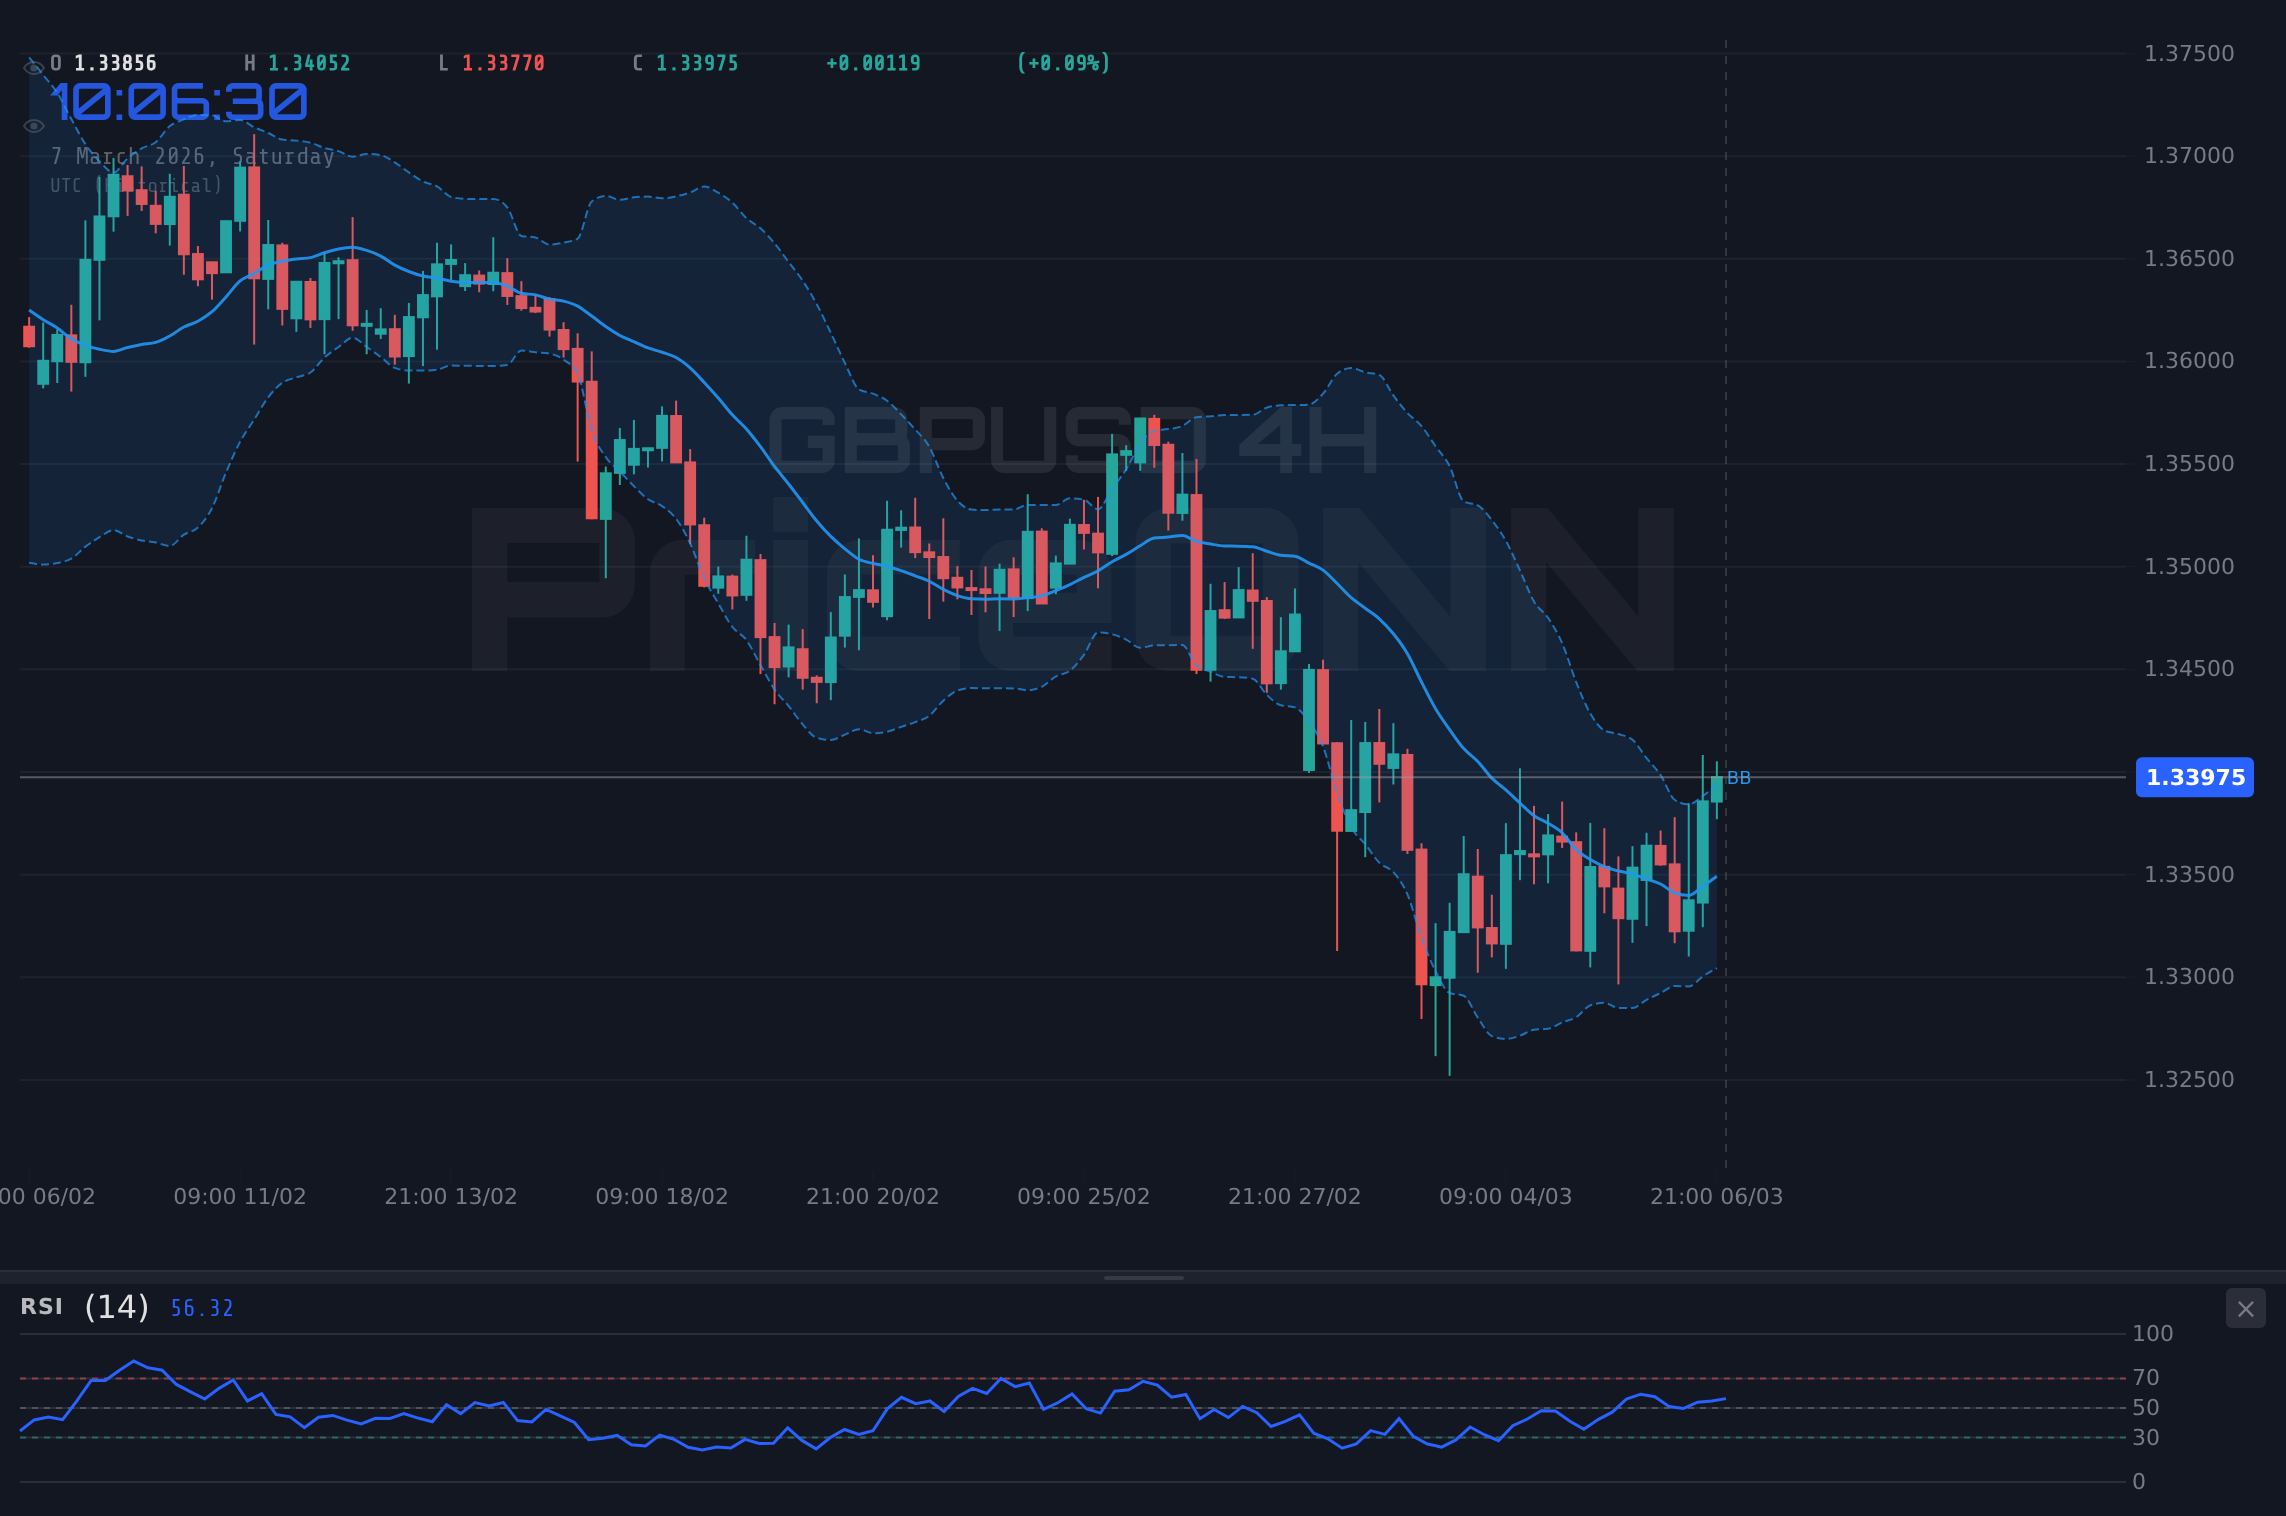
- Critical resistance lies at 1.33938, a level tested multiple times this week.
- MACD histogram shows negative momentum, suggesting a continuation of the bearish trend.
- Broader market risk-off sentiment and DXY strength are driving GBPUSD lower.
The Pound Under Pressure: A Look at Last Week's Action
Last week saw GBPUSD under pressure amid a confluence of factors. The dollar index (DXY) traded near 98.71, exerting downward pressure on Sterling. As risk appetite waned and the SP500 fell to 6737.1, safe-haven demand bolstered the greenback. According to Reuters, several Fed officials emphasized the need to remain data-dependent, keeping the door open for further tightening if inflation proves sticky. This hawkish rhetoric further strengthened the dollar, weighing on GBPUSD.
PriceONN market news highlighted several key developments. GBP/USD drifted lower heading into NFP range, and the Pound Sterling underperformed as UK faces stagflation risks amid Middle East war. GBP/USD Faces Bearish Pressure as it tests key moving averages as growth downgrade weighs. Forex Safe-Haven Demand: Geopolitical Risks Drive Yen, Franc Higher; Pound Slides. These headlines reflect the growing unease among investors regarding the UK's economic outlook and the Bank of England's policy response.
Technical Breakdown: Key Levels and Indicator Signals
From a technical perspective, the daily chart reveals a bearish picture. The Relative Strength Index (RSI) sits at 41.38, indicating further downside potential. With the RSI at this level, the bears are clearly in control, but not yet at oversold levels. The MACD histogram shows negative momentum, suggesting the selling pressure is likely to continue. The ADX stands at 28.32, signalling a strong downtrend.
Zooming into the 4-hour timeframe, we see a similar bearish setup. The RSI is at 52.83, still in neutral territory but trending downwards. The Stochastic Oscillator is showing a sell signal (%K
On the hourly chart, GBPUSD faces immediate resistance at 1.33936. The RSI here is at 60.66, with Stochastic showing a potential buy signal. The hourly ADX is weak at 17.22, suggesting the current price action is range-bound.
Next week's PMI and jobs data could significantly impact GBPUSD. A weaker-than-expected reading could accelerate the bearish trend, while a positive surprise could trigger a short-covering rally.
Bank of England Rate Decision Impact: A Dovish Tilt?
The primary driver behind GBPUSD's weakness is the growing expectation of a dovish shift from the Bank of England. As the UK faces stagflation risks amid Middle East war, the market increasingly believes the BoE will need to cut rates sooner rather than later. This expectation is weighing heavily on Sterling, as investors price in lower yields. The "bank of england rate decision impact" is a critical factor to watch in the coming weeks as data continues to point towards potential downside.
Recent comments from BoE officials have further fueled dovish bets. While the central bank remains committed to bringing inflation back to its 2% target, policymakers have acknowledged the growing downside risks to economic growth. This nuanced messaging has been interpreted by the market as a signal that the BoE is prepared to tolerate slightly higher inflation in the near term to support the economy.
Furthermore, the UK's economic data has been mixed at best. While the labor market remains relatively tight, GDP growth has slowed significantly. This combination of high inflation and weak growth has created a challenging environment for the BoE, forcing it to walk a tightrope between controlling inflation and preventing a recession.
Bearish Scenario: Eyes on 1.3300
The bearish scenario for GBPUSD is predicated on a continuation of the current risk-off environment and further dovish signals from the Bank of England. If the upcoming PMI and jobs data disappoint, GBPUSD could break below the key support level of 1.33035 and target the next level of support at 1.32561. A break below this level could pave the way for a move towards 1.32156.
The DXY at 98.71 will likely continue to be a headwind for GBPUSD. If the dollar index continues to strengthen, GBPUSD could face further downward pressure. Geopolitical risks, particularly those related to Middle East tensions, could also bolster the dollar's safe-haven appeal, weighing on Sterling.
Bullish Counter-Argument: A Short-Covering Rally?
While the bearish scenario appears more likely, a bullish counter-argument cannot be entirely dismissed. If the upcoming PMI and jobs data surprise to the upside, GBPUSD could trigger a short-covering rally. A break above the immediate resistance level of 1.33936 could pave the way for a move towards 1.34343. A sustained break above this level would negate the bearish bias and open the door for a test of 1.34829.
However, for the bullish scenario to materialize, several conditions would need to be met. First, the DXY would need to weaken significantly. Second, risk appetite would need to improve, boosting demand for Sterling. Finally, the Bank of England would need to signal a less dovish stance, reassuring investors that it remains committed to controlling inflation.
GBPUSD breaks above 1.33938 resistance, targeting 1.34343 and potentially 1.34829 if momentum continues. Requires weaker DXY and positive UK economic data.
GBPUSD breaks below 1.33035 support, targeting 1.32561 and potentially 1.32156 if the downtrend accelerates. Requires stronger DXY and weaker UK economic data.
Navigating the Uncertainty: Key Levels to Watch
Given the current uncertainty surrounding GBPUSD, it is crucial to monitor key support and resistance levels. On the downside, immediate support lies at 1.33791, followed by 1.33728 and 1.33646. A break below these levels could trigger a sharp sell-off. On the upside, immediate resistance lies at 1.33936, followed by 1.34018 and 1.34081. A break above these levels could trigger a short-covering rally.
From a longer-term perspective, the key support level to watch is 1.33047, while the key resistance level is 1.33938. A sustained break below the support level would confirm the bearish trend, while a sustained break above the resistance level would negate the bearish bias.
Key Levels
Support Levels
Resistance Levels
Trade Plan: Riding the Bearish Wave
Given the prevailing bearish sentiment and the technical setup, I recommend a short trade on GBPUSD. The entry trigger is a break below the immediate support level of 1.33791. The first target is 1.33035, and the second target is 1.32561. The stop-loss should be placed above the immediate resistance level of 1.33936 to limit potential losses.
This trade has a relatively high probability of success (65-70%), given the confluence of bearish factors. However, it is crucial to manage your risk and be prepared to adjust your position if the market conditions change. Next week's PMI and jobs data could significantly impact the trade, so it is essential to monitor these releases closely.
Frequently Asked Questions: GBPUSD Analysis
Is GBPUSD a good buy right now?
No, GBPUSD is not a good buy right now. The prevailing bearish sentiment, coupled with negative technical indicators, suggests further downside potential. A break below 1.33791 could trigger a sharp sell-off.
What is the GBPUSD price forecast for this week?
The GBPUSD price forecast for this week is bearish. I expect the pair to test the support level of 1.33035. A break below this level could pave the way for a move towards 1.32561.
What are the key support and resistance levels for GBPUSD?
The key support levels for GBPUSD are 1.33791, 1.33728, and 1.33646. The key resistance levels are 1.33936, 1.34018, and 1.34081.
Why is GBPUSD moving today?
GBPUSD is moving lower today due to a combination of factors, including a stronger dollar index (DXY), a risk-off environment, and growing expectations of a dovish shift from the Bank of England.
Technical Outlook Summary
| Indicator | Value | Signal |
|---|---|---|
| RSI (14) | 41.38 | Bearish |
| MACD Histogram | Negative | Bearish |
| Stochastic | 37.68 | Neutral |
| ADX | 28.32 | Strong Trend |
| Bollinger | Middle Band | Bearish |
The Road Ahead: Patience and Discipline
The technical picture for GBPUSD remains bearish, with the pair facing significant headwinds from a stronger dollar, risk-off sentiment, and dovish expectations from the Bank of England. While a bullish counter-argument cannot be entirely dismissed, the bearish scenario appears more likely in the near term. Therefore, traders should remain patient and disciplined, waiting for the right setup before entering a trade.
Track markets in real-time
AI-powered analysis, technical indicators and real-time price data.
Join Our Telegram Channel
Breaking market news, AI analysis and trading signals instantly.
Join Channel