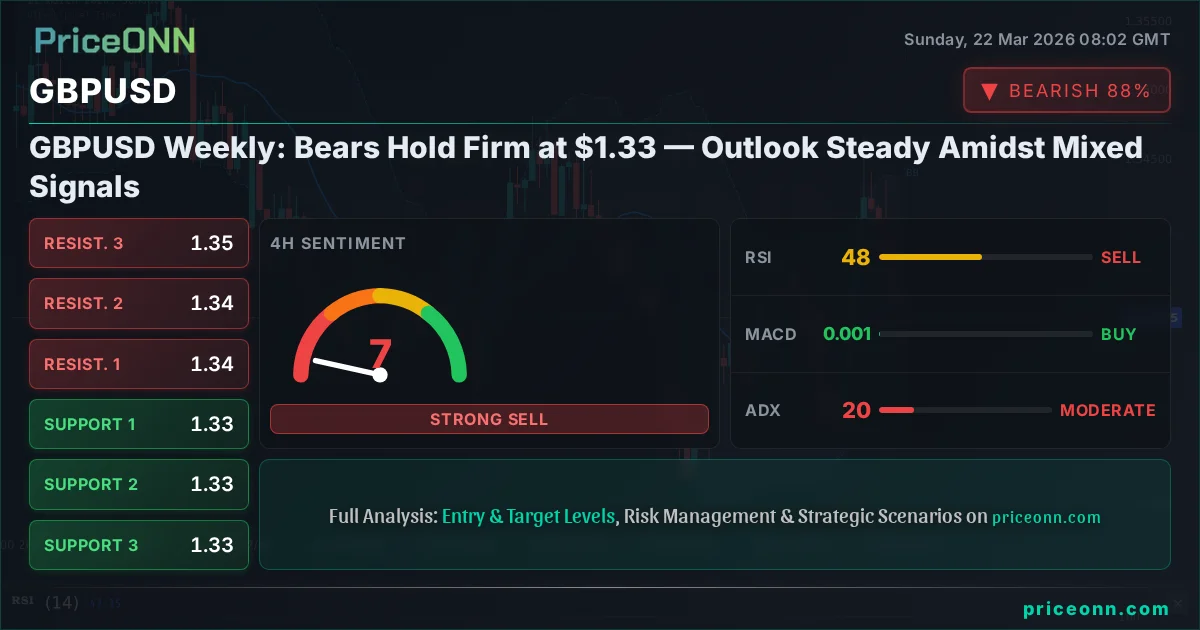
Last Friday, the GBP/USD pair closed around the critical $1.33 mark, a level that has seen significant action throughout the week. Bears have maintained their grip, preventing any decisive upward momentum despite occasional rallies. The prevailing sentiment points towards a steady, albeit cautious, outlook as traders digest a complex mix of technical signals and await clearer macroeconomic drivers. This ongoing tug-of-war at the $1.33 handle suggests that the currency pair is at a crucial juncture, where the next significant move will likely be dictated by either a decisive technical breakout or a shift in fundamental sentiment.
- GBP/USD closed near the critical $1.33 level, showing a bearish trend on the daily chart (ADX 29.92).
- Key support is identified at $1.3289, while resistance looms at $1.3343 on the 1-hour timeframe.
- RSI at 42.55 indicates bearish pressure, but Stochastic's upward signal (%K > %D) suggests potential for short-term bounces.
- The US Dollar Index (DXY) at 99.25 shows a strong daily uptrend, potentially capping GBP/USD gains.
Navigating the $1.33 Labyrinth: A Technical Deep Dive
The Sterling's Tightrope Walk Above Support
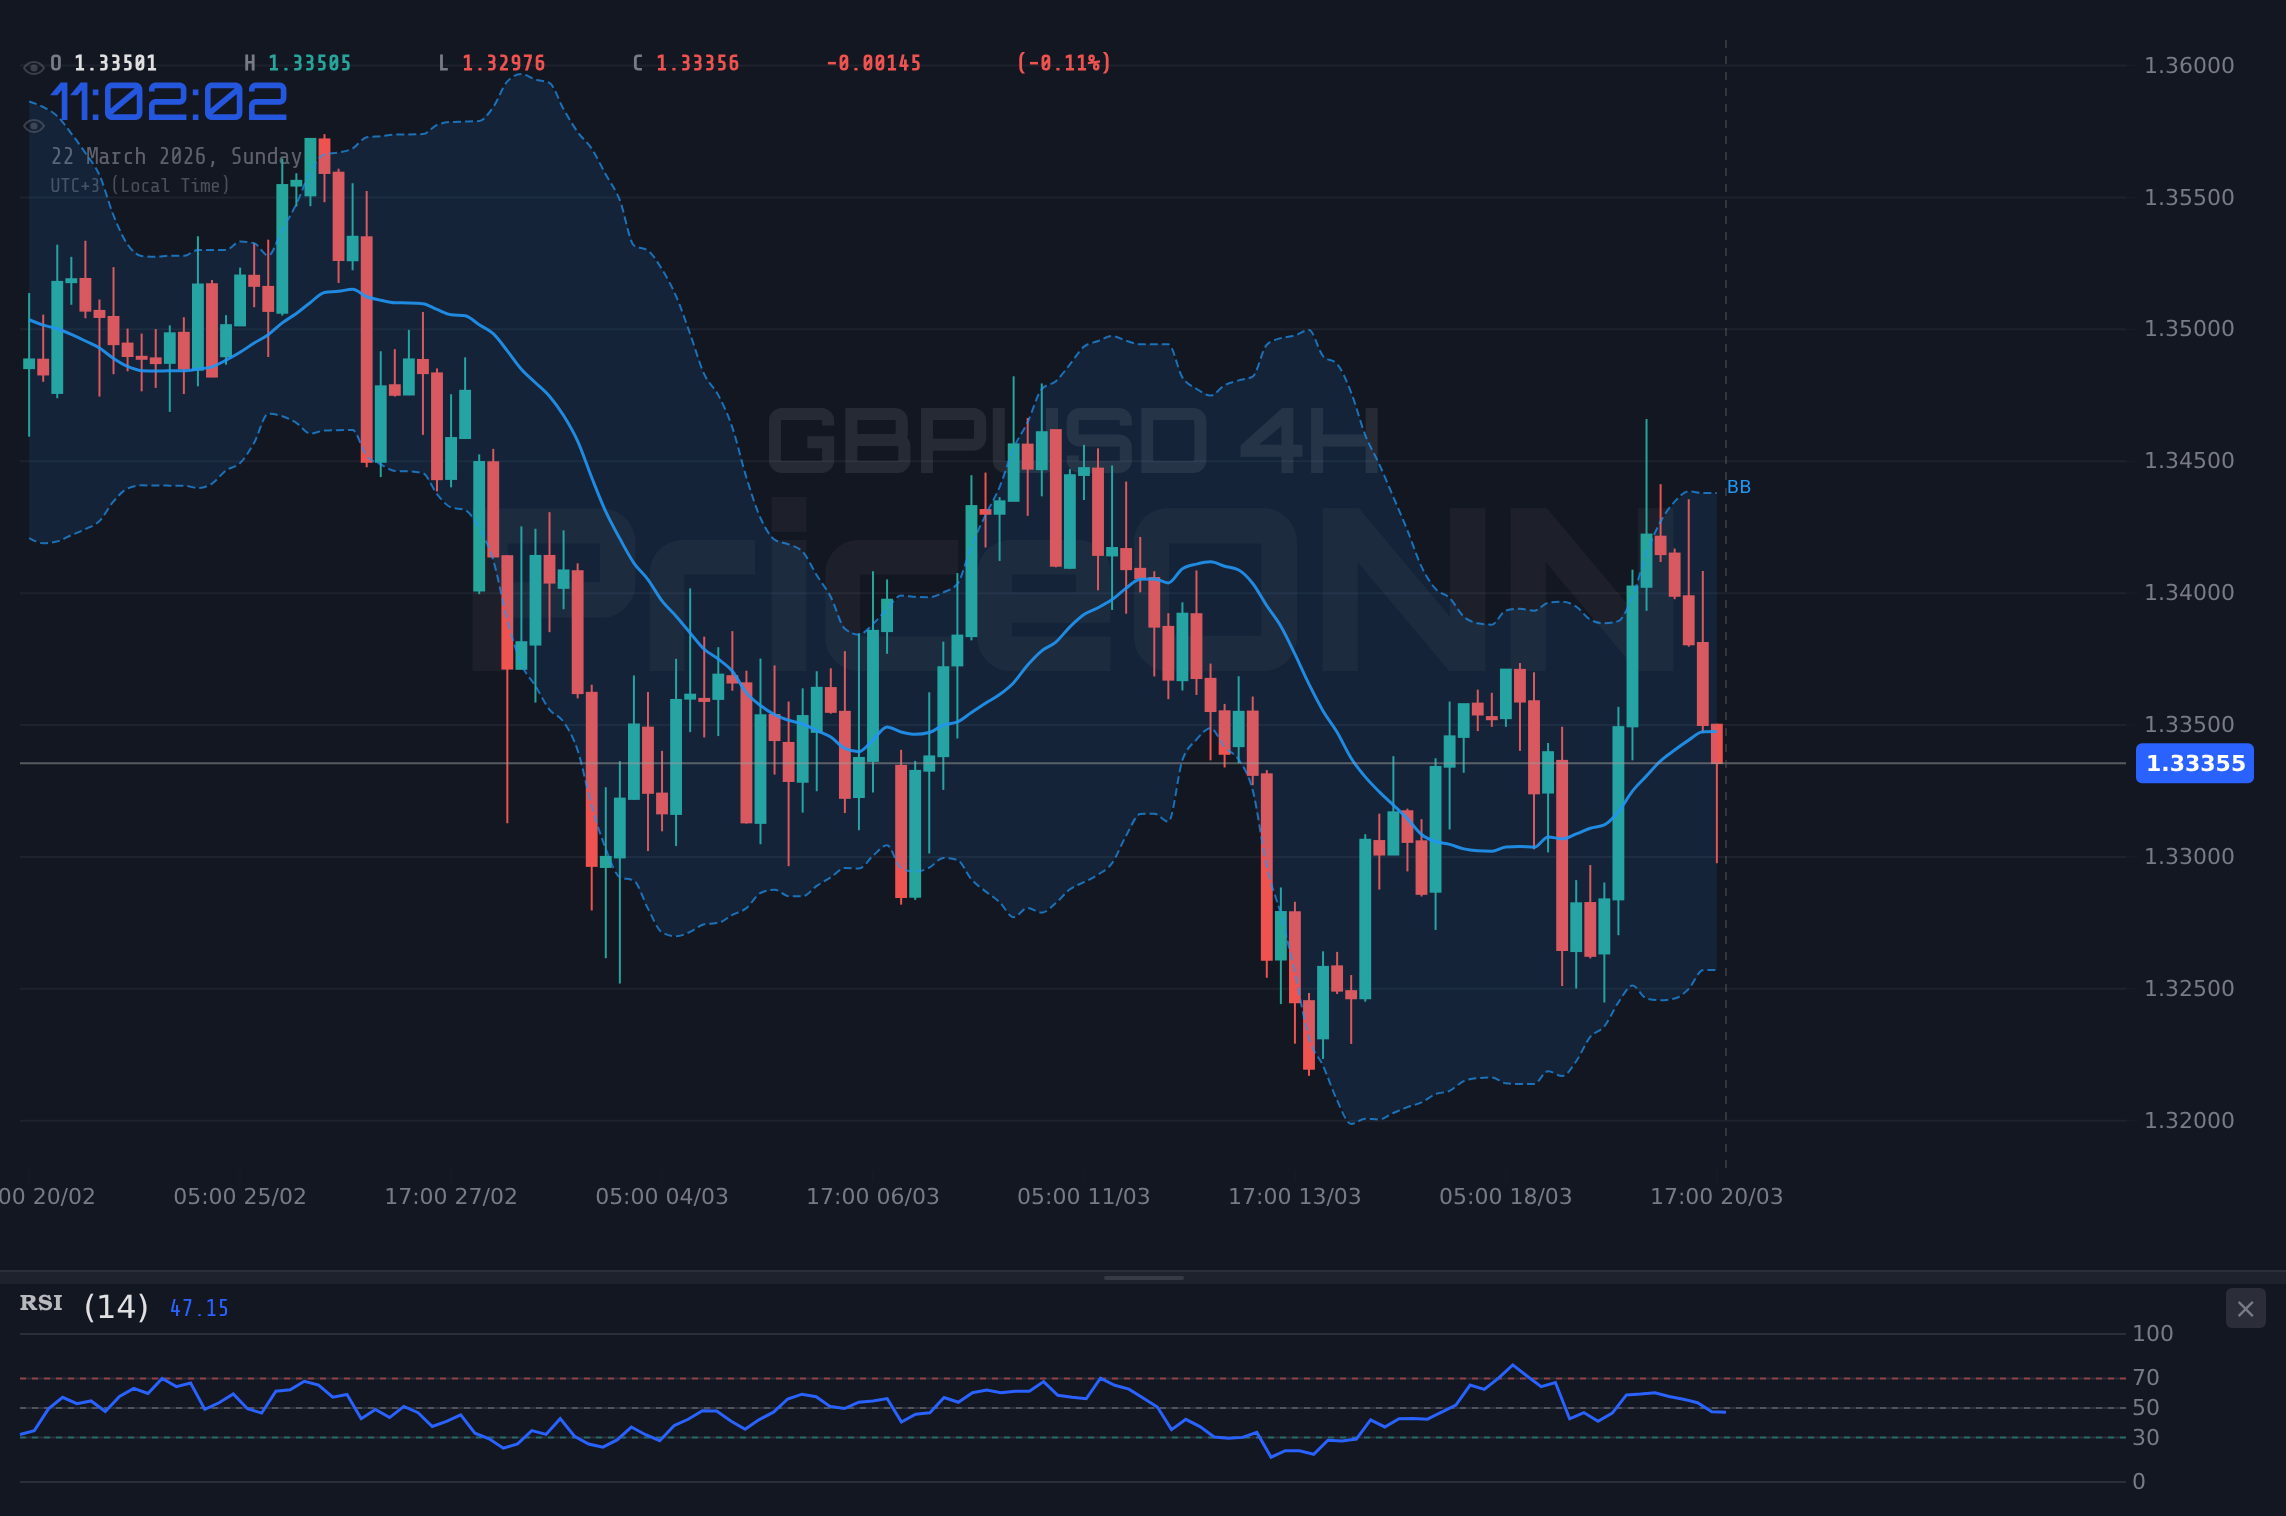
The GBP/USD pair has been consolidating around the $1.33 level, painting a picture of indecision in the short term, yet the daily chart analysis leans towards continued bearish pressure. The Average Directional Index (ADX) on the daily timeframe sits at a robust 29.92, indicating a strong downtrend is in play. This suggests that any upward movements might be temporary retracements within a larger bearish trend. The 1-hour chart presents immediate support at $1.33149, followed by $1.33048 and then the more significant level at $1.32863. A decisive break below these levels could trigger further downside, testing the patience of bulls who have been looking for a sustained recovery. The 4-hour chart reinforces this cautious outlook, with support identified at $1.33285 and $1.33069. The proximity of these support levels to the current price means that any significant selling pressure could quickly lead to a test of lower ground.
The Sterling's struggle is not happening in a vacuum. The broader market context, particularly the performance of the US Dollar Index (DXY), plays a pivotal role. With the DXY currently trading around 99.25 and showing a strong daily uptrend (ADX 34.64), the dollar is exhibiting strength. This correlation is crucial: as the dollar strengthens, it typically exerts downward pressure on pairs like GBP/USD, making it harder for the British Pound to find upward traction. The market sentiment, as reflected by the DXY's upward trajectory, suggests that safe-haven flows might be increasing, further complicating the outlook for risk-sensitive currencies like the Pound.
Resistance Remains the Barrier: Where Bulls Face the Wall
On the flip side, the resistance levels for GBP/USD are acting as formidable barriers, capping any potential upside. On the 1-hour chart, the immediate resistance is positioned at $1.33435, with subsequent hurdles at $1.33620 and $1.33721. These levels represent the immediate ceiling that buyers must overcome to even consider a trend reversal. The 4-hour chart shows resistance at $1.33900, followed by $1.34299 and $1.34515. Breaking through these zones would require significant buying pressure, potentially fueled by a shift in central bank expectations or positive UK economic data. However, the current technical picture, characterized by weaker momentum indicators and strong bearish trends on higher timeframes, makes such a decisive move challenging in the immediate future. The ability of GBP/USD to push and hold above these resistance points will be a key determinant of its short-to-medium term trajectory.
The daily chart provides a broader perspective, with significant resistance identified at $1.35105, $1.35989, and a more distant but critical level at $1.37317. These are the levels that long-term bulls would be watching for a sustained recovery. However, the path to these levels is currently fraught with obstacles. The prevailing bearish sentiment, coupled with the strength of the US dollar, suggests that breaching these higher resistance points will require a substantial fundamental catalyst. Without such a catalyst, the price action may remain range-bound or continue its downward drift, testing the lower support structures.
Weighing the Indicators: A Symphony of Mixed Signals
The technical indicators offer a nuanced view, highlighting the current market indecision while leaning towards a bearish bias on the daily timeframe. On the 1-hour chart, the Relative Strength Index (RSI) is at 42.55, indicating a bearish bias but still some room before entering oversold territory. Conversely, the Stochastic Oscillator presents a more bullish short-term signal, with its %K line (29.29) above its %D line (15.14), suggesting a potential for a short-term upward bounce from current levels. However, this is tempered by the MACD, which shows negative momentum with its histogram below the signal line, reinforcing the bearish undertone.
Moving to the 4-hour timeframe, the RSI sits at 48.39, firmly in neutral territory, suggesting neither strong buying nor selling pressure at this immediate level. The Stochastic here also shows a bearish signal (%K %D), presenting a conflicting picture with the overall bearish trend indicated by the ADX at 29.92. This divergence between Stochastic and other daily indicators warrants caution; a sustained move above key resistance would be needed to validate the bullish Stochastic signal.
The Bollinger Bands further illustrate the current market dynamics. On the 1-hour and 4-hour charts, the price is trading below the middle band, indicating bearish pressure. On the daily chart, the price is also hugging the middle band, suggesting a lack of strong directional conviction but a slight bearish tilt. The ADX, as mentioned, is a crucial indicator here. Its reading on the daily chart (29.92) confirms a strong downtrend, while the 1-hour and 4-hour readings (27.93 and 20.06 respectively) suggest that while the trend is strong, the momentum might be waning slightly on intraday charts, opening the door for potential pullbacks before a continuation of the larger trend. This interplay of indicators paints a picture of a market at a crossroads, where short-term signals might offer trading opportunities, but the longer-term trend remains bearish.
The Macroeconomic Crosscurrents: DXY's Dominance and Central Bank Watch
The performance of GBP/USD cannot be analyzed in isolation. The broader macroeconomic landscape, particularly the actions and pronouncements of central banks, plays a critical role in shaping currency pair movements. Last week saw significant market attention focused on central bank policy expectations, especially concerning the Federal Reserve and the Bank of England (BoE). While the BoE's recent actions and market interpretations have been a significant driver, the Fed's stance remains paramount for dollar strength.
The market has been grappling with the implications of recent economic data. For instance, the UK's labor market data, while showing some mixed signals, has not provided a strong enough catalyst for a sustained GBP rally. Similarly, inflation figures continue to be a key focus for both the BoE and the Fed. Any indication of sticky inflation could lead to prolonged higher interest rates, supporting their respective currencies. The PriceONN market news from the past week highlighted this tension, with reports on 'NZD/USD Eyes 0.59 Amid Narrower Trade Deficit, GBP/USD Soars on BoE Surprise' and 'Will GBP/USD Break Higher After Bank of England's Hawkish Surprise?'. These headlines suggest that while the BoE might have offered some hawkish surprises, the overall narrative is still being shaped by broader dollar strength and global risk sentiment.
The Dollar Index (DXY), currently at 99.25, is a critical barometer. Its daily uptrend, supported by an ADX of 34.64, indicates underlying strength. This dollar strength acts as a headwind for GBP/USD. If the Fed maintains a hawkish stance or if US economic data continues to outperform expectations, the DXY could extend its gains, putting further pressure on the Sterling. Conversely, any signs of softening in the US economy or a dovish pivot from the Fed could provide a much-needed reprieve for GBP/USD, allowing it to challenge higher resistance levels. The interplay between US interest rate expectations and the BoE's policy path will be a key theme to watch in the coming weeks. The market is constantly repricing these expectations based on incoming data, leading to the volatility we are currently observing around the $1.33 level.
Trading Scenarios: Mapping the Path Forward
Given the current technical setup and macroeconomic crosscurrents, we can outline three potential scenarios for GBP/USD:
Bearish Scenario: Downside Acceleration
65% ProbabilityNeutral Scenario: Range-Bound Consolidation
25% ProbabilityBullish Scenario: Short-Covering Rally
10% ProbabilityThe Verdict: Bears in the Driving Seat
The current technical indicators, particularly the daily ADX at 29.92 and the bearish momentum on MACD, strongly favor the bearish scenario. The Stochastic's bullish divergence on the daily chart offers a glimmer of hope for a short-term bounce, but it's not strong enough to override the prevailing trend without further confirmation. The DXY's strength further bolsters the bearish case for GBP/USD. Therefore, the most probable outcome in the near term is a continuation of the downtrend, with bears likely targeting the support levels around $1.32863 and $1.32670. Traders should be looking for opportunities to join the prevailing trend, managing risk carefully around the immediate support and resistance levels. The neutral scenario remains a possibility if the market fails to decisively break lower, leading to a period of consolidation, but the odds currently favor downside continuation.
The Week Ahead: Key Events and Levels to Watch
Economic Calendar – Awaiting Catalysts
The upcoming week holds several key economic events that could provide the necessary catalysts to break the current stalemate in GBP/USD. While specific dates for these events were not provided in the market data, traders will be closely monitoring:
Central Bank Speak: Any further commentary from Federal Reserve officials or Bank of England policymakers regarding inflation, interest rates, and economic outlook will be scrutinized. Unexpected hawkish or dovish remarks could significantly influence the DXY and, consequently, GBP/USD.
Inflation Data: Crucial inflation reports (like CPI or PCE) from both the US and the UK will be paramount. Higher-than-expected inflation could reinforce the case for higher-for-longer interest rates, potentially strengthening the respective currencies. Conversely, falling inflation could signal a pivot, leading to currency weakness.
Employment Figures: Key labor market data, such as Non-Farm Payrolls (NFP) from the US or UK employment reports, will provide insights into economic health. Strong job growth can support a currency, while weak figures may signal economic slowdown.
Geopolitical Developments: Ongoing geopolitical tensions, particularly those impacting energy markets, remain a background risk. Any escalation could lead to a flight to safety, benefiting the US dollar and potentially weighing on GBP/USD, depending on the specific nature of the event and its perceived impact on the UK economy.
Key Levels to Monitor
As we move into the next trading week, the levels discussed previously remain critical:
- Immediate Support: Watch the cluster around $1.33149, $1.33048, and the more significant $1.32863. A break below this zone would confirm the bearish scenario.
- Immediate Resistance: The area between $1.33435 and $1.33721 on the 1-hour chart is the first hurdle. A sustained move above $1.33900 would start to question the bearish outlook.
- Key Daily Levels: Keep an eye on the daily support at $1.32893 and the daily resistance at $1.35105. These represent the broader boundaries of the current market sentiment.
The GBP/USD pair is currently in a precarious position, caught between the strong trend indicated by daily technicals and the conflicting signals from shorter-term oscillators. The dominance of the US dollar, as evidenced by the DXY, remains a significant factor. Traders should approach this market with caution, prioritizing risk management and waiting for clearer directional signals or confirmation through decisive price action at key levels. The current market environment demands patience and discipline, as the path forward for GBP/USD is far from clear-cut. The potential for volatility remains high, driven by upcoming economic data and central bank rhetoric.
📊 Indicator Dashboard
| Indicator | Value | Signal | Interpretation |
|---|---|---|---|
| RSI (14) - 1H | 42.55 | Bearish | Leaning towards selling pressure, but not oversold. |
| Stochastic %K - 1H | 29.29 | Bullish | Suggests a potential short-term bounce. |
| MACD Hist - 1H | Negative | Bearish | Reinforces bearish momentum. |
| ADX - 1D | 29.92 | Strong Trend | Confirms a strong downtrend. |
| Bollinger Bands - 4H | Below Middle Band | Bearish | Indicates downward price pressure. |
| DXY - 1D | 99.25 | Bullish | Dollar strength is a headwind for GBP/USD. |
Key Levels to Watch
Frequently Asked Questions: GBPUSD Analysis
What happens if GBP/USD breaks below the $1.32863 support level?
A decisive close below $1.32863 on the daily chart would invalidate any short-term bullish signals and confirm the continuation of the bearish trend, potentially targeting $1.32670.
Should I consider buying GBP/USD at current levels around $1.33 given the Stochastic's bullish signal?
While the 1-hour Stochastic shows a bullish bias, the overall daily trend remains bearish (ADX 29.92). A cautious approach is advised; look for confirmation like a hold above $1.33435 resistance before considering long positions, with strict risk management.
Is the RSI at 42.55 on the 1-hour chart a sell signal for GBP/USD?
An RSI of 42.55 indicates bearish pressure but is not yet in oversold territory. It suggests sellers are more dominant than buyers at this moment, aligning with the broader bearish trend, but doesn't signal an immediate sell entry on its own.
How will the DXY's strength at 99.25 affect GBP/USD this week?
The DXY's strong daily uptrend at 99.25 acts as a significant headwind for GBP/USD. If the dollar continues to strengthen due to Fed expectations, it will likely cap any upside attempts for GBP/USD and increase the probability of testing lower support levels.
Track markets in real-time
AI-powered analysis, technical indicators and real-time price data.
Join Our Telegram Channel
Breaking market news, AI analysis and trading signals instantly.
Join Channel