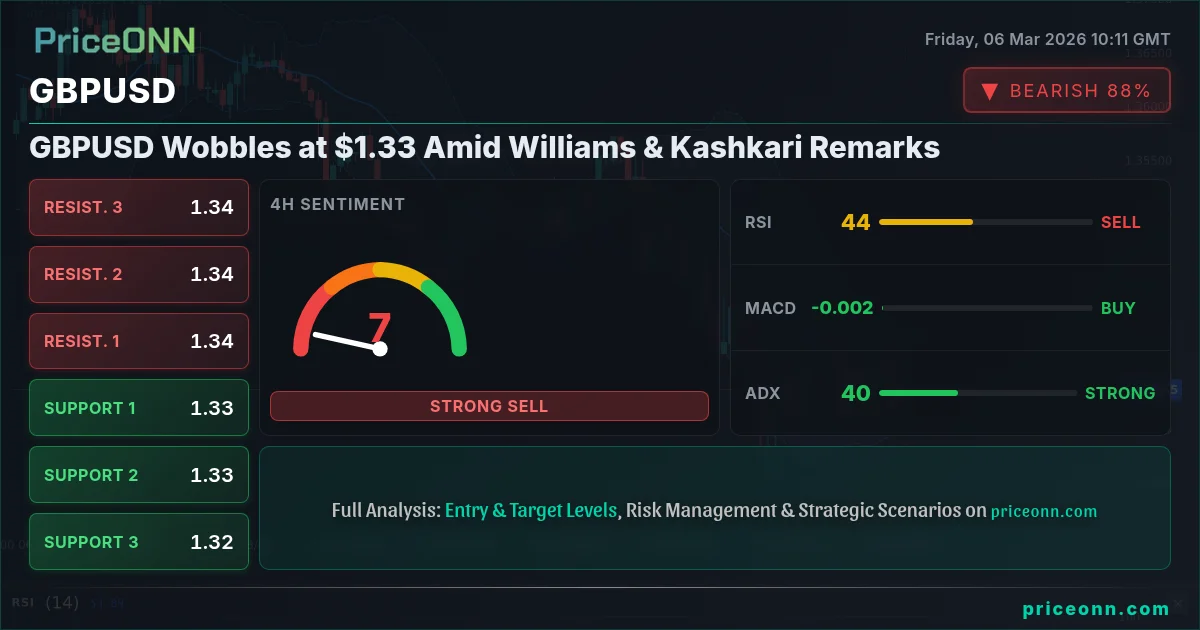
GBPUSD is currently hovering around $1.33, a key level that is proving difficult to breach decisively. This comes amid a backdrop of increasing dollar strength, fueled by recent remarks from Fed officials, notably Williams and Kashkari, hinting at a less dovish stance than previously anticipated. The pair's struggle reflects a broader tension between the Bank of England's (BoE) policy outlook and the evolving expectations for the Federal Reserve's actions.
- RSI at 39.57 on the 1H chart signals potential for further downside momentum.
- GBPUSD faces immediate resistance at 1.33742, a level to watch for bullish reversals.
- Stochastic on the 1H chart indicates a bearish signal, with %K at 48.18 and %D at 76.06.
- DXY strength, currently at 98.94, continues to exert downward pressure on GBPUSD.
The recent ECB monetary policy meeting accounts reveal a Governing Council cautiously optimistic about the Eurozone economy amidst global uncertainty, as reported by forex news outlets. While not directly impacting GBPUSD, this sentiment adds complexity to the broader currency market dynamics. The key focus remains on whether the BoE will maintain its current course or adjust its strategy in response to global economic developments and domestic inflationary pressures.
From a technical standpoint, the 1-hour chart paints a cautious picture. The RSI sits at 39.57, suggesting that there's still room for further downside before reaching oversold territory. The ADX, however, is quite low at 8.81 which is indicative of a weak trend, suggesting that any moves could be short-lived. The Stochastic indicator (K=48.18, D=76.06) also signals a potential downward move, with the %K line below the %D line. These indicators, taken together, suggest that the bears have a slight edge in the short term, but a lack of strong momentum could lead to range-bound trading.
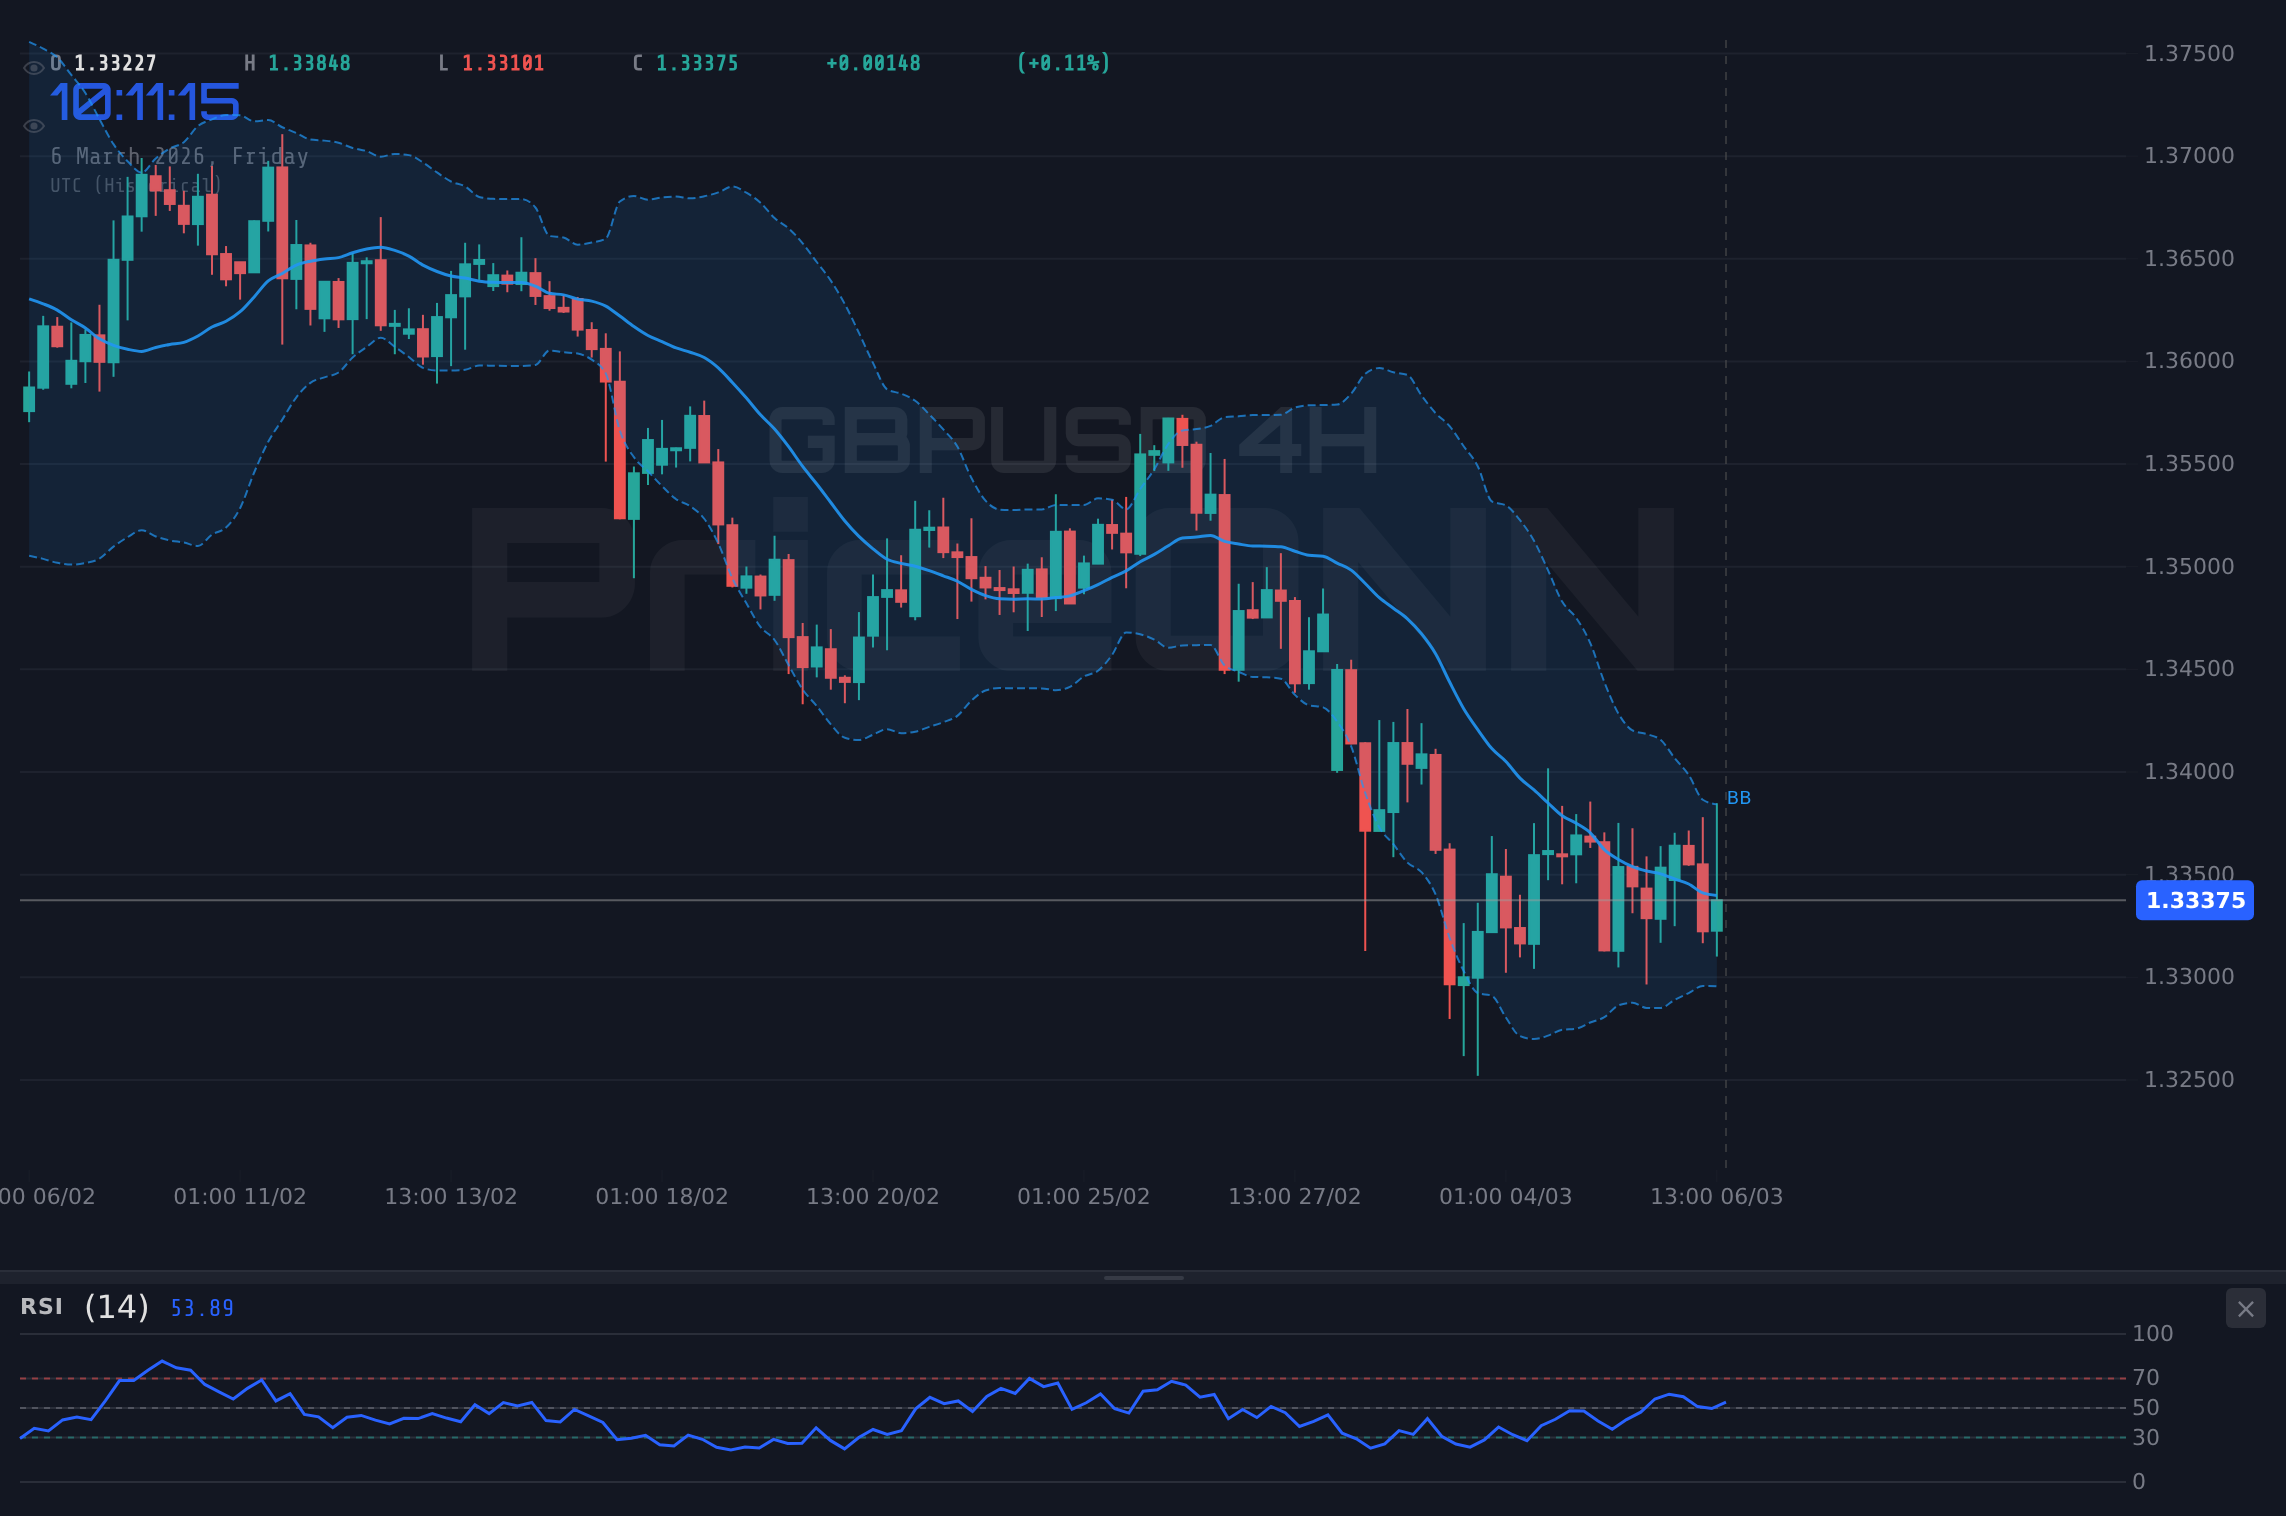
Stepping back to the 4-hour timeframe reveals a similar narrative. The RSI is at 41.27, still in neutral territory but trending downward. The ADX is more significant at 39.28, showing a stronger bearish trend on the 4H timeframe. However, Stochastic is showing a bullish signal with K=56.86 and D=48.88. The tug of war here highlights the short term ambiguity in the GBPUSD market.
Looking at the daily chart, the overall trend for GBPUSD is bearish with a trend strength of 94%. The current price sits below the middle band of the Bollinger indicator, adding further weight to the bearish outlook. The RSI sits at 35.14, suggesting it may soon enter oversold territory. Immediate support can be found at 1.33047, followed by 1.32561 and 1.32156. On the upside, resistance looms at 1.33938, 1.34343 and 1.34829.
With the DXY (Dollar Index) currently at 98.94 and trending upwards, GBPUSD is facing significant headwinds. The dollar's strength is a major factor weighing on the pair, and any further upside in the DXY could exacerbate the downward pressure. Traders should closely monitor the DXY for clues about the future direction of GBPUSD.
GBPUSD macroeconomic factors are crucial in March 2026. The recent weakness in GBPUSD can be attributed to a combination of factors, including dovish bets on the BoE and a strengthening US dollar. The BoE's cautious approach to raising interest rates, coupled with concerns about the UK's economic outlook, has weighed on the pound. At the same time, the US dollar has benefited from safe-haven flows and expectations of further interest rate hikes by the Federal Reserve.
Key levels to watch on the downside include the support at 1.33047. A break below this level could open the door for a test of the next support levels at 1.32561 and 1.32156. On the upside, resistance lies at 1.33938, followed by 1.34343. A sustained move above 1.34343 would be needed to negate the current bearish bias.
Ultimately, the direction of GBPUSD will depend on a complex interplay of factors. The outlook for the UK economy, the BoE's policy decisions, and the strength of the US dollar will all play a role in determining the pair's future trajectory. Traders should carefully monitor these factors and adjust their strategies accordingly.
It's important to remember that technical indicators are not foolproof and should be used in conjunction with other forms of analysis. A holistic approach that considers both technical and fundamental factors is essential for making informed trading decisions.
The ongoing situation in the Middle East also adds a layer of uncertainty to the market. As NZD/USD eyes US jobs data amidst Middle East tensions, risk-off sentiment could spill over into GBPUSD, driving further safe-haven demand for the dollar. Any escalation of geopolitical tensions could lead to increased volatility and unpredictable price swings.
Given the current technical and fundamental backdrop, a cautious approach to GBPUSD is warranted. The pair is facing significant headwinds, and a sustained recovery is unlikely without a significant shift in the underlying dynamics. Traders should remain vigilant and manage their risk accordingly.
Frequently Asked Questions: GBPUSD Analysis
Is GBPUSD a good buy right now?
Given the current price of $1.33, GBPUSD is not an ideal buy right now due to strong downward pressure indicated by bearish signals across multiple timeframes and a strengthening dollar. Traders should wait for a confirmed bullish reversal or a break above the key resistance level of 1.33938 before considering a long position.
What is the GBPUSD price forecast for this week?
The GBPUSD price forecast for this week is bearish, with potential for further downside towards the 1.32561 support level, given the strong bearish trend on the daily chart. A break below this level could lead to a test of the 1.32156 support. Probability of a significant bullish reversal is currently low.
What are the key support and resistance levels for GBPUSD?
Key support levels for GBPUSD are at 1.33047, 1.32561, and 1.32156. Key resistance levels are at 1.33938, 1.34343, and 1.34829. These levels represent potential areas of price reversal or continuation, and should be monitored closely by traders.
Why is GBPUSD moving today?
GBPUSD is primarily moving due to a strengthening US dollar, influenced by hawkish comments from Fed officials Williams and Kashkari. This is compounded by existing concerns about the UK's economic outlook and the BoE's cautious approach to raising interest rates, further pressuring the pair.
Technical Outlook Summary
| Indicator | Value | Signal |
|---|---|---|
| RSI (14) | 35.14 | Bearish |
| MACD Histogram | Negative | Bearish |
| Stochastic | 30.72 | Neutral |
| ADX | 28.82 | Strong Trend |
| Bollinger | Lower Band | Watch |
Track markets in real-time
AI-powered analysis, technical indicators and real-time price data.
Join Our Telegram Channel
Breaking market news, AI analysis and trading signals instantly.
Join Channel