I'm watching GBPUSD closely at $1.33668. The bears seem to be gaining momentum, but is this a sustainable move or a temporary dip? The next few hours will be critical.
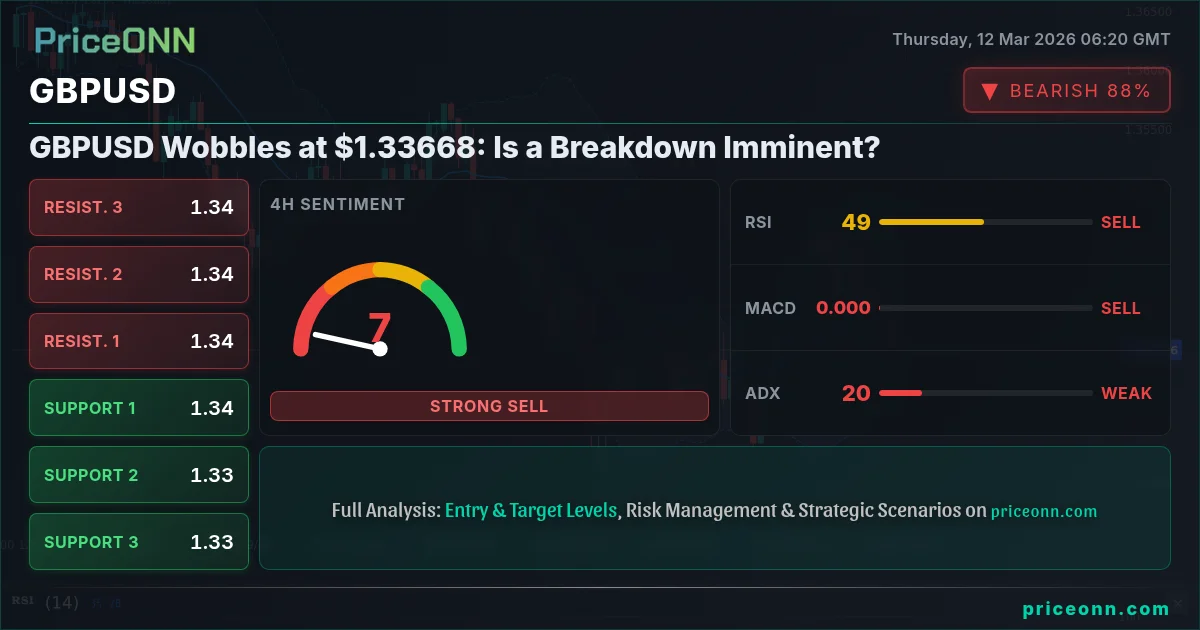
The British Pound is under pressure against the US Dollar, with GBPUSD currently trading at $1.33668. The pair has been trending downwards, and technical indicators suggest that the bearish momentum may continue. The question now is whether the support levels can hold, or if we are about to witness a significant breakdown.
Why the Bears Are Pressing GBPUSD
Several factors are contributing to the bearish sentiment surrounding GBPUSD. First, the US Dollar has been strengthening, as evidenced by the DXY index, which currently sits at 99.21, up 0.33% on the day. A stronger dollar typically puts pressure on other currencies, including the Pound. As the DXY shows a strong upward trend in the 1H, 4H, and 1D timeframes, the dollar strength seems poised to continue.
Second, the economic outlook for the UK remains uncertain. While the latest GDP figures were positive, there are concerns about inflation and the potential for further interest rate hikes by the Bank of England. Traders are weighing persistent US inflation data which is putting some pressure on GBPUSD around the 1.34 level, according to recent news.
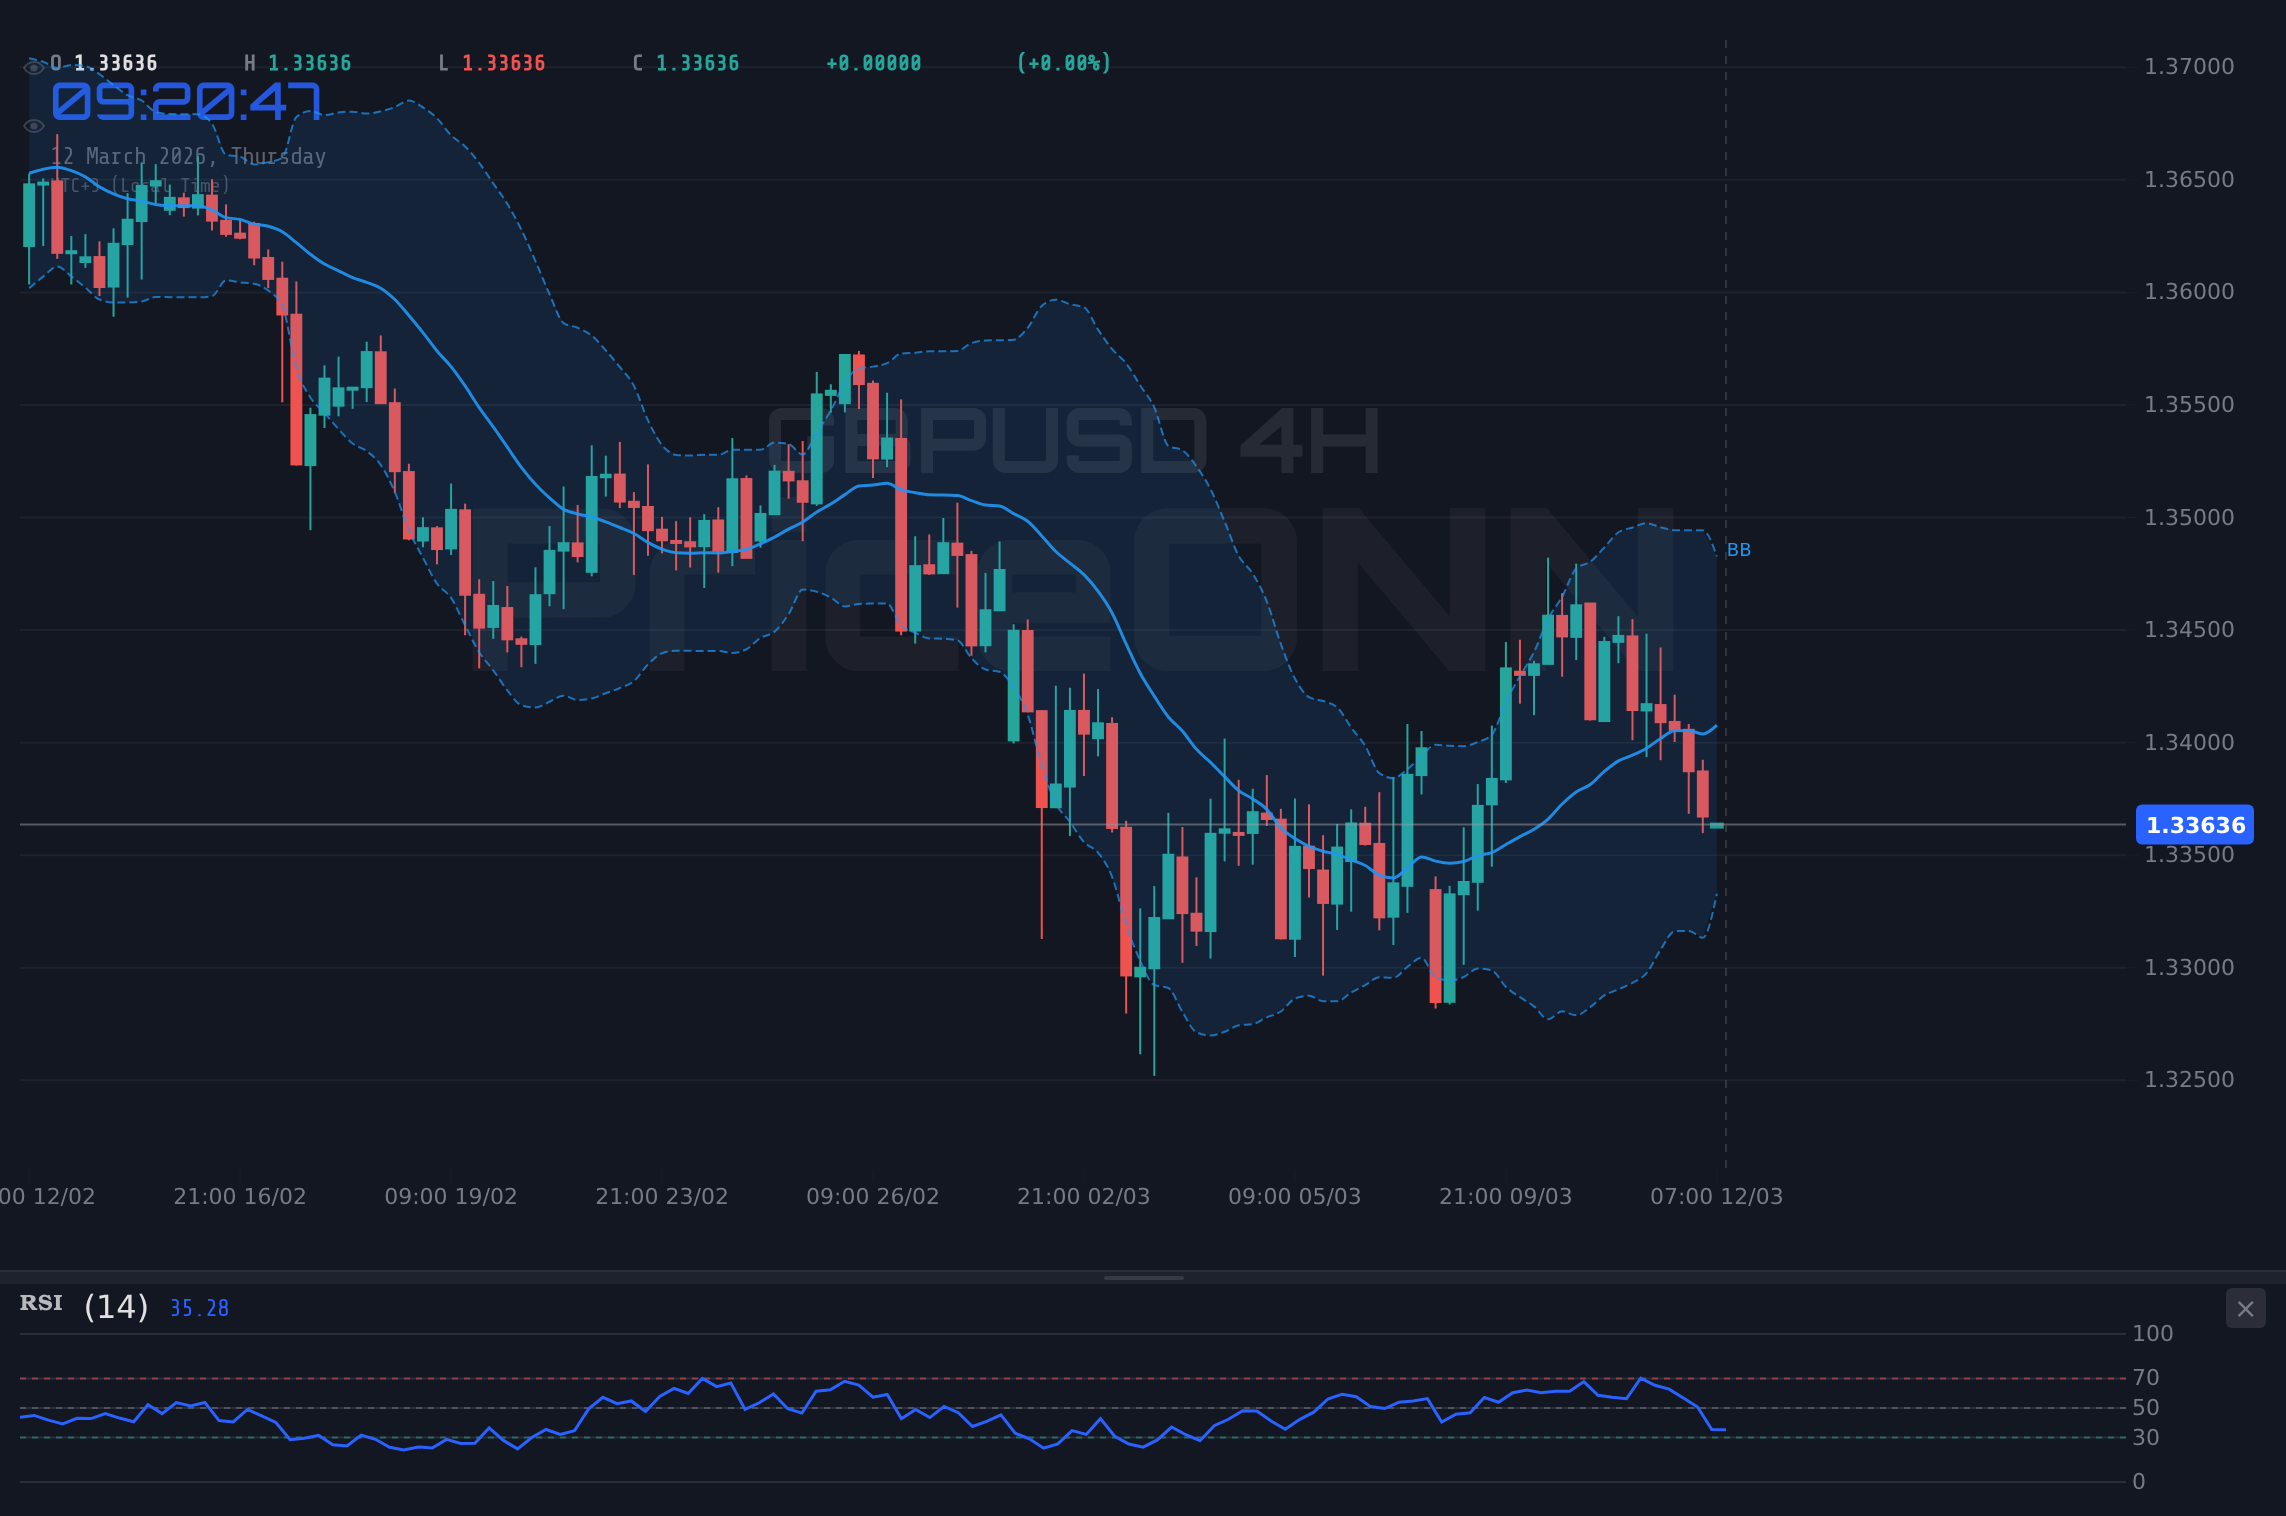
Third, technical indicators are painting a bearish picture. On the 1H chart, the RSI is at 35.99, suggesting that the pair is not yet oversold, leaving room for further downside. The MACD is also in negative territory, confirming the bearish trend. The ADX at 24.77 indicates a medium-strength downtrend, suggesting that the current move has some legs.
Key Levels to Watch
For the bears, the immediate target is the support level at 1.3357. A break below this level could trigger a sharp sell-off, with the next support level at 1.33527. If that level fails to hold, we could see GBPUSD testing the 1.33455 level, according to the 1H data.
On the upside, the first resistance level is at 1.33685. A break above this level would be a positive sign for the bulls, but they would need to overcome further resistance at 1.33757 to regain control. A solid break and hold above 1.338 would signal a potential shift in momentum.
Economic Data on the Horizon
The economic calendar is relatively light today, but traders are already looking ahead to Friday, March 13th, when the UK will release its latest GDP figures. A stronger-than-expected reading could provide a boost to the Pound, while a weaker-than-expected reading could exacerbate the bearish pressure. The previous GDP was 0.1, so any deviation from that will likely cause volatility. The US also releases employment figures on Friday, which will impact the DXY and indirectly affect GBPUSD.
The market's reaction to this data will be crucial in determining the short-term direction of GBPUSD. Pay close attention to the actual figures versus the forecasts, and be prepared for potential volatility spikes.
Bearish Scenario: Breakdown Below Support
The bearish scenario hinges on a sustained break below the 1.3357 support level. If the bears can push the price below this level and hold it there, we could see a rapid move towards the next support levels at 1.33527 and potentially 1.33455. This scenario is supported by the negative momentum on the MACD and the relatively low RSI, which suggests that the pair is not yet oversold.
A key trigger for this scenario would be negative news out of the UK or a further strengthening of the US Dollar. Keep an eye on any headlines that could impact market sentiment.
Bullish Scenario: A Reversal at Current Levels
The bullish scenario depends on the ability of the bulls to defend the 1.3357 support level. If they can hold this level, we could see a bounce towards the first resistance level at 1.33685. A break above this level would be a positive sign, but the bulls would need to overcome further resistance at 1.33757 and 1.338 to regain control. This scenario would be supported by any positive news out of the UK or a weakening of the US Dollar.
A potential trigger for this scenario could be better-than-expected economic data or a shift in market sentiment. Watch for any signs of a reversal in the DXY, which could provide a boost to the Pound.
Risk Management is Key
Given the uncertainty surrounding GBPUSD, it is crucial to manage your risk carefully. Use stop-loss orders to protect your capital, and avoid over-leveraging your positions. Remember that the market can be unpredictable, and it is always better to err on the side of caution.
Frequently Asked Questions: GBPUSD Analysis
What happens if GBPUSD breaks below 1.3357 support?
A break below the 1.3357 support level could trigger a sharp sell-off, potentially leading to the next support levels at 1.33527 and 1.33455 being tested. The bearish momentum could intensify, especially if accompanied by negative news or dollar strength.
Should I sell GBPUSD at current levels of $1.33668 given the RSI at 35.99?
The RSI at 35.99 suggests that GBPUSD is not yet oversold, indicating potential for further downside. While not a definitive sell signal, it supports a bearish bias, especially if combined with other bearish indicators like the MACD and a strengthening dollar. Manage risk with a stop-loss above a recent high.
Is the negative MACD signal reliable for GBPUSD trend analysis?
The negative MACD signal confirms bearish momentum, but it's essential to consider it in conjunction with other indicators and price action. A sustained negative MACD reading, combined with a break below key support, would strengthen the bearish case.
How will Friday's UK GDP data affect GBPUSD this week?
Friday's UK GDP data is a key catalyst. A stronger-than-expected reading could boost the Pound, while a weaker-than-expected reading could exacerbate the bearish pressure. The market's reaction will depend on the actual figures versus forecasts.
Having tracked GBPUSD through the 2024 rate cycle, I've seen this pattern before. Historically, when the 1H RSI reaches this zone on GBPUSD, the outcome has often been a continuation of the downtrend. Amid the current DXY strength and risk-off environment, the path of least resistance appears to be lower for GBPUSD.
Track markets in real-time
AI-powered analysis, technical indicators and real-time price data.
Join Our Telegram Channel
Breaking market news, AI analysis and trading signals instantly.
Join Channel