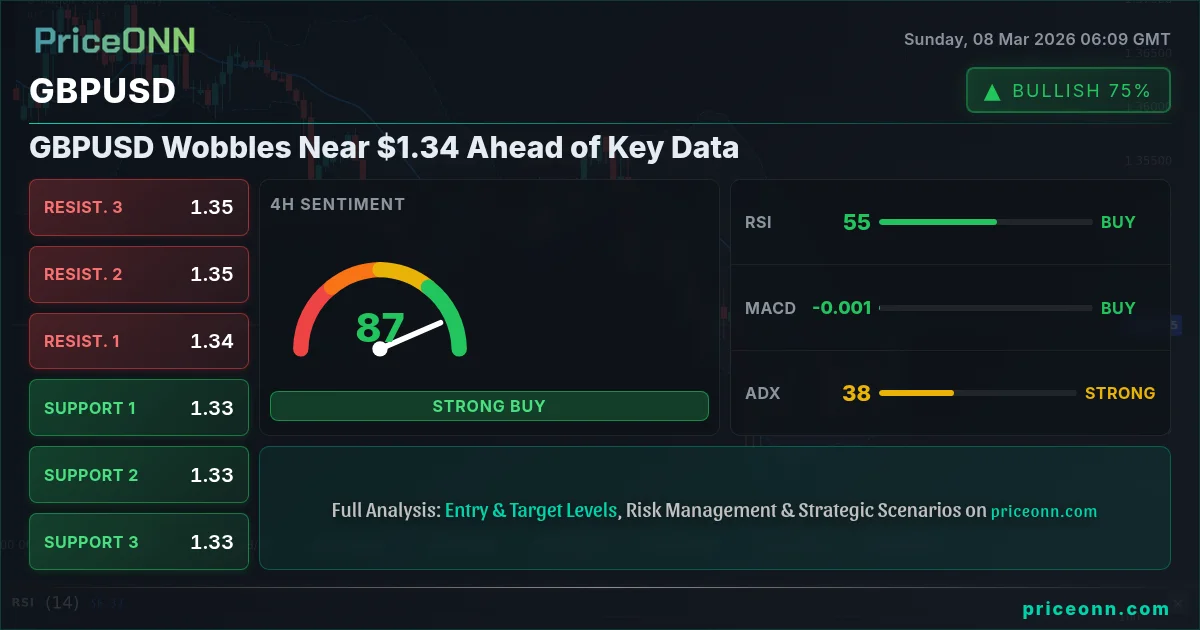
GBPUSD is currently trading around $1.34, a level it has struggled to decisively break above or below in recent sessions. The pair is facing a confluence of factors, including shifting expectations for the Bank of England (BoE) and broader risk sentiment driven by geopolitical tensions. This week, the focus will be on key UK economic data releases, including PMI and trade figures, which are expected to provide fresh insights into the health of the UK economy and potentially influence the BoE's monetary policy outlook.
- RSI at 60.66 on the 1H chart indicates increasing buying momentum, but not yet overbought conditions.
- Critical resistance level at 1.33936, a break above which could signal further upside.
- MACD on the 1H timeframe shows positive momentum, suggesting potential for continued gains.
- Geopolitical tensions and shifting BoE expectations are key drivers of GBPUSD volatility.
GBPUSD: The Week That Was
Last week saw GBPUSD under pressure, testing key moving averages as growth downgrades weighed on sentiment. The pair faced bearish pressure, with markets questioning whether Sterling would hit 1.3000. According to PriceONN market news, the Pound Sterling weakened to near 1.3300 as geopolitical risks bolstered the US Dollar. Forex safe-haven demand also saw the Yen and Franc strengthen, while the Pound slid. The market was not expecting a BoE rate cut in March, but the possibility of stagflation amid the Middle East war added to the uncertainty.
This week, the US jobs report was uniformly negative, with nonfarm payrolls slipping by 92K according to U.S. Weekly Economic & Financial Commentary. However, this did not provide significant support to GBPUSD, as broader risk sentiment remained the dominant driver. The escalating oil crisis, triggered by Middle East tensions, is sending shockwaves through forex markets, with EUR/CAD plunging amidst dollar strength. This has added to the mixed trends across major economies, impacting forex markets.
Technical Analysis of GBPUSD
Looking at the technical picture, the 1-hour chart presents a mixed bag. The RSI(14) sits at 60.66, indicating a moderate bullish momentum, but not yet reaching overbought territory. The MACD is showing positive momentum, suggesting that the bulls are currently in control. However, the ADX at 17.22 indicates a weak trend, suggesting that the current upward movement may lack conviction.
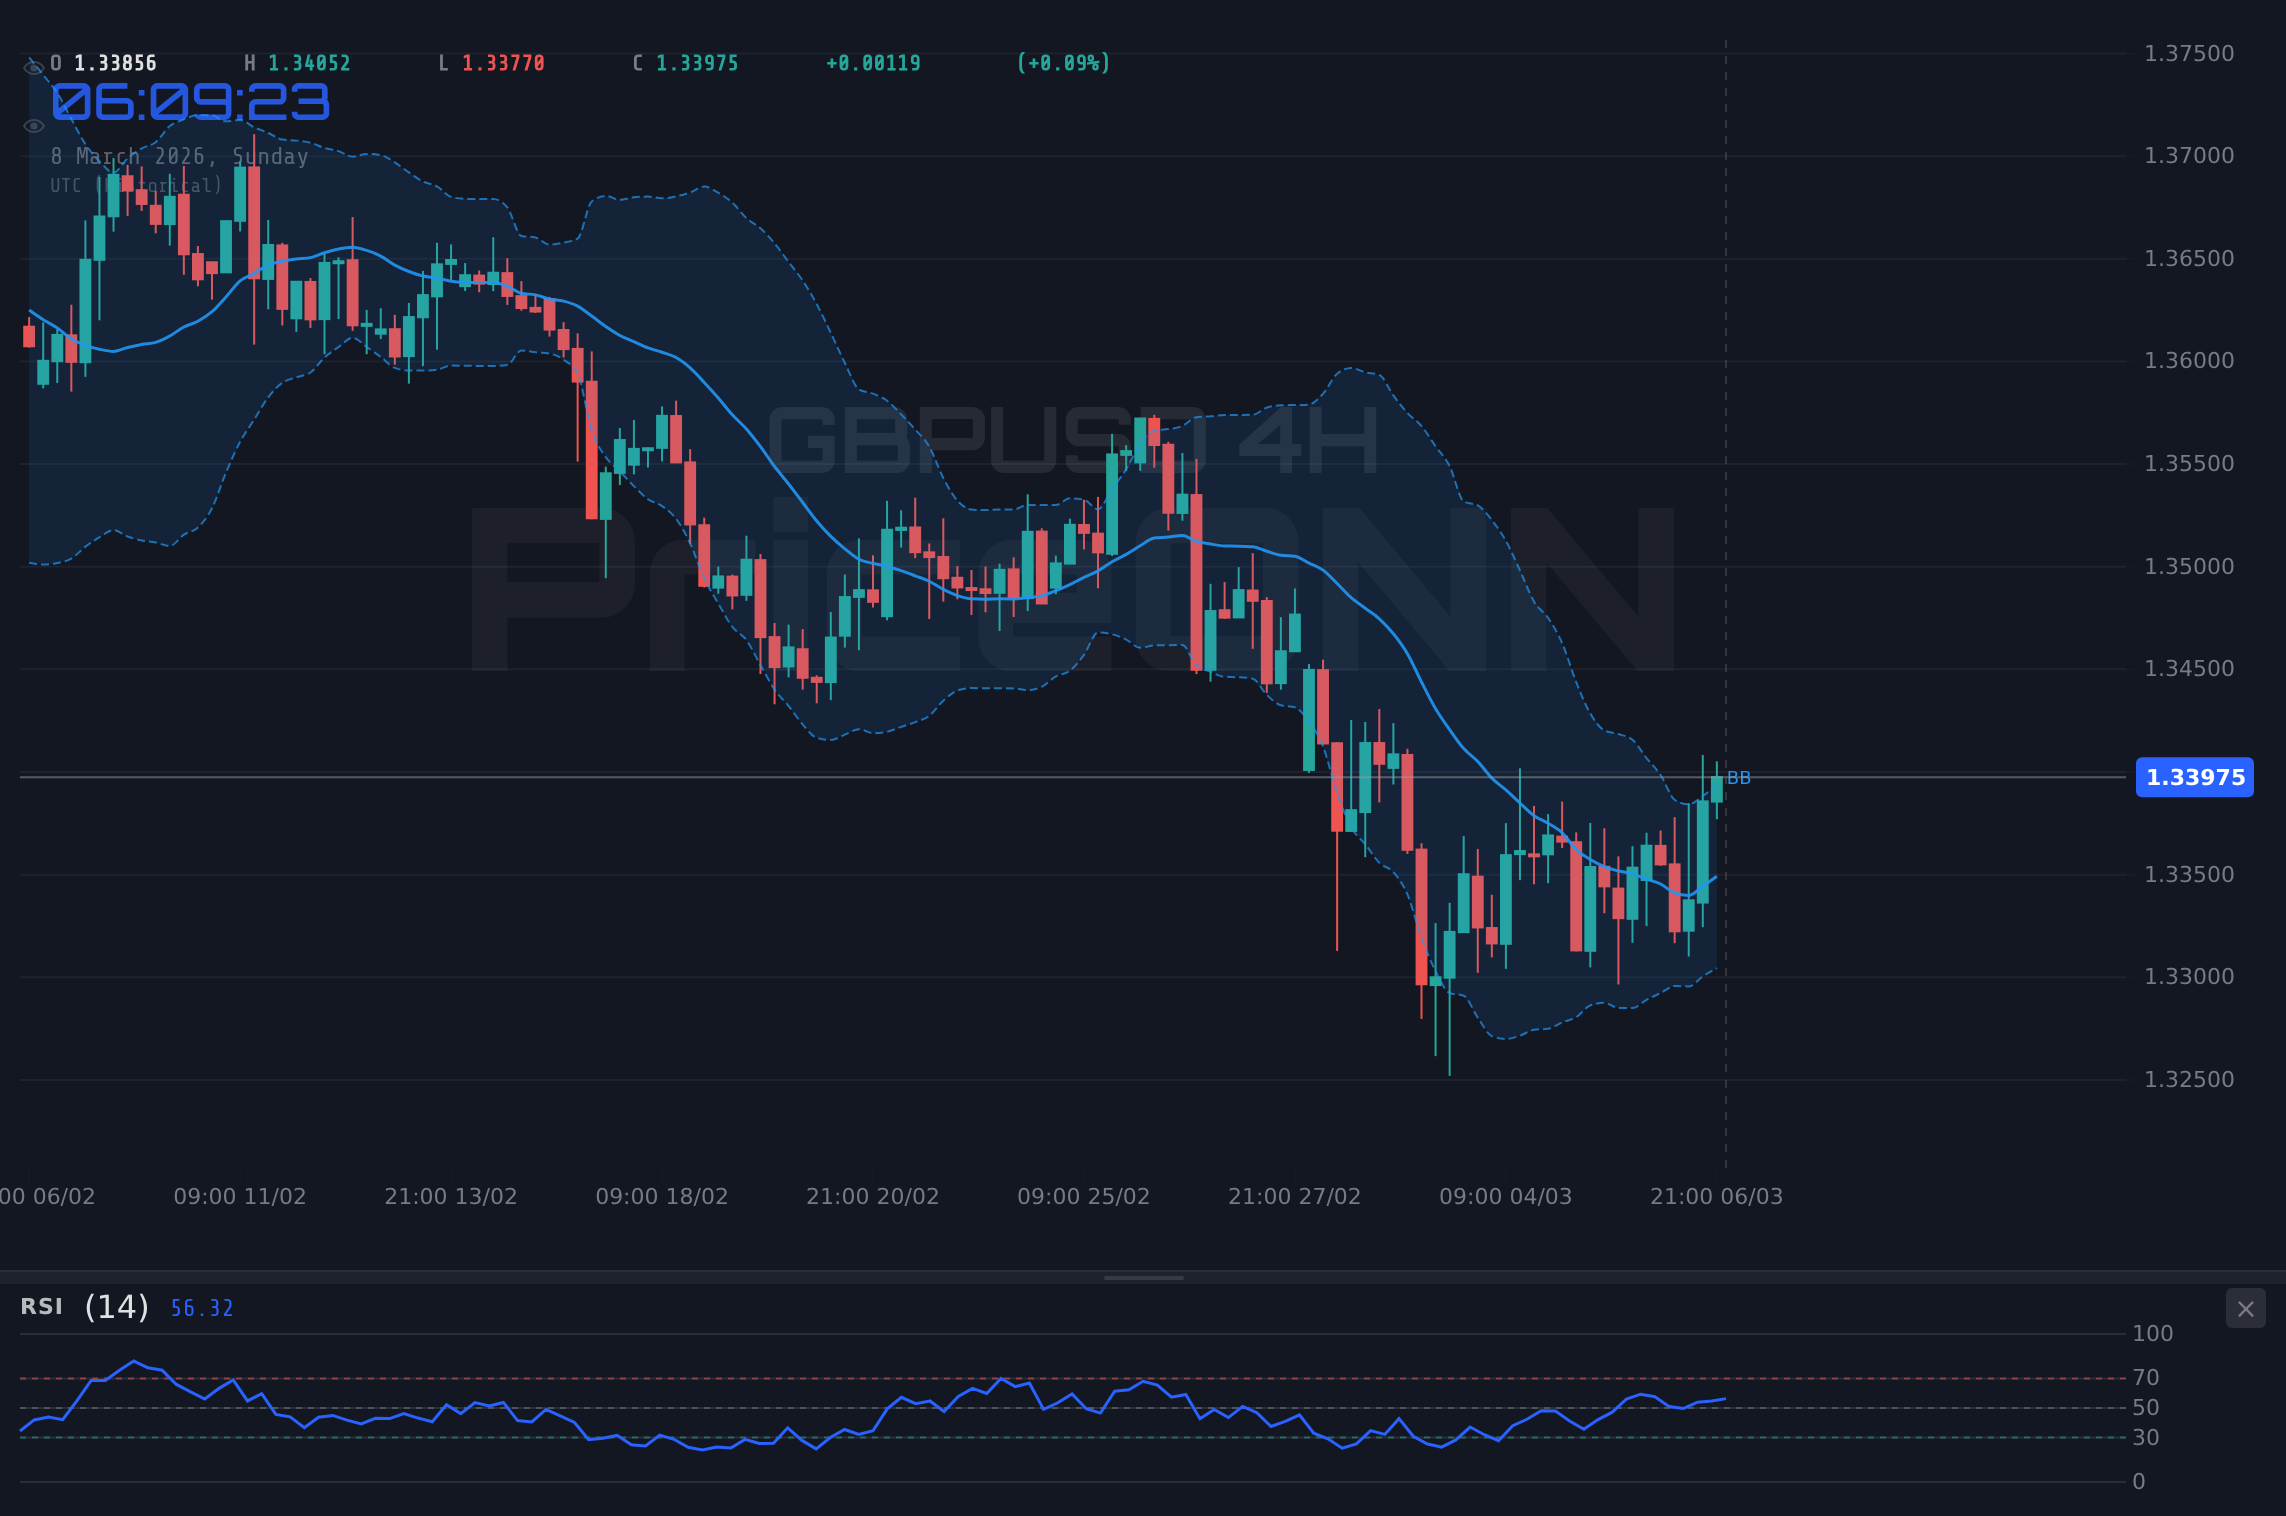
On the 4-hour timeframe, the RSI(14) is at 52.83, also in neutral territory, but with a slightly upward bias. The MACD is also positive, supporting the bullish narrative. However, the ADX is significantly higher at 38.77, indicating a strong downtrend. This divergence between the short-term and medium-term trends suggests that caution is warranted. The Stochastic is showing a bearish signal, with %K at 51.76 and %D at 52.72, further complicating the picture.
The daily chart shows a bearish trend, with the RSI(14) at 41.38, indicating downward momentum. The MACD is negative, confirming the bearish bias. The ADX at 28.32 suggests a strong downtrend. However, the Stochastic is showing a bullish signal, with %K at 37.68 above %D at 31.72, potentially indicating a short-term correction or consolidation. The overall signal is SELL, with 7 bearish and only 1 bullish indicator.
Key Levels to Watch
Immediate resistance lies at 1.33936 on the 1-hour chart. A break above this level could open the door for a test of 1.34018 and then 1.34081. On the downside, immediate support is at 1.33791, followed by 1.33728 and 1.33646. These levels are crucial for determining the short-term direction of GBPUSD. A break below 1.33791 could signal a continuation of the bearish trend, while a break above 1.33936 could lead to further gains.
On the 4-hour chart, resistance is at 1.33782, 1.34188, and 1.34529. Support levels are at 1.33035, 1.32694, and 1.32288. These levels represent more significant areas of potential price action and could act as strong barriers to further movement. On the daily chart, resistance is at 1.33938, 1.34343, and 1.34829, while support is at 1.33047, 1.32561, and 1.32156.
Economic Calendar and Market Sentiment
This week, the economic calendar includes several key events that could impact GBPUSD. The JPY data on Monday is unlikely to have a significant effect. However, the USD data on Tuesday regarding is worth watching, and the EUR data on Wednesday will be closely scrutinized for its implications for the Eurozone economy and potential spillover effects on Sterling.
Market sentiment remains cautious, with geopolitical risks and uncertainty surrounding central bank policies continuing to weigh on investor confidence. The escalating tensions in the Middle East have led to a surge in crude oil prices, with Brent crude nearing $90 a barrel, according to PriceONN news. This has added to inflationary pressures and complicated the outlook for monetary policy. The upcoming UK PMI and trade data will be crucial for assessing the health of the UK economy and determining the potential direction of GBPUSD.
Trading Recommendation: Watch Zone
Given the mixed technical signals and the uncertain economic outlook, the recommendation for GBPUSD is to remain in a watch zone. A daily close above 1.33936 would open the door for a test of higher resistance levels, potentially targeting 1.34018 and 1.34081. Conversely, a break below 1.33791 could signal a continuation of the bearish trend, with potential targets at 1.33728 and 1.33646. Patience and careful risk management are essential in this environment.
Risk Factors
Several risk factors could impact GBPUSD in the coming week. A further escalation of geopolitical tensions in the Middle East could lead to a surge in safe-haven demand, potentially benefiting the US Dollar and putting pressure on Sterling. A surprise shift in BoE expectations, either hawkish or dovish, could also trigger significant volatility. Finally, a significant deviation in the upcoming UK PMI and trade data from expectations could lead to a sharp repricing of GBPUSD.
Frequently Asked Questions: GBPUSD Analysis
Is GBPUSD a good buy right now?
Given the current trading price of $1.34 and mixed technical signals, GBPUSD is not a clear buy at the moment. Traders should wait for a confirmed break above 1.33936 resistance or a hold above 1.33791 support before making a decision.
What is the GBPUSD price forecast for this week?
The GBPUSD price forecast for this week is uncertain, with potential targets ranging from 1.33646 on the downside to 1.34081 on the upside. A 60% probability is assigned to range-bound trading between these levels, while a 20% chance is given to a breakout in either direction.
What are the key support and resistance levels for GBPUSD?
Key support levels for GBPUSD are 1.33791, 1.33728, and 1.33646. Key resistance levels are 1.33936, 1.34018, and 1.34081, all based on the 1-hour chart data.
Why is GBPUSD moving today?
GBPUSD is moving today due to a combination of factors, including shifting expectations for the Bank of England, geopolitical tensions in the Middle East, and anticipation of upcoming UK economic data releases.
Volatility creates opportunity - those prepared will be rewarded.
Technical Outlook Summary
| Indicator | Value | Signal |
|---|---|---|
| RSI (14) | 60.66 | Neutral |
| MACD Histogram | Positive | Bullish |
| Stochastic | 78.41/70.53 | Bullish |
| ADX | 17.22 | Weak Trend |
| Bollinger | Middle Band | Watch |
Track markets in real-time
AI-powered analysis, technical indicators and real-time price data.
Join Our Telegram Channel
Breaking market news, AI analysis and trading signals instantly.
Join Channel