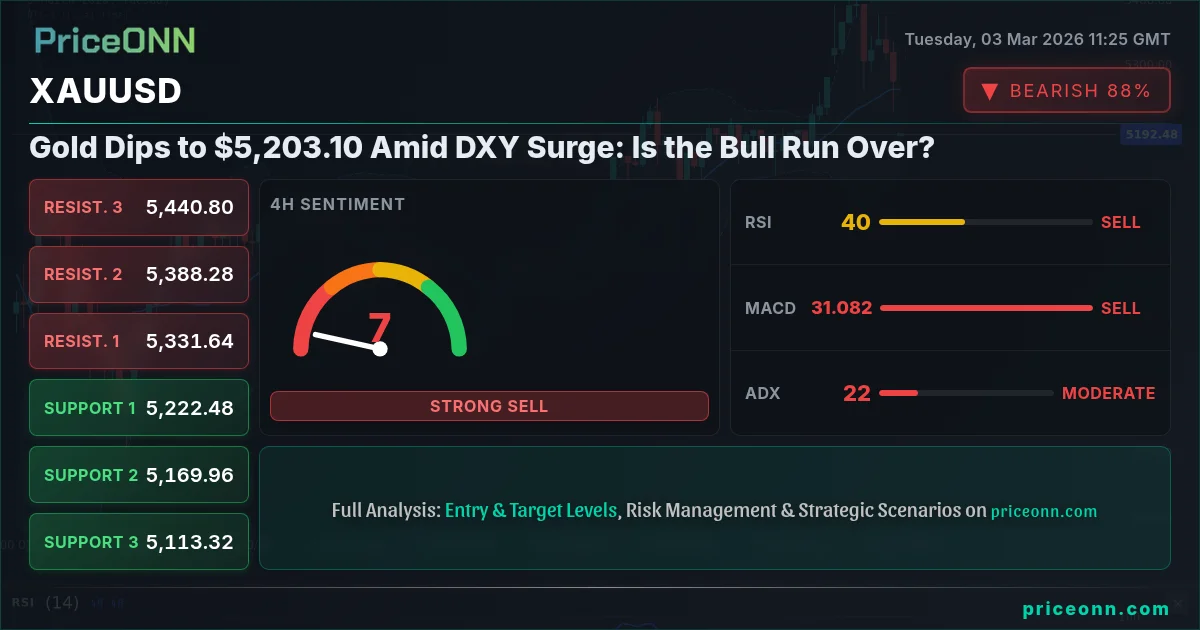
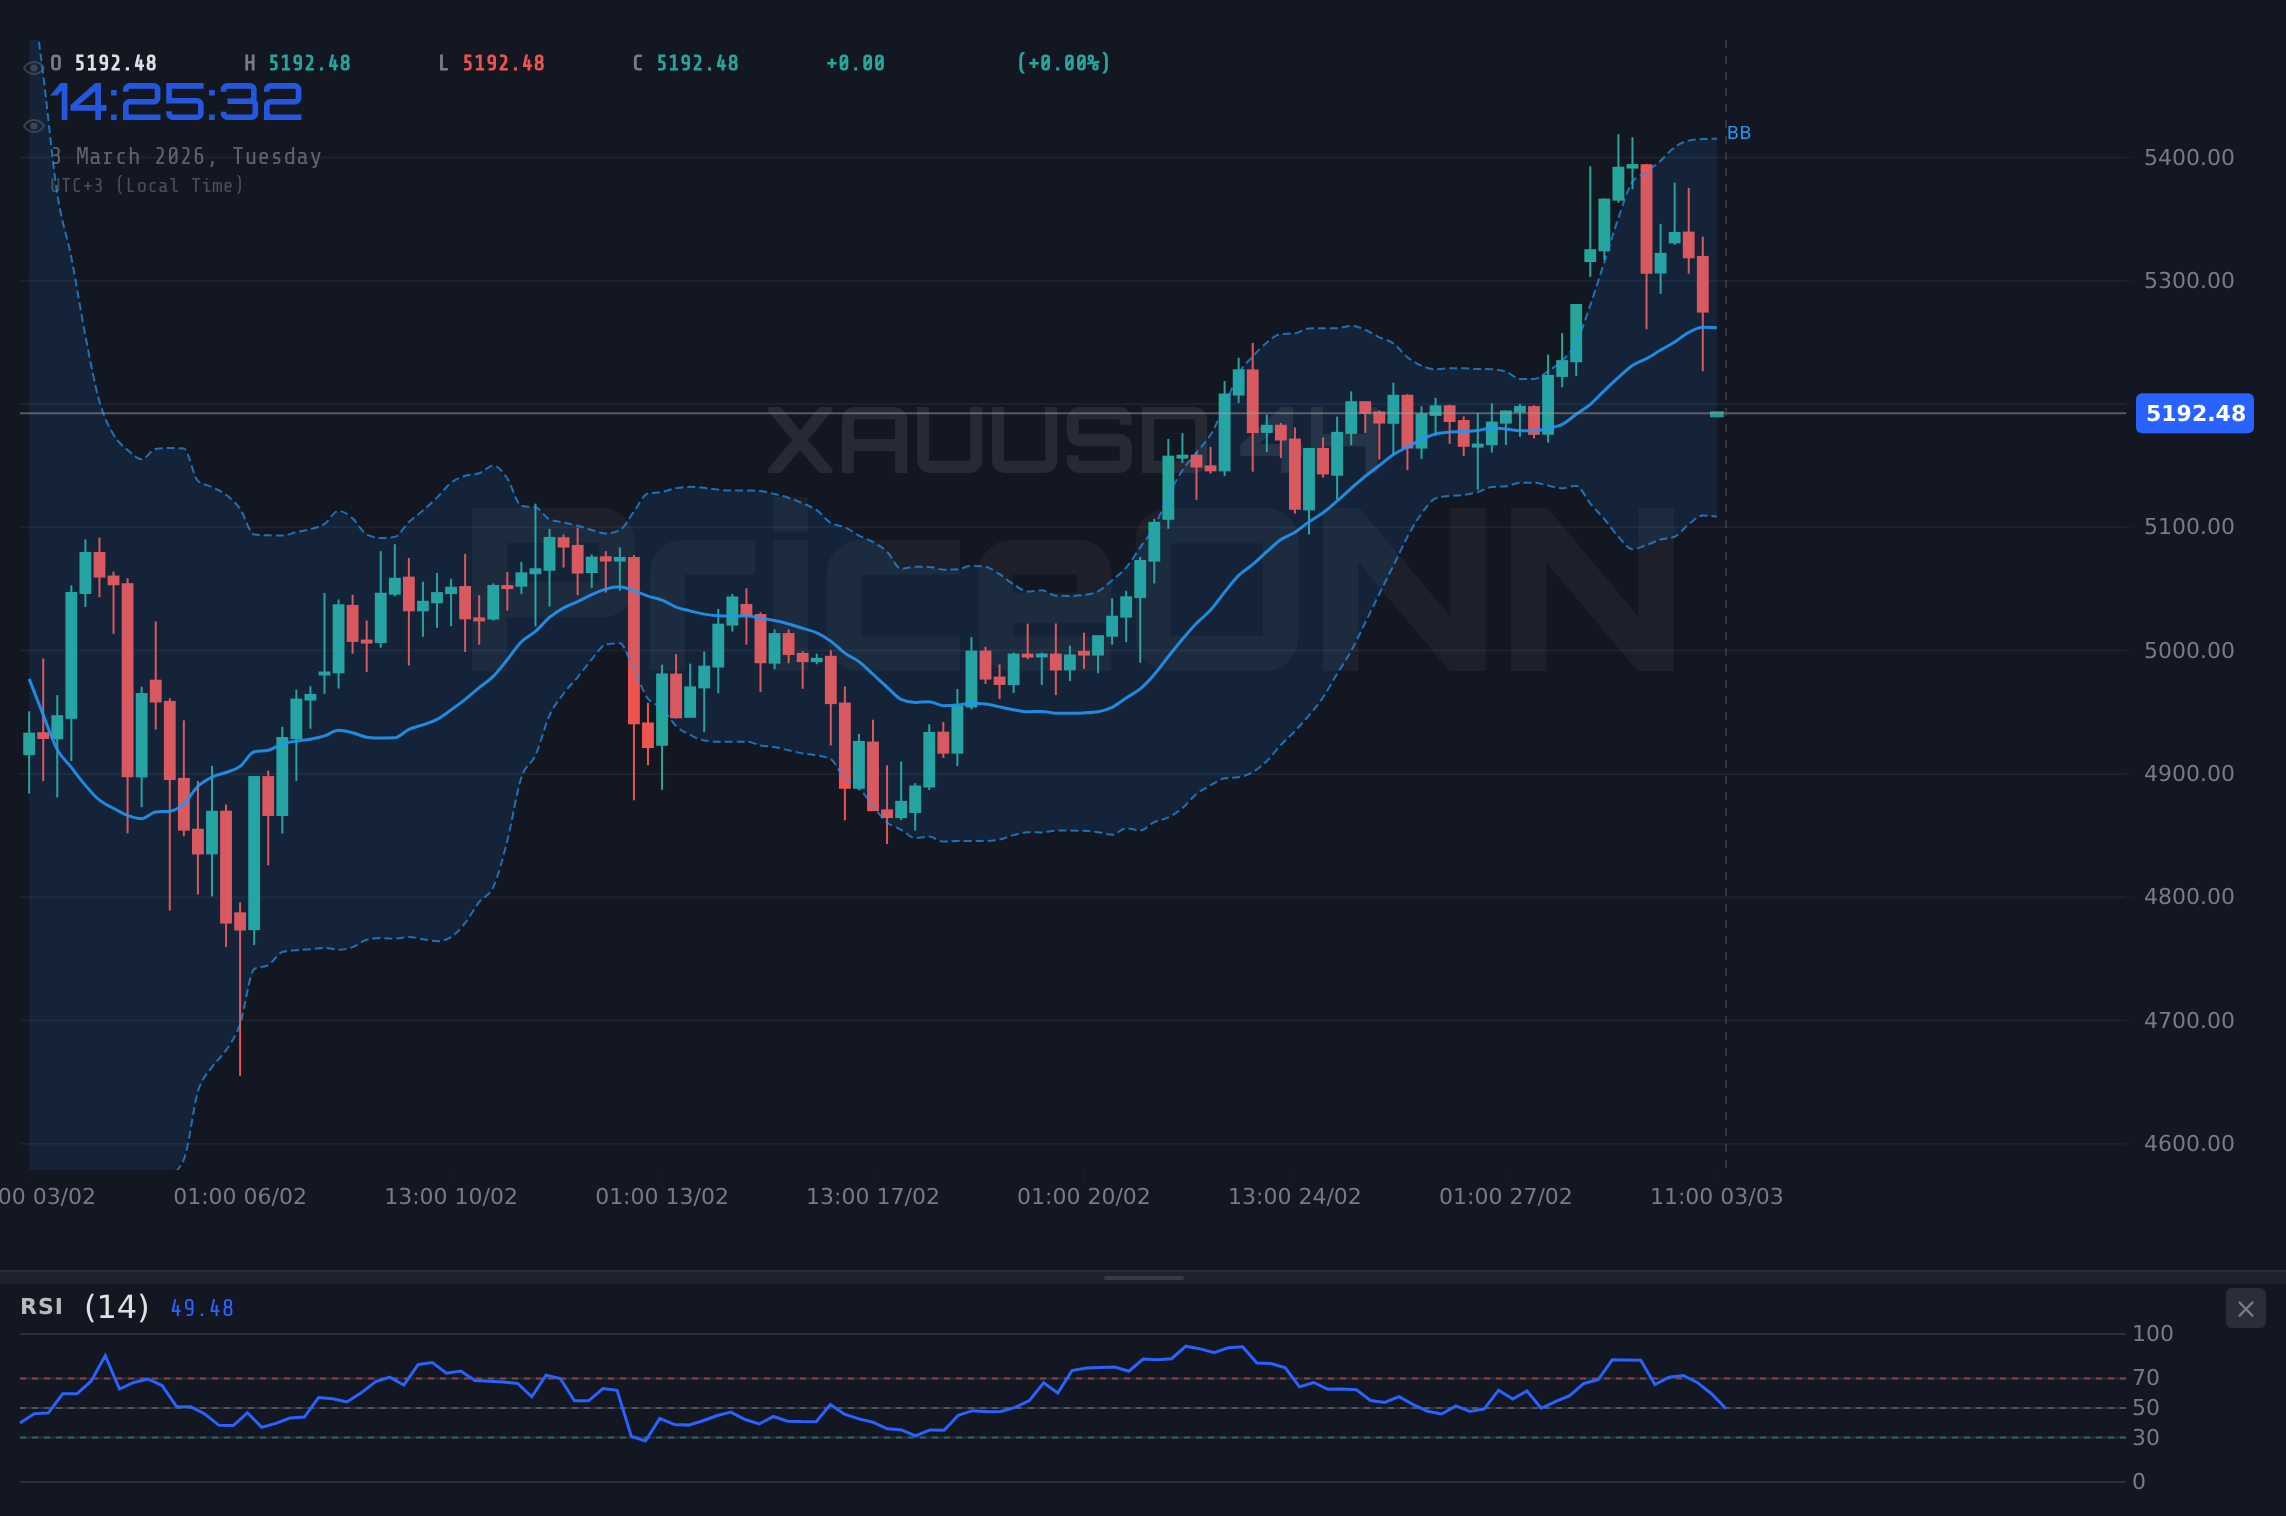
The Dollar Index (DXY) has surged past 98.70 amid escalating tensions in the Middle East, sending shockwaves through commodity markets. This flight to safe-haven assets has ironically put downward pressure on gold, which currently trades at $5,203.10. But is this a temporary dip or a sign of deeper troubles for the precious metal?
- XAUUSD dips to $5,203.10 as DXY strengthens on geopolitical tensions.
- Key support at $5,175.52 must hold to maintain bullish momentum.
- RSI at 29.27 on the 1H chart signals oversold conditions, hinting at a potential rebound.
- Upcoming U.S. ADP Nonfarm Employment Change data on Wednesday could influence the Fed's policy outlook and gold's direction.
The inverse correlation between gold and the dollar is playing out in full force. With the DXY at 99.04, showing a robust 0.82% daily gain, gold is struggling to maintain its upward trajectory. This is a classic safe-haven tug-of-war: while geopolitical tensions typically boost gold, dollar strength is currently overshadowing this effect.
From a technical perspective, XAUUSD is at a critical juncture. The 1-hour chart shows a neutral trend, but the RSI of 29.27 suggests the metal is oversold and could be poised for a short-term bounce. However, the MACD remains negative, indicating that bearish momentum is still in play. The ADX at 25.96 on the 1H chart confirms a strong downtrend currently. This is exactly where patience will be rewarded. Manage your risk, wait for your setup- the market always gives a second chance.
Why $5,175.52 is the Line in the Sand
The daily chart paints a more bullish picture, with an overall uptrend and a 90% strength rating. However, the stochastic indicator shows a potential downturn, with K=78.51 and D=84.37 signaling a possible pullback. Key support lies at $5,248.67, $5,175.52, and $5,090.41. The $5,175.52 level is particularly crucial; a break below this could signal a more significant correction. Look, this level is absolutely critical-
If you're a day trader, now might be the time to look at key support and resistance levels. If you're a swing trader, you may want to keep an eye on how the price action is going to play out at these levels. For long-term investors, these dips might be an opportunity to add to their positions.
On the upside, resistance levels are at $5,406.93, $5,492.04, and $5,565.19. Clearing the $5,406.93 mark could reignite bullish sentiment. However, given the current dollar strength and overall market uncertainty, breaking through these levels will require a significant catalyst.
A sustained break below $5,175.52 could trigger a cascade of stop-loss orders, leading to a rapid decline toward $5,090.41. Traders should exercise caution and manage their positions accordingly.
Geopolitical Tensions and Safe-Haven Demand
Escalating tensions in the Middle East are undoubtedly a significant factor influencing gold prices. The recent surge in the Dollar Index, as reported by Forex News, is directly linked to these geopolitical uncertainties. As investors seek safe-haven assets, the dollar benefits, putting downward pressure on gold. This is exactly where you need to pay attention. But remember, markets are cyclical; every downturn plants seeds for the next rally.
According to Reuters, the Fed remains vigilant about inflation, which could impact interest rate decisions and, consequently, gold prices. Higher interest rates tend to strengthen the dollar, further weighing on gold. That said, the market has already priced in many of those rate expectations. The upcoming U.S. ADP Nonfarm Employment Change data on Wednesday will provide further clues about the strength of the labor market and the Fed's likely course of action. This could significantly influence gold's direction. If the ADP report shows a strong labor market, expect more dollar strength and downward pressure on gold. If it's weak, gold could catch a bid.
What the Technicals Tell Us About XAUUSD's Next Move
The 4-hour chart mirrors the bearish sentiment, with a neutral trend and an RSI of 44.85. The MACD is negative, and the stochastic oscillator signals a downward trend. Key support levels on this timeframe are $5,291.4, $5,263.77, and $5,221.82. Resistance lies at $5,360.98, $5,402.93, and $5,430.56. The ADX at 21.67 showing moderate trend strength. With disciplined risk management, these choppy waters can be navigated safely.
Now this is where it gets interesting! The daily chart still holds a bullish bias, but the stochastic oscillator is flashing warning signs. This divergence between timeframes suggests a period of consolidation or a potential pullback before the uptrend resumes. Patient investors always find opportunities- the key is waiting for the right moment.
Gold Price Analysis Today: The Verdict
While the long-term outlook for gold remains positive, the short-term picture is clouded by dollar strength and geopolitical uncertainty. The key level to watch is $5,175.52. A sustained break below this could trigger a more significant correction. On the upside, clearing $5,406.93 would signal a resumption of the uptrend. Until the ADP data resolves this, caution is warranted. Be bold when the market is fearful, cautious when euphoric- this golden rule applies today.
Key Levels
Support Levels
Resistance Levels
Technical Outlook Summary
| Indicator | Value | Signal |
|---|---|---|
| RSI (14) | 29.27 | Oversold |
| MACD Histogram | Negative | Bearish |
| Stochastic | 78.51/84.37 | Downturn |
| ADX | 25.96 | Strong Trend |
| Bollinger | Alt Band | Watch |
Frequently Asked Questions: XAUUSD Analysis
Is XAUUSD a good buy right now?
At $5,203.10, XAUUSD is currently testing a key support level. A break below $5,175.52 could signal further downside, so caution is warranted. However, oversold conditions suggest a potential short-term bounce, making it a potential buy for aggressive traders.
What is the XAUUSD price forecast for this week?
The XAUUSD price forecast for this week is highly dependent on upcoming economic data and geopolitical developments. A break above $5,406.93 could lead to further gains, while a sustained move below $5,175.52 could trigger a deeper correction. Expect volatility and trade accordingly.
What are the key support and resistance levels for XAUUSD?
Key support levels for XAUUSD are $5,248.67, $5,175.52, and $5,090.41. Resistance levels are $5,406.93, $5,492.04, and $5,565.19. Watch these levels closely for potential breakouts or breakdowns.
Why is XAUUSD moving today?
XAUUSD is moving today due to a combination of factors, including a stronger Dollar Index driven by geopolitical tensions and upcoming U.S. economic data releases. These factors are creating uncertainty and volatility in the gold market.
Track markets in real-time
AI-powered analysis, technical indicators and real-time price data.
Join Our Telegram Channel
Breaking market news, AI analysis and trading signals instantly.
Join Channel