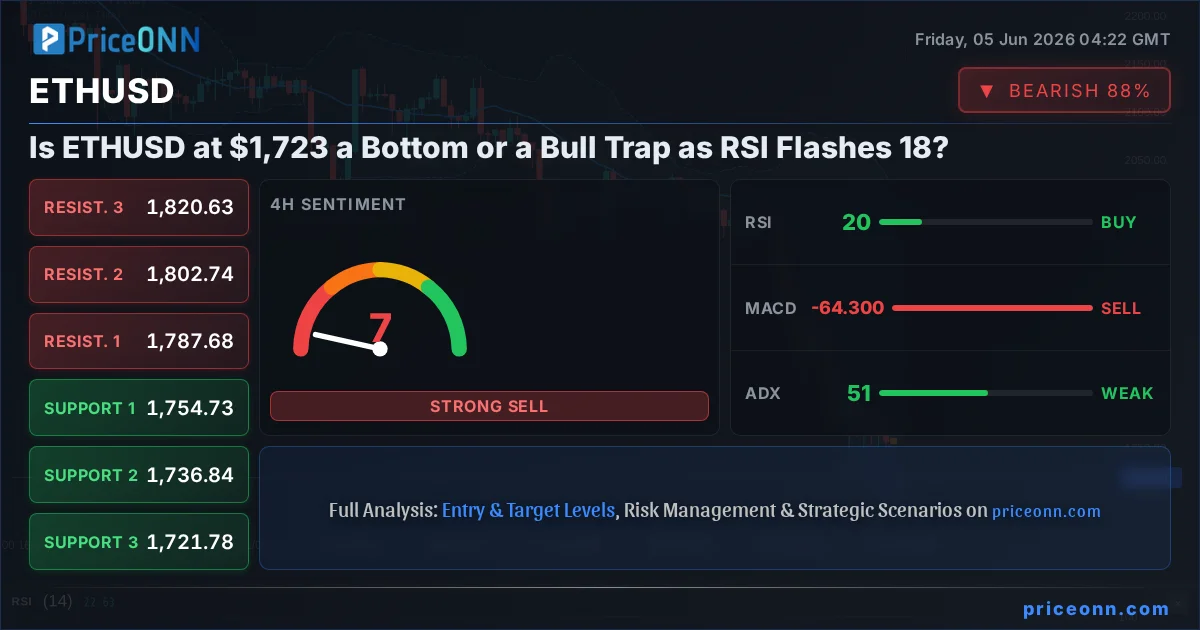
Here is the question every Ethereum holder woke up to: when the daily RSI prints 18.08, one of the lowest readings of this cycle, is the market handing you a gift or setting a trap? ETHUSD today analysis starts at $1,723.43, down 3.14% on the session and sitting just a hair above the intraday floor of $1,715.42. The tape is ugly, the momentum is broken, and yet the oversold gauges are screaming. That contradiction is the whole story today.
- ETHUSD is pinned at $1,723.43, just 0.47% above the daily low of $1,715.42 after a $55.89 drop.
- Daily RSI at 18.08 and 4H RSI at 20.16 mark a deep oversold washout, but a low RSI alone has not yet produced a reversal candle.
- The 4H ADX at 51.38 confirms one of the strongest downtrends on the board: this is a powerful move, not a quiet drift.
- First support sits at $1,718.03 with the real line in the sand at $1,707.79; reclaiming $1,745.78 is the bulls' first job.
- BTCUSD is down 3.43% with its own daily RSI at 17.08, so this is a market-wide crypto flush, not an ETH-specific story.
Time Horizon: This analysis is built for intraday and short swing traders working the 1H to daily charts over the next one to three sessions.
Why $1,707 Is the Real Line in the Sand for ETHUSD
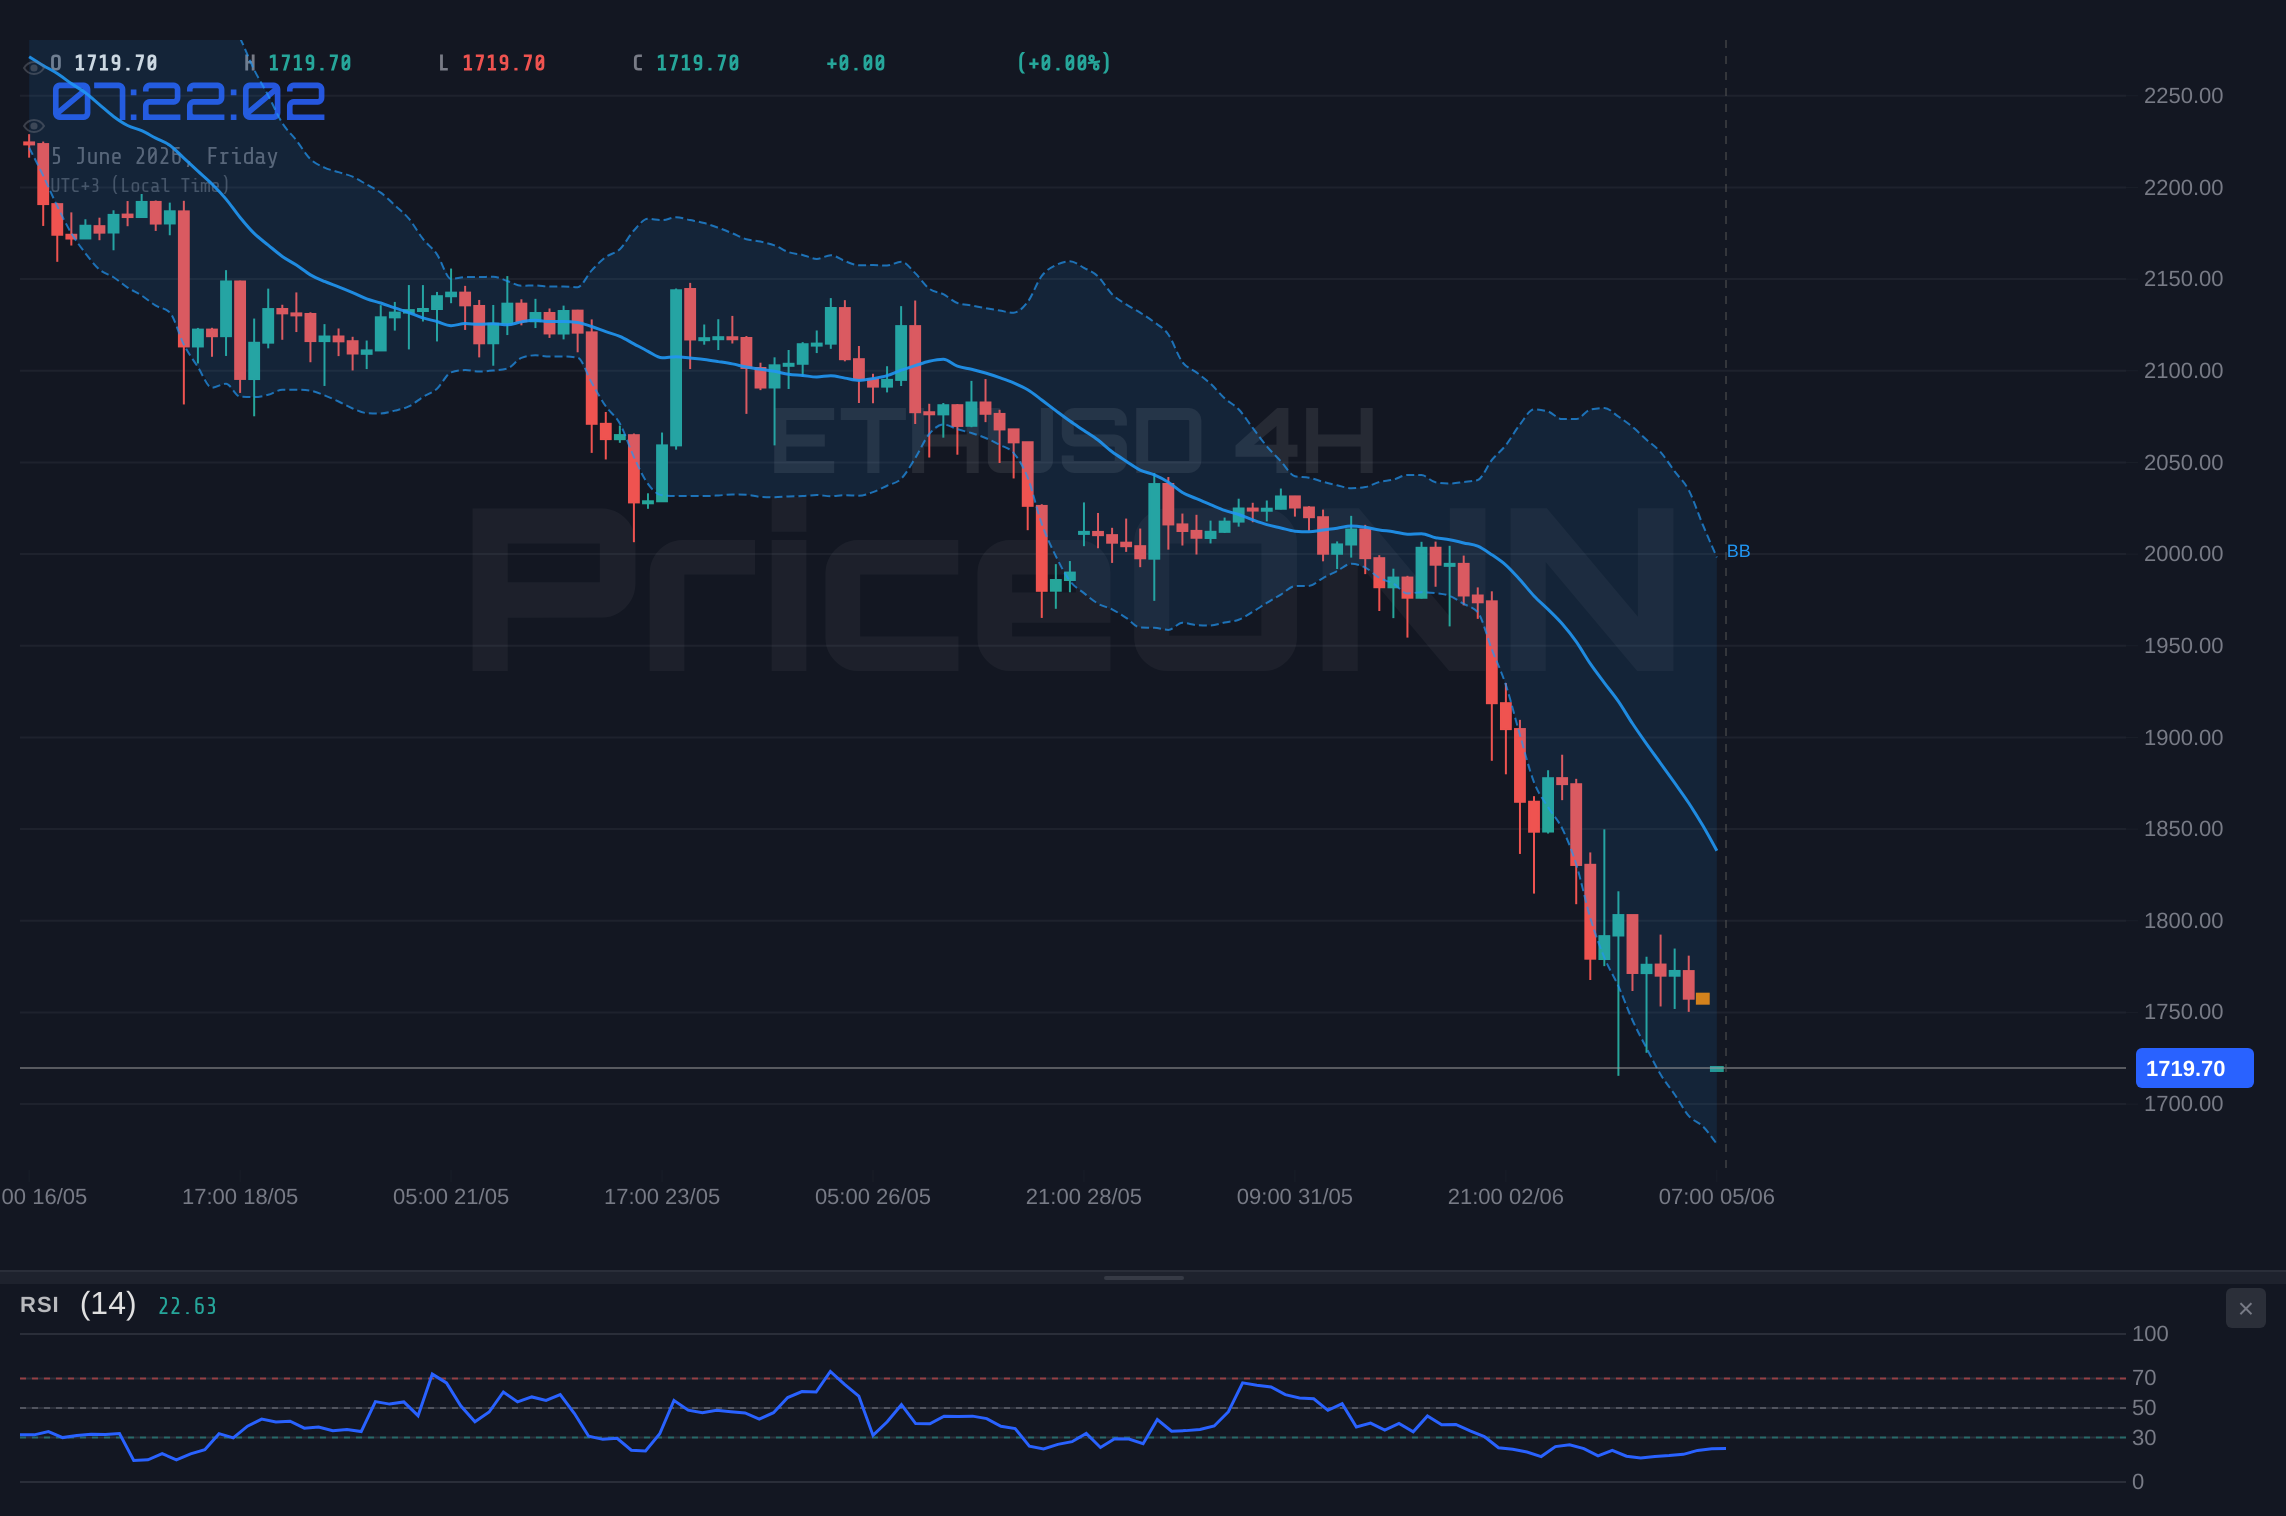
Let's start with where price actually is, because everything else hangs off it. ETHUSD closed the previous leg lower with a clean break of the $1,800 shelf and is now testing the lower edge of its daily range. The session high was $1,849.88, the low $1,715.42, and we are camped near the bottom of that band. When price hugs the lows into the close rather than bouncing, sellers are telling you they are still comfortable. That is the bearish tell hiding inside an otherwise oversold chart.
The 1H structure gives us the cleanest map. Immediate support stacks at $1,718.03, then $1,707.79, then $1,690.28. The first level is essentially where we sit, so it offers little cushion. The level that matters is $1,707.79. A decisive hourly close below it opens the door to $1,690.28, and below that the daily support at $1,676.95 comes into play fast because there is little structure in between. On the upside, the bulls have to clear $1,745.78 just to argue for a relief bounce, with $1,763.29 and $1,773.53 stacked above as the next resistance shelves. Until $1,745.78 flips from ceiling to floor, every rally is a sell-the-rip candidate in the eyes of trend traders.
The calendar carries a cluster of high-impact US data this week. A hot US print that lifts the dollar would pull liquidity out of risk assets and could accelerate a break of $1,707.79 before any oversold bounce gets a chance to form. Size positions accordingly.
What the MACD Signal and ADX Tell Us About ETHUSD Trend Analysis
Now this is where it gets interesting. Look across timeframes and the trend read is unanimous: down. The 1H, 4H, and daily charts all flag a 100% strength downtrend, and that alignment is rare. The 4H ADX at 51.38 is the headline number here. A reading above 50 is not just a trend, it is a freight train, and fighting it blind is how accounts get hurt. The daily ADX at 46.1 and the 1H ADX at 40.36 echo the same message. This is a committed, high-conviction move, not the kind of indecisive chop where mean reversion works cleanly.
MACD backs the bears on every chart. Momentum is negative with the MACD line below its signal across the 1H, 4H, and daily views. There is no bullish crossover, no histogram divergence flattening out yet, nothing that says momentum is quietly turning. So when someone points at the RSI and yells buy the dip, the honest answer is that momentum and trend strength both disagree for now.
And yet the oversold readings are genuinely extreme. Daily RSI at 18.08 and 4H RSI at 20.16 are the kind of prints that historically do not last long without at least a technical bounce. The daily Stochastic at K=4.91, D=19.70 is buried at the very bottom of its range, and on the 4H the Stochastic K=22.93 sits below D=28.06, still pointing down but deep in the basement. Price has also pushed below the lower Bollinger Band on both the 1H and daily charts, which is a classic stretched-rubber-band condition. The tension is obvious: trend says down, exhaustion says a bounce is overdue. Resolving that tension is the trade.
Deep oversold plus a strong ADX is the trickiest combination in technical analysis. A low RSI in a weak trend often marks a bottom; a low RSI inside a 50-plus ADX downtrend often just marks a pause before the next leg. Wait for a reclaim of $1,745.78, or a bullish hourly engulfing off support, before treating RSI 18 as a bottom rather than a warning.
ETHUSD Key Levels: Mapping Support and Resistance
For traders who want the map laid out plainly, here is the confluence picture. The 1H levels are the ones to trade against intraday, while the daily levels frame the bigger swing targets. Notice that the daily support at $1,676.95 and $1,586.23 sits well below current price, which tells you how much air exists if $1,690.28 fails. On the recovery side, the daily resistance does not even begin until $1,870.05, a reminder of just how far ETHUSD has fallen from the upper end of its range at $1,849.88.
The Macro Backdrop: Why ETHUSD Is Not Falling Alone
Context matters, and ETHUSD market sentiment cannot be read in a vacuum. Bitcoin is the elephant in the room. BTCUSD is down 3.43% to $62,781, with its own daily RSI at a brutal 17.08 and the 4H reading just 19.05. When the two majors are flushing in lockstep with matching oversold extremes, it tells you this is a broad crypto de-risking event rather than an Ethereum-specific problem like a protocol issue or a single large liquidation. That is actually constructive for the bounce thesis, because market-wide washouts tend to snap back together once forced selling exhausts itself.
The dollar side is more nuanced. The Dollar Index sits at 99.15, down a marginal 0.09% on the day, so the dollar is not the aggressor in this particular selloff. That distinction matters. When crypto falls while DXY is flat to soft, the move is driven by risk appetite and internal positioning rather than a pure dollar-strength squeeze. Equities tell a split story: the S&P 500 is up 0.74% at 6,572.87 while the Nasdaq 100 is down 1% at 30,135.24. Tech weakness bleeding into high-beta crypto is a familiar pattern, and the Nasdaq's softness lines up with the pressure on Ethereum better than the broad S&P bid does.
On the headline front, the crypto news flow has not been uniformly negative. Reports this week noted that Tether is backing a major stablecoin push in Georgia, a sign that institutional and sovereign-adjacent capital is still building infrastructure in the space even as spot prices bleed. That kind of structural development rarely moves price intraday, but it is the sort of backdrop that historically supports the next recovery once sentiment stabilizes. The takeaway for a trader is simple: the long-term plumbing keeps getting built while short-term price flushes out leverage.
With DXY soft at 99.15 and BTCUSD oversold at RSI 17.08 alongside ETH, this is a liquidity-driven crypto flush, not a dollar squeeze. That raises the odds of a coordinated relief bounce, but only after sellers stop pressing the lows.
Three Scenarios for ETHUSD: Trade Plan and Probabilities
Given a powerful downtrend fighting an extreme oversold reading, here is how the next moves stack up. The bearish path still carries the highest probability because trend and momentum both lean that way, but the deeply stretched oscillators give the bounce scenario real weight. These probabilities reflect the current technical picture and should be re-weighted the moment $1,745.78 or $1,707.79 breaks.
Continuation Flush: Sellers Press the Floor
50% ProbabilityOversold Stabilization: The Range Builds a Base
30% ProbabilityOversold Snapback: Bulls Catch the Falling Knife
20% ProbabilityWhat Different Traders Should Watch
The right play here depends entirely on your timeframe, and lumping everyone together is how confusion starts. For the scalper, the $1,707.79 to $1,745.78 band is the entire battlefield: fade the extremes, respect the strong ADX by keeping stops tight, and do not marry a direction while momentum is this one-sided. For the swing trader, patience is the edge. There is no rush to catch a falling knife when the daily ADX reads 46.1; the cleaner entry is a confirmed reclaim of $1,745.78 or a tested double-bottom near $1,690.28, not a hopeful bid into thin air. For the longer-term accumulator, daily RSI at 18 is the kind of generational-fear reading that has historically rewarded scaling in slowly, but only with the understanding that $1,676.95 and even $1,586.23 remain open below if the flush extends.
Here is the honest risk framing: this thesis of a near-term bounce fails if ETHUSD closes the day below $1,707.79 on rising volume, because that would confirm the trend is not done and the oversold reading is just a way station. Equally, the bears need to respect that oscillators this stretched can produce violent short-covering rallies that punish late shorts. Neither side gets a free lunch here.
| Indicator | Value | Signal | Interpretation |
|---|---|---|---|
| RSI (14) Daily | 18.08 | Oversold | Deep washout, bounce risk rising |
| RSI (14) 4H | 20.16 | Oversold | Confirms stretched conditions |
| MACD (Daily) | Below signal | Bearish | Negative momentum, no turn yet |
| ADX (4H) | 51.38 | Very strong | Dominant downtrend in force |
| Stochastic (Daily) | K 4.91 / D 19.70 | Oversold | Basement reading, curl-up watch |
| Bollinger (Daily) | Below lower band | Stretched | Mean-reversion pressure building |
Frequently Asked Questions: ETHUSD Analysis
What happens if ETHUSD breaks below $1,707.79 support?
A decisive close below $1,707.79 would open the path to $1,690.28 and then the daily support at $1,676.95, since there is little structure in between. With the 4H ADX at 51.38 confirming a strong downtrend, a break there carries real follow-through risk rather than a quick reversal.
Is RSI at 18 a buy signal for ETHUSD right now?
Not on its own. Daily RSI at 18.08 signals deep oversold conditions, but inside a downtrend this strong it can stay low while price keeps sliding. The cleaner confirmation is a reclaim of $1,745.78 or a bullish engulfing candle off support before treating it as a bottom.
Should I buy ETHUSD at current levels of $1,723?
For swing traders, waiting for confirmation above $1,745.78 offers a higher-probability entry than buying into the falling knife at $1,723.43. Long-term accumulators may scale in slowly given the RSI 18 fear reading, but only while accepting that $1,676.95 remains open below.
Why is ETHUSD falling alongside Bitcoin this week?
BTCUSD is down 3.43% to $62,781 with its own daily RSI at 17.08, so both majors are flushing together. With DXY soft at 99.15, this looks like a market-wide crypto de-risking and liquidity event rather than an Ethereum-specific problem, which raises the odds of a coordinated bounce once selling exhausts.
So where does that leave us? ETHUSD at $1,723.43 is a coin standing on a knife's edge between exhaustion and continuation. The smart money is not picking a hero direction here; it is watching $1,745.78 above and $1,707.79 below and letting price tip its hand. Manage your risk, wait for the level to break, and the market will tell you which scenario is paying. Washouts like this one plant the seeds for the next move, and the prepared trader, not the impatient one, is the one who gets paid when it comes.
Track markets in real-time
AI-powered analysis, technical indicators and real-time price data.
Join Our Telegram Channel
Breaking market news, AI analysis and trading signals instantly.
Join Channel