As global markets navigate a complex landscape of fluctuating risk appetite and evolving macroeconomic signals, silver (XAGUSD) has captured attention with a notable surge, currently trading at $84.57. This price point represents a critical juncture, prompting traders and investors to assess whether the current rally signifies a genuine breakout or a potential bull trap. The interplay between technical indicators and fundamental drivers will be crucial in determining the next direction for silver.
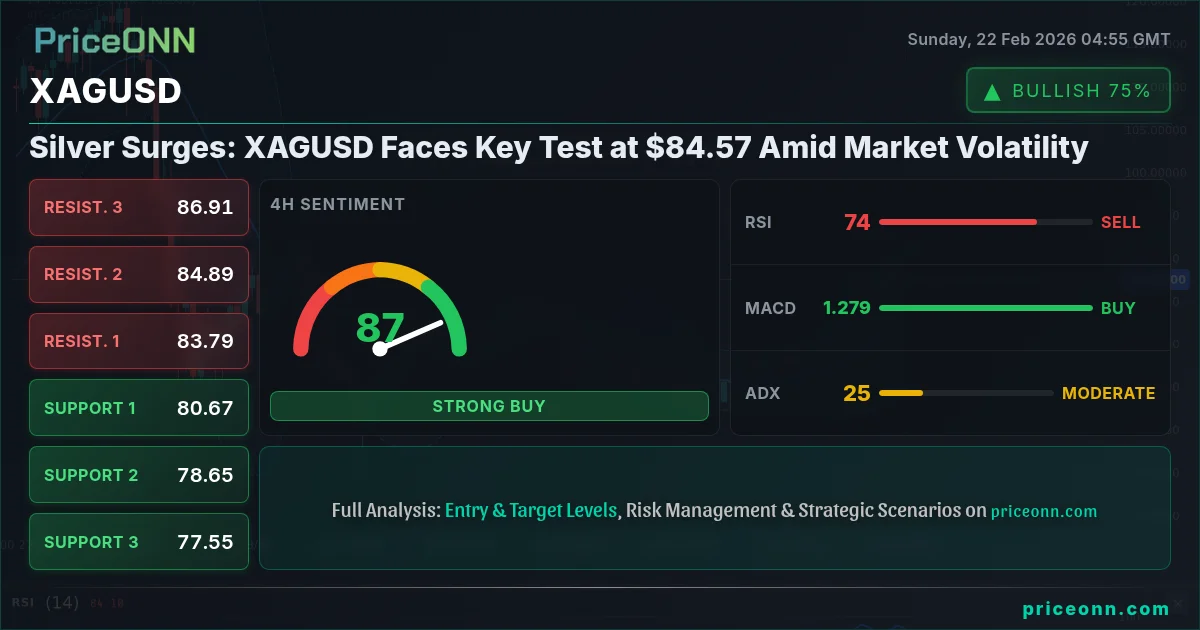
- XAGUSD is testing a key resistance level at $84.57, a critical point for determining future price action.
- RSI at 84.29 on the 1H timeframe indicates overbought conditions, suggesting potential for a pullback.
- Key support levels to watch are $82.83 and $82.42, which could act as cushions during any correction.
- Positive momentum on the daily chart contrasts with overbought conditions on shorter timeframes, creating a mixed outlook.
XAGUSD today analysis reveals a market grappling with conflicting signals. On one hand, the daily chart shows positive momentum, buoyed by a weaker dollar index (DXY), currently at 97.44. A declining DXY typically supports precious metals like silver, making them relatively cheaper for holders of other currencies. Conversely, the shorter timeframes, particularly the 1-hour chart, present an overbought scenario, hinting at a possible near-term correction. This dichotomy underscores the importance of multi-timeframe analysis in assessing the true strength and sustainability of the current rally.
Macroeconomic Context and Market Sentiment
The recent price action in XAGUSD is intricately linked to broader macroeconomic themes. With the Nasdaq100 showing a daily gain of 0.94%, risk appetite appears to be on the rise. This bullish sentiment in equities often correlates with increased demand for industrial metals like silver, given its dual role as both a precious metal and an industrial component. However, the strength of the US dollar remains a significant counterforce. As Reuters reported last week, “Fed officials continue to emphasize the need for sustained evidence of cooling inflation before considering any policy pivot.” This hawkish stance supports the dollar, potentially capping silver's upside.
Geopolitical tensions also play a pivotal role. As Bloomberg data shows, central banks have been steadily increasing their gold reserves, a trend that often extends to silver as investors seek safe-haven assets. Any escalation in global uncertainties could further fuel demand for precious metals, providing additional tailwinds for XAGUSD.
Technical Analysis: Navigating the $84.57 Hurdle
From a technical perspective, XAGUSD's ability to sustain its position above $84.57 is crucial. The 1-hour chart reveals an RSI of 84.29, firmly in overbought territory, suggesting that the market may be due for a breather. However, the ADX on the same timeframe reads 29.93, indicating a strong uptrend. This divergence between momentum and trend strength highlights the need for caution. If the price fails to hold above the immediate support at $82.83, a deeper pullback towards $82.42 could materialize.
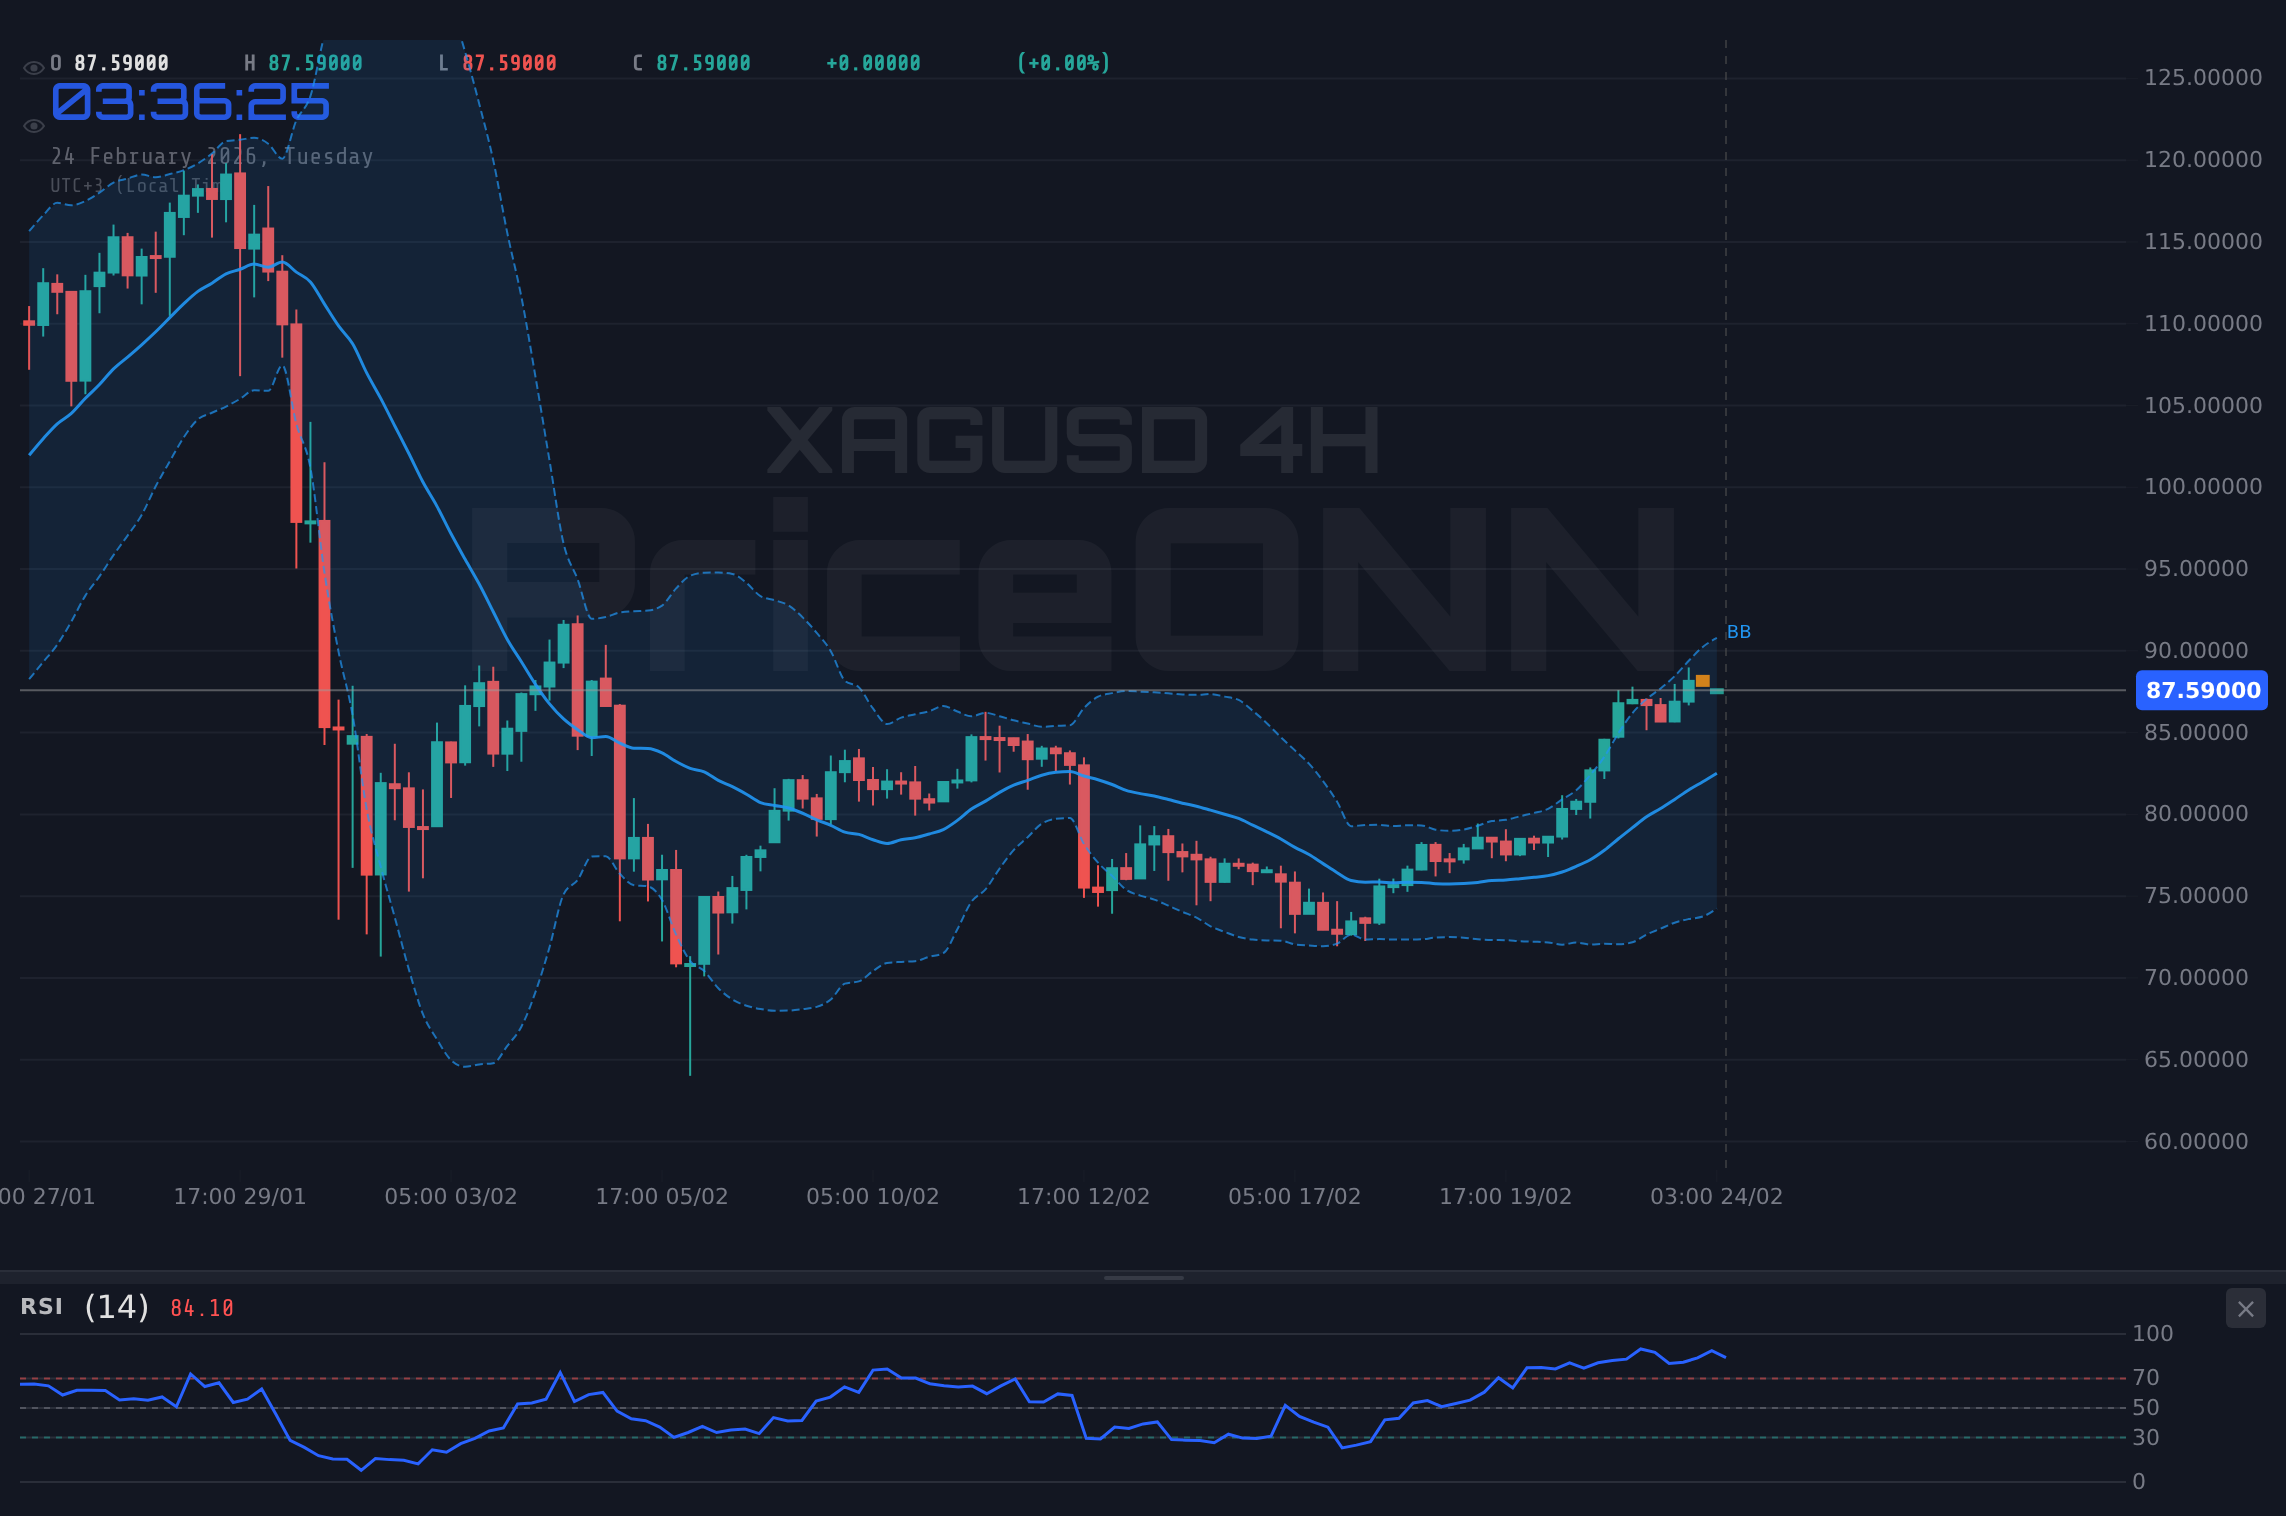
On the 4-hour timeframe, the RSI stands at 73.45, also signaling overbought conditions. Yet, the MACD histogram shows positive momentum, reinforcing the bullish narrative. Key resistance levels to watch include $83.48 and $83.73. A decisive break above these levels could pave the way for further gains, potentially targeting $84.13. The stochastic indicator, with K=90.92 and D=76.19, supports the possibility of further upside momentum in the short term.
Multi-Timeframe Analysis: Conflicting Signals
The daily chart presents a more nuanced picture. While the RSI at 51.57 is neutral, suggesting room for further upside, the MACD histogram indicates negative momentum, hinting at potential headwinds. The stochastic oscillator, with K=64.33 and D=47.69, favors the bulls, but the ADX at 31.12 points to a strong downtrend, adding to the conflicting signals. Key support on the daily chart lies at $76.79, while resistance is observed at $79.83.
XAGUSD price forecast suggests that the metal may continue to see volatility in the short term. The conflicting signals from different timeframes highlight the importance of patience and disciplined risk management. Traders should be prepared for both bullish and bearish scenarios, adjusting their positions accordingly.
Trade Plan: Navigating the Breakout
Given the current technical landscape, a strategic trade plan is essential. The analysis suggests a potential opportunity for both bullish and bearish scenarios, contingent on key level breaks and confirmations.
If XAGUSD breaks and holds above $83.48, it could trigger a further rally towards $83.73 and then $84.13. This scenario is supported by positive MACD momentum on the 4H chart and a weaker DXY.
If XAGUSD fails to hold above $82.83, it could signal a deeper correction towards $82.42 and potentially $82.18. This scenario is supported by overbought RSI conditions on the 1H chart and negative MACD momentum on the daily chart.
Economic Calendar and Potential Catalysts
While no high-impact economic events are scheduled for today, traders should remain vigilant for any unexpected news releases that could influence market sentiment. The upcoming week will be crucial, with several key economic data points on the horizon. Keep an eye on speeches by Fed officials; any hints about the future direction of monetary policy could trigger significant volatility in precious metals. As the WSJ reported earlier this month, “The market remains highly sensitive to any shifts in the Fed’s narrative.”
Also, be aware of any developments related to geopolitical risks. Escalations in existing tensions or the emergence of new conflicts could drive safe-haven demand for silver, potentially overriding technical signals. Always factor in the broader market context when making trading decisions.
Frequently Asked Questions: XAGUSD Analysis
Is XAGUSD a good buy right now?
XAGUSD presents a mixed outlook. While the 4H chart indicates positive momentum, the 1H chart shows overbought conditions. A buy position could be considered above $83.48, targeting $83.73, but caution is warranted due to potential pullback risks.
What is the XAGUSD price forecast for this week?
The XAGUSD price forecast suggests continued volatility. A bullish scenario could see prices testing $84.13, while a bearish scenario might lead to a pullback towards $82.18. The probability of each scenario depends on upcoming economic data and market sentiment.
What are the key support and resistance levels for XAGUSD?
Key support levels for XAGUSD are $82.83 and $82.42, which could act as cushions during any correction. Key resistance levels to watch include $83.48 and $83.73, a break above which could signal further gains.
Why is XAGUSD moving today?
XAGUSD is moving today due to a combination of factors, including a weaker dollar index and rising risk appetite in equity markets. However, overbought conditions on shorter timeframes suggest potential for a near-term pullback.
XAGUSD at $84.57 presents a complex trading landscape. The confluence of conflicting technical signals and macroeconomic drivers necessitates a balanced approach. Traders should prioritize risk management, monitor key levels, and remain adaptable to evolving market conditions. Patience looks like it will be rewarded here.
Track markets in real-time
AI-powered analysis, technical indicators and real-time price data.
Join Our Telegram Channel
Breaking market news, AI analysis and trading signals instantly.
Join Channel