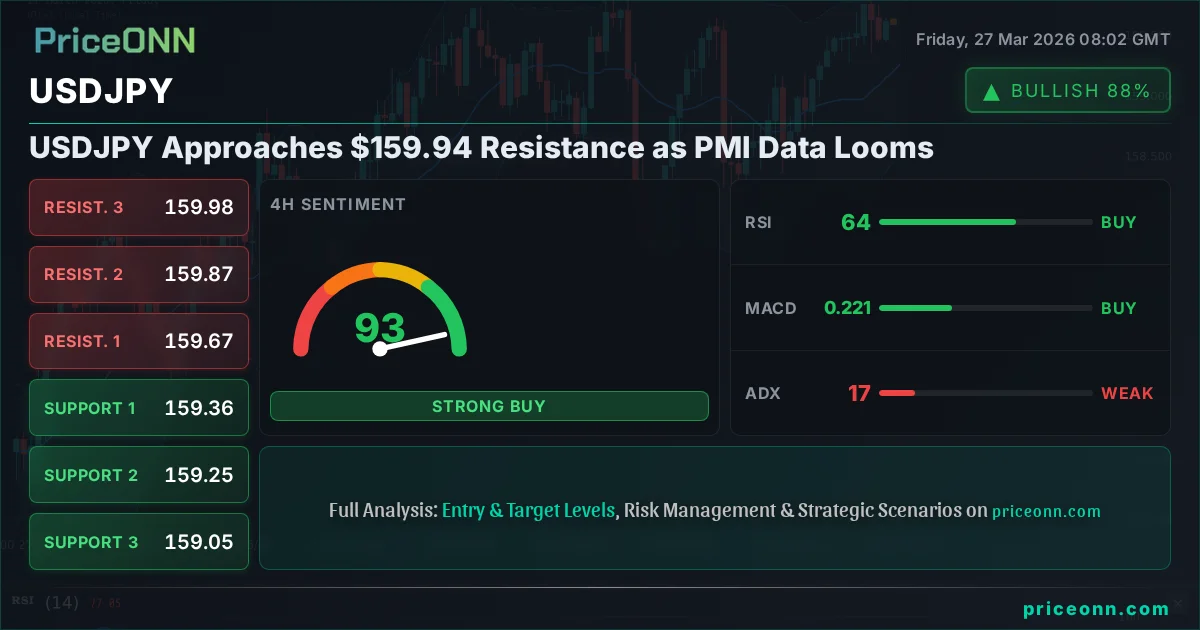
The USDJPY currency pair is currently testing critical psychological and technical resistance around the $159.94 mark. With the pair approaching a significant upside barrier, market participants are keenly awaiting upcoming Purchasing Managers' Index (PMI) data from both the United States and Japan, which could provide the catalyst for a decisive move. The current technical setup on USDJPY presents a complex picture, with conflicting signals across various timeframes and indicators, demanding a nuanced approach to market interpretation. This analysis delves into the multi-scenario outlook for USDJPY, examining the confluence of technical patterns, indicator readings, and macroeconomic drivers that will likely shape its trajectory in the short to medium term.
- USDJPY is consolidating near $159.94, a key resistance level that has seen significant attention.
- The 1-Day ADX reading of 31.83 indicates a strong uptrend, but shorter timeframes suggest consolidation.
- RSI(14) on the 1-Day chart sits at 61.69, indicating bullish momentum without being overbought.
- Upcoming PMI data releases for both the USD and JPY will be critical catalysts, potentially breaking the current stalemate.
- Conflicting signals from indicators like Stochastic and MACD across different timeframes suggest a period of choppiness before a clear directional move.
The Bullish Scenario: Breaking the Ceiling
Riding the Momentum Wave
The bullish case for USDJPY hinges on its persistent upward momentum, particularly evident on the daily chart where the trend strength is rated at 86% and the ADX stands at a robust 22.41. The pair has managed to climb towards the $159.94 level, showing resilience and an underlying bullish bias. On the 1-hour timeframe, the RSI is at 67.09, indicating strong upward momentum without yet entering overbought territory (typically above 70). The MACD is also positioned positively, trading above its signal line, further reinforcing the idea of sustained buying pressure. The Bollinger Bands on the 1-hour chart are trading above the middle band, aligning with the upward trajectory. The Stochastic indicator, with %K at 80.94 and %D at 53.24, suggests further upside potential, although it is entering overbought conditions. This scenario anticipates a decisive break above the current resistance zone.
Key Drivers for Upside
For the bulls to gain full control, several factors need to align. Firstly, the upcoming US economic data, particularly the PMI figures, must come in stronger than expected. Positive manufacturing and services sector activity would reinforce the narrative of a robust US economy, potentially widening interest rate differentials if the Federal Reserve signals a more hawkish stance or delays rate cuts. The Dollar Index (DXY), currently at 99.81, shows a strong daily uptrend, which typically supports USD strength across the board. If the DXY continues to push higher, it would provide a strong tailwind for USDJPY. Moreover, any signs of increasing risk aversion globally could, paradoxically, benefit USDJPY as a safe-haven proxy, especially if Japanese authorities refrain from direct intervention to curb yen weakness. The current levels around $159.94 are acting as a psychological hurdle, but a sustained push above $160.00 could trigger a cascade of buy orders, leading to a rapid ascent.
Projected Targets and Time Horizon
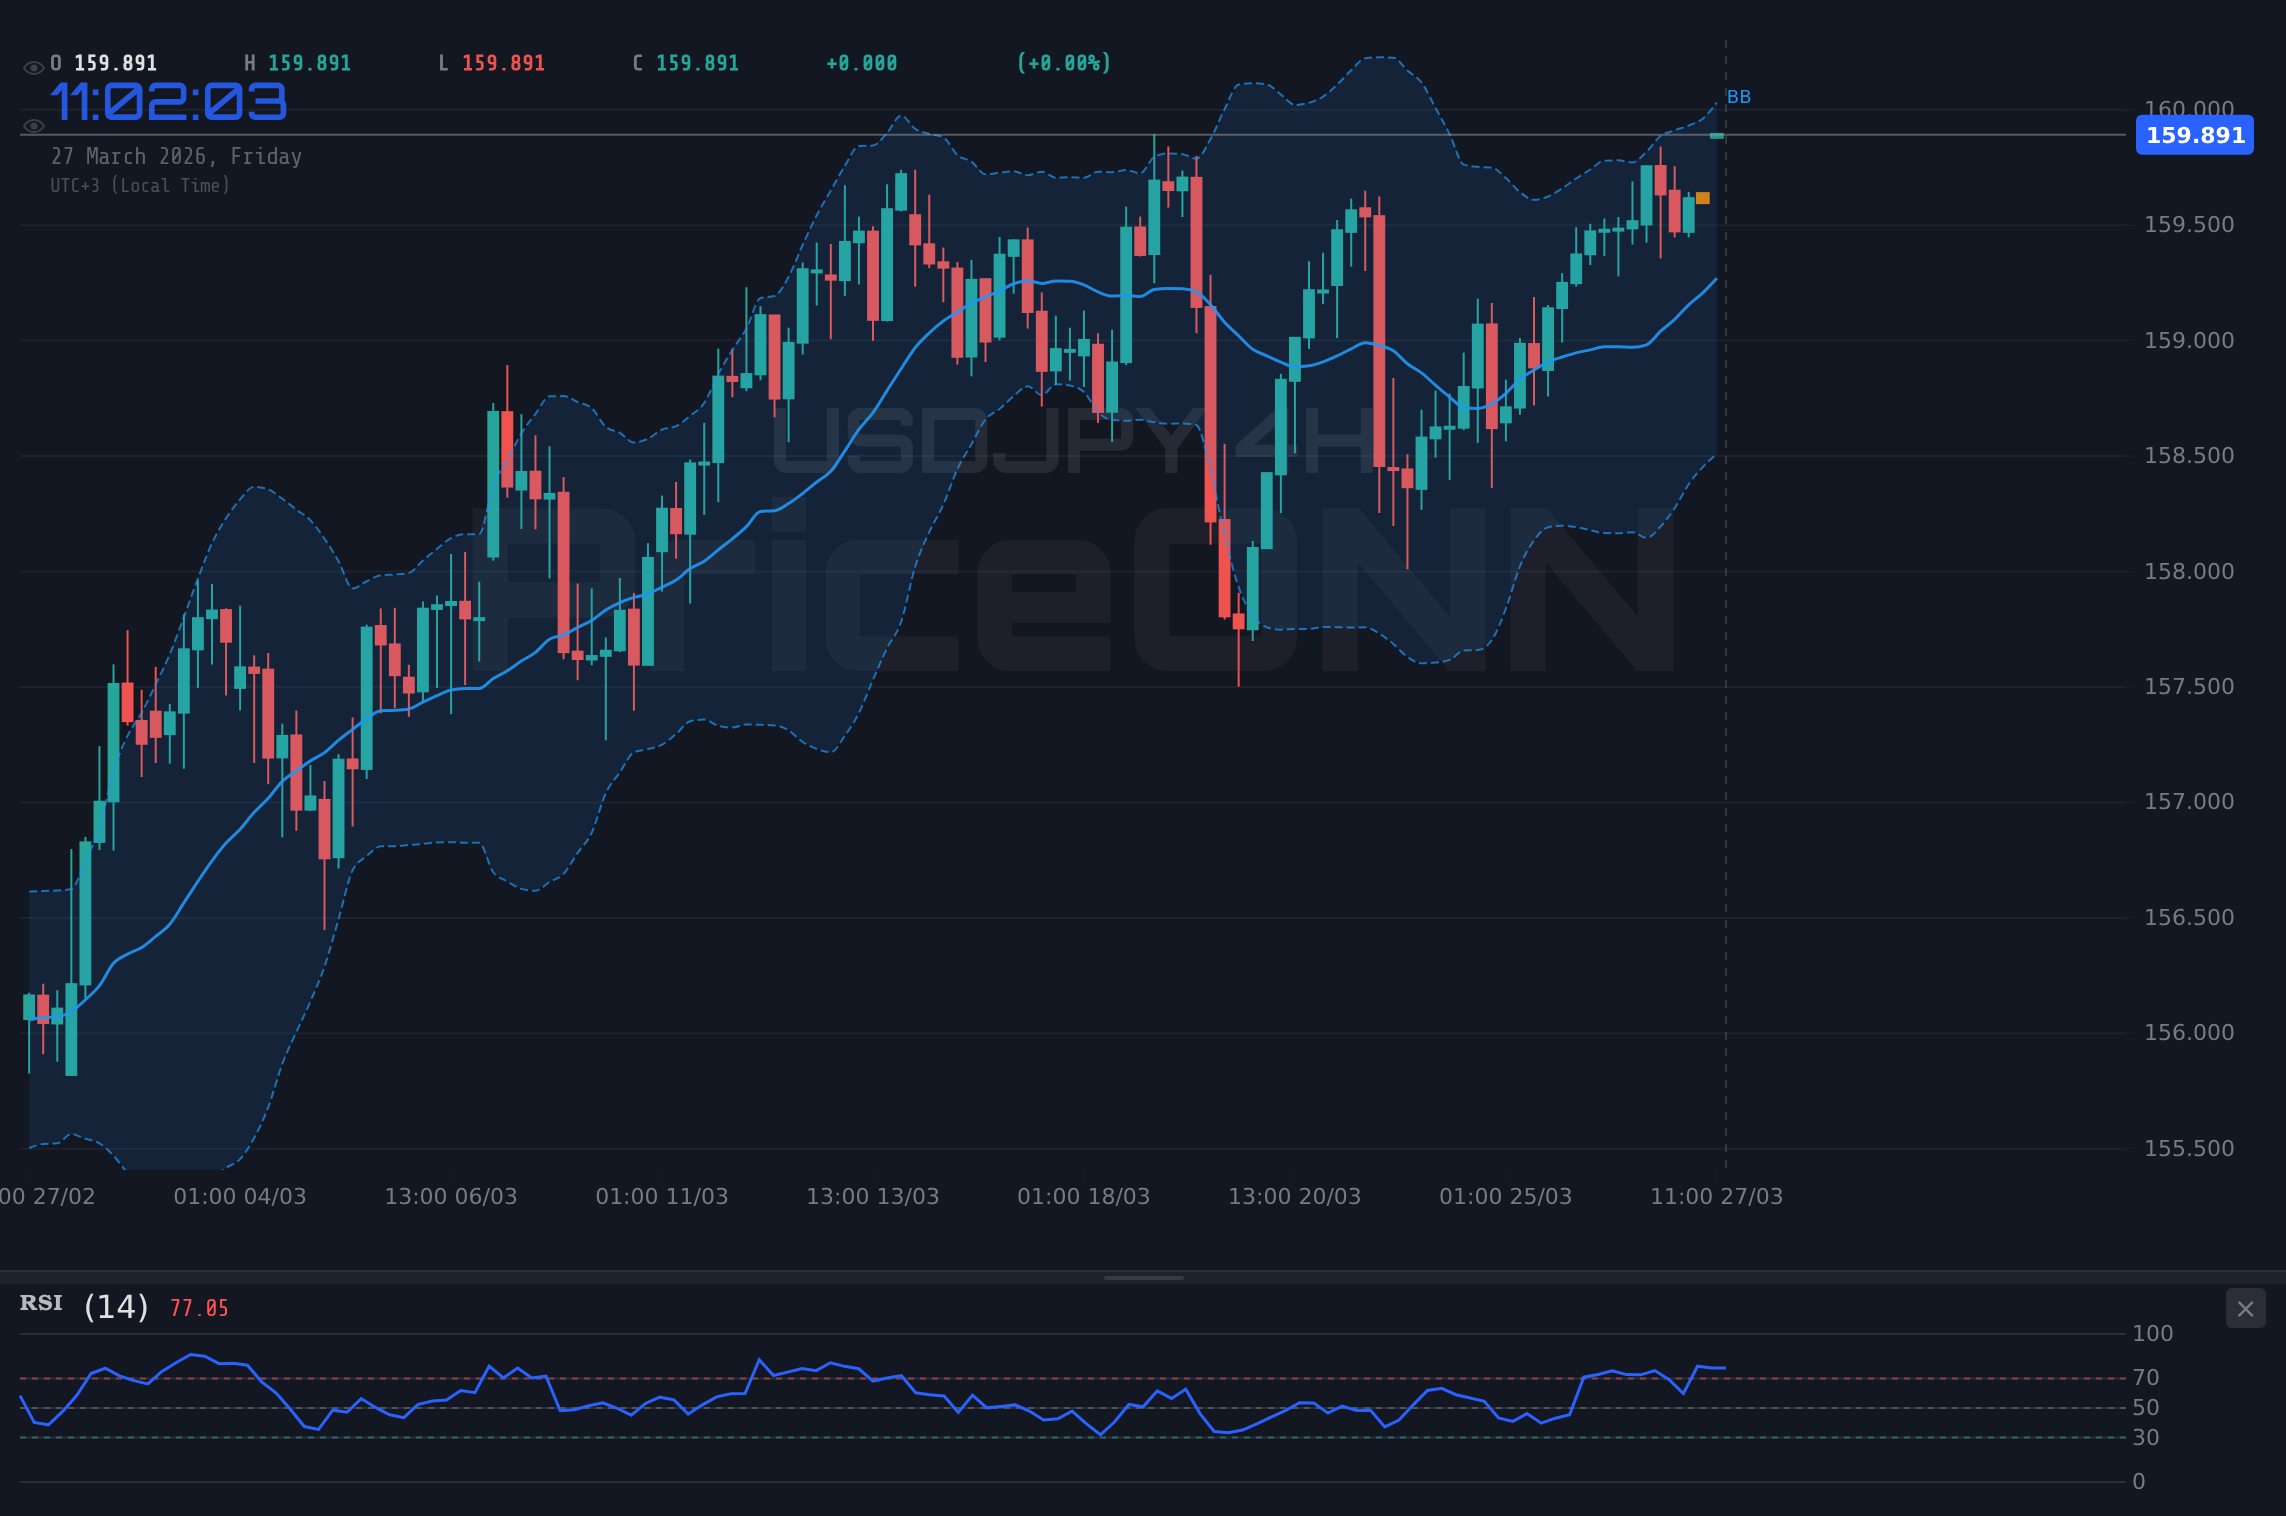
Should USDJPY successfully break through the $159.94 resistance and clear the psychological 160.00 level, the immediate upside target would be the 4-hour resistance at $159.978, followed by the daily resistance at $160.146. A more ambitious target could be the $160.451 daily resistance level. The bullish scenario is most likely to play out within the next 24-48 hours, contingent on the economic data releases and continued strength in the Dollar Index. The momentum indicators on the shorter timeframes suggest that if a breakout occurs, it could be swift, driven by short-covering and new long positions entering the market. The price action would need to hold above the $159.889 daily resistance level to confirm sustained upward momentum.
The Bearish Scenario: Facing the Headwinds
The Weight of Resistance and Divergence
The bearish outlook for USDJPY centers on the significant resistance found near the $159.94 level and the conflicting signals emerging from various technical indicators, particularly on the shorter timeframes. While the daily chart exhibits a strong uptrend, the 1-hour and 4-hour charts present a more cautionary picture. On the 1-hour chart, the Stochastic oscillator is in overbought territory (%K: 80.94, %D: 53.24), suggesting a potential pullback is due. The ADX on the 1-hour chart at 21.47 indicates only a medium-strength trend, which could easily reverse. On the 4-hour chart, the RSI is at 64.57, still showing bullish momentum but closer to the overbought threshold than on the daily chart. More concerningly, the MACD on the 4-hour chart shows negative momentum, trading below its signal line, which contradicts the bullish sentiment on the 1-hour chart. The Bollinger Bands on the 4-hour are also showing signs of tightening around the middle band, hinting at a potential consolidation or reversal.
Fundamental Dampeners and Intervention Fears
A key driver for the bearish scenario would be weaker-than-expected US economic data, particularly the PMI figures. If US economic activity shows signs of slowing down, it could reduce the perceived need for the Federal Reserve to maintain a hawkish stance, thereby weakening the dollar. Conversely, if Japanese economic data surprises on the upside, it might lead to speculation about a shift in the Bank of Japan's monetary policy, potentially strengthening the yen. The persistent strength of USDJPY has also raised concerns about potential currency intervention by Japanese authorities. While no direct intervention has occurred yet, the Bank of Japan has repeatedly voiced its concerns about excessive yen weakness. The psychological level of 160 per dollar is a significant threshold, and any hint of coordinated intervention could trigger a sharp reversal. The correlation with the Dollar Index (DXY) is also a factor; if the DXY were to falter, it would directly impact USDJPY.
Potential Targets and Time Horizon
If USDJPY fails to break above the $159.94 resistance and instead reverses, the immediate downside target would be the 1-hour support at $159.814, followed by $159.618. A more significant pullback could see the pair test the 4-hour support levels, starting with $159.362 and potentially extending to $159.250. A decisive break below the $159.054 daily support level would confirm a bearish reversal, potentially opening the door for a move towards the $158.765 support. This bearish scenario could unfold rapidly if negative news emerges, particularly concerning intervention fears or significantly weaker US data, within the next 24-72 hours. The market sentiment can shift quickly, especially when approaching such critical psychological levels.
The Consolidation Scenario: Caught in the Middle
A Tug-of-War at Key Levels
The neutral or consolidation scenario posits that USDJPY will remain range-bound between its immediate support and resistance levels in the absence of a clear directional catalyst. This scenario is supported by the conflicting signals across different timeframes and the current positioning near a significant resistance level. On the 1-hour chart, the ADX is at 21.47, indicating a relatively weak trend, which often precedes periods of consolidation. The 4-hour chart shows a neutral trend with an ADX of 16.64, further supporting the idea of a market in limbo. While the daily indicators are largely bullish, the shorter-term charts are showing signs of fatigue and indecision. The Stochastic on the 4-hour chart is showing a potential bearish signal (%K
Market Drivers for Sideways Action
Several factors could contribute to a period of consolidation for USDJPY. Firstly, the upcoming PMI data could be mixed, with one region showing strength and the other showing weakness, leading to offsetting effects on the pair. This would create uncertainty and prevent a decisive move. Secondly, Japanese authorities might signal their readiness to intervene without actually acting, keeping traders on edge and discouraging aggressive bets in either direction. The market might also be waiting for clearer signals from the Federal Reserve regarding its future monetary policy path. Without a strong indication of further rate hikes or a firm commitment to rate cuts, the dollar's direction could remain unclear. The current price action, hovering around $159.94, represents a battleground where buyers and sellers are evenly matched, leading to a stalemate until a significant event disrupts the equilibrium. The lack of clear trends on shorter timeframes, as indicated by the low ADX values, further supports this view.
Navigating the Range
In a consolidation scenario, USDJPY would likely trade within a defined range. The immediate support to watch is the 1-hour level at $159.618, and the resistance is the 1-hour level at $159.814, with the critical $160.00 psychological barrier acting as the upper bound. Prices might oscillate between the 1-hour support and resistance levels, with occasional probes higher or lower. The broader range could be defined by the 4-hour support at $159.250 and the daily resistance at $160.146. Traders operating in this environment would focus on range-bound strategies, looking to buy near support and sell near resistance, while carefully managing risk. The ADX values below 20 on both the 1-hour and 4-hour charts reinforce the idea of a weak trend, making breakout strategies less appealing until stronger trend signals emerge. This period of indecision could last for several trading sessions, depending on the outcome of key economic events and central bank rhetoric.
The Verdict: Which Scenario Dominates?
Weighing the Evidence
Analyzing the confluence of technical indicators and potential fundamental catalysts, the market appears to be at a critical juncture for USDJPY. The daily chart still shows a strong underlying uptrend, supported by an ADX of 22.41 and RSI at 61.69. This suggests that the path of least resistance, in the longer term, might still be to the upside. However, the significant resistance cluster around $159.94 to $160.00, coupled with conflicting signals on shorter timeframes, cannot be ignored. The 1-hour Stochastic entering overbought territory and the 4-hour MACD showing negative momentum are crucial warnings against chasing the price higher without confirmation. Furthermore, the ever-present threat of Japanese currency intervention looms large, acting as a significant ceiling for any further USDJPY appreciation. The DXY's strength at 99.81 provides a bullish underpinning for the dollar, but the market's current sensitivity to Japanese policy signals suggests that the upside may be capped in the immediate term.
The Most Probable Outcome
Given the current technical crosscurrents and the proximity to psychological resistance, the most probable scenario in the very short term (next 12-24 hours) leans towards a period of consolidation or a minor pullback before a potential breakout or reversal. The market is likely waiting for the PMI data to provide a clear direction. If US PMIs significantly outperform Japanese PMIs, and the Fed's hawkish undertones persist, the bullish scenario remains the most likely outcome over the next few days, pushing towards $160.451. However, if US data disappoints or intervention fears escalate, a bearish correction towards $159.250 is highly probable. Therefore, I assign a 60% probability to the consolidation scenario in the immediate aftermath of the data, with a 30% chance for the bullish scenario if data is strongly positive for the USD and a 10% chance for a bearish reversal if intervention fears dominate or US data is weak.
What I'm Watching This Week
The key levels to monitor for USDJPY remain the immediate resistance around $159.94-$160.00 and the support at $159.618 on the 1-hour chart. A decisive close above $160.146 on the daily chart would strongly favor the bullish scenario, targeting higher levels. Conversely, a sustained break below $159.250 on the 4-hour chart would open the door for the bearish scenario, with targets around $159.00. The most critical catalysts will be the upcoming PMI releases. We will be looking for significant deviations from forecasts, especially in the US figures, to gauge the Fed's potential policy direction and the dollar's strength. Additionally, any rhetoric from Japanese officials regarding currency levels will be closely scrutinized, as it could trigger immediate volatility. The DXY's movement will also serve as a key barometer for overall dollar sentiment.
Bearish Scenario: Intervention Fears Cap Gains
10% ProbabilityNeutral Scenario: Waiting for Data Clarity
60% ProbabilityBullish Scenario: Data Fuels Dollar Strength
30% Probability| Indicator | Value | Signal | Interpretation |
|---|---|---|---|
| RSI (14) | 61.69 | Bullish | Positive momentum, room to run but watch for overbought conditions. |
| MACD Histogram | Positive | Bullish | Momentum strengthening on daily chart. |
| Stochastic | K=69.44, D=48.38 | Bullish | Bullish crossover and strong upward momentum. |
| ADX | 31.83 | Strong Trend | Indicates a well-established uptrend on the daily timeframe. |
| Bollinger Bands | Middle Band | Bullish | Price trading above the middle band suggests bullish bias. |
Frequently Asked Questions: USDJPY Analysis
What happens if USDJPY breaks above $160.01 resistance?
A sustained break above $160.01, particularly on the daily chart, would invalidate the consolidation scenario and strongly favor the bullish outlook. Immediate targets would then shift towards $160.146 and potentially $160.451, driven by increased momentum and potential short covering.
Should I buy USDJPY at current levels of $159.94 given the RSI at 61.69?
Buying at current levels carries risk due to the proximity of significant resistance and conflicting short-term signals. While the daily RSI at 61.69 suggests bullish momentum, waiting for a confirmed breakout above $160.146 or a pullback to support levels like $159.618 for better risk-reward might be prudent. A 60% probability favors consolidation before any major move.
Is the ADX at 31.83 a sell signal for USDJPY?
No, an ADX of 31.83 on the daily chart is not a sell signal; it indicates a strong existing trend. However, the direction of that trend is crucial. Given the overall bullish context on the daily chart, this strong ADX reading supports the continuation of the uptrend, provided key resistance levels are breached. Shorter-term ADX readings suggest caution regarding immediate entry.
How will the upcoming PMI data affect USDJPY this week?
The PMI data releases are critical catalysts. Strong US PMI data could strengthen the dollar and push USDJPY higher towards $160.451, while weak data might trigger a pullback to $159.250. Japanese PMI results will also influence the yen's strength, potentially impacting the pair's direction significantly, especially if they deviate from forecasts.
Track markets in real-time
AI-powered analysis, technical indicators and real-time price data.
Join Our Telegram Channel
Breaking market news, AI analysis and trading signals instantly.
Join Channel