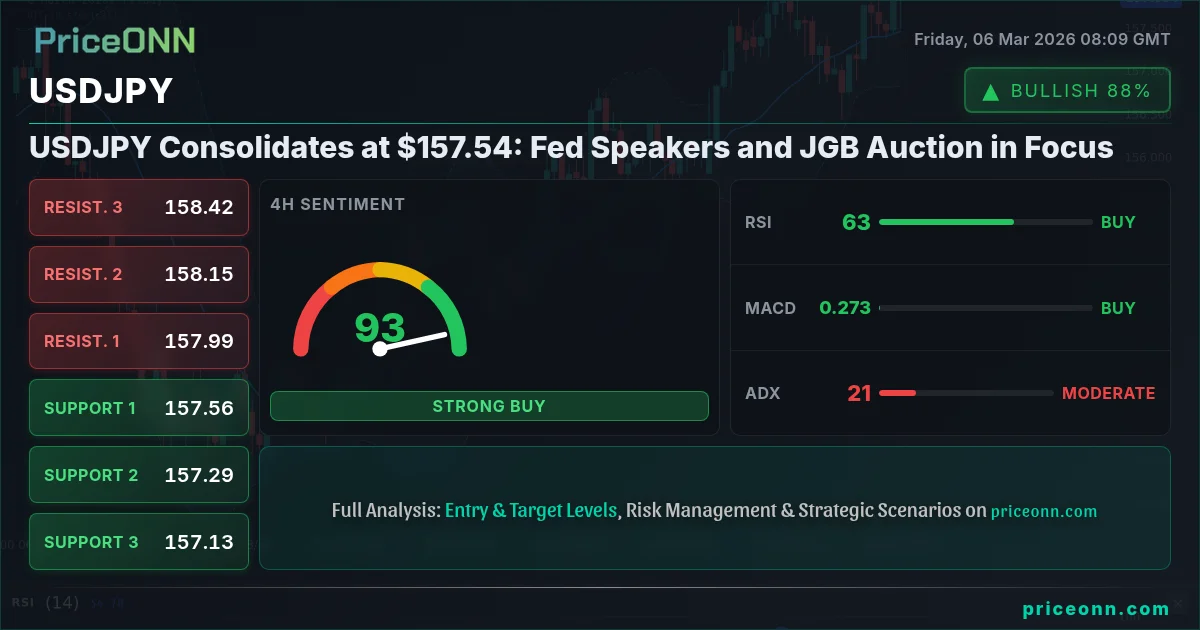
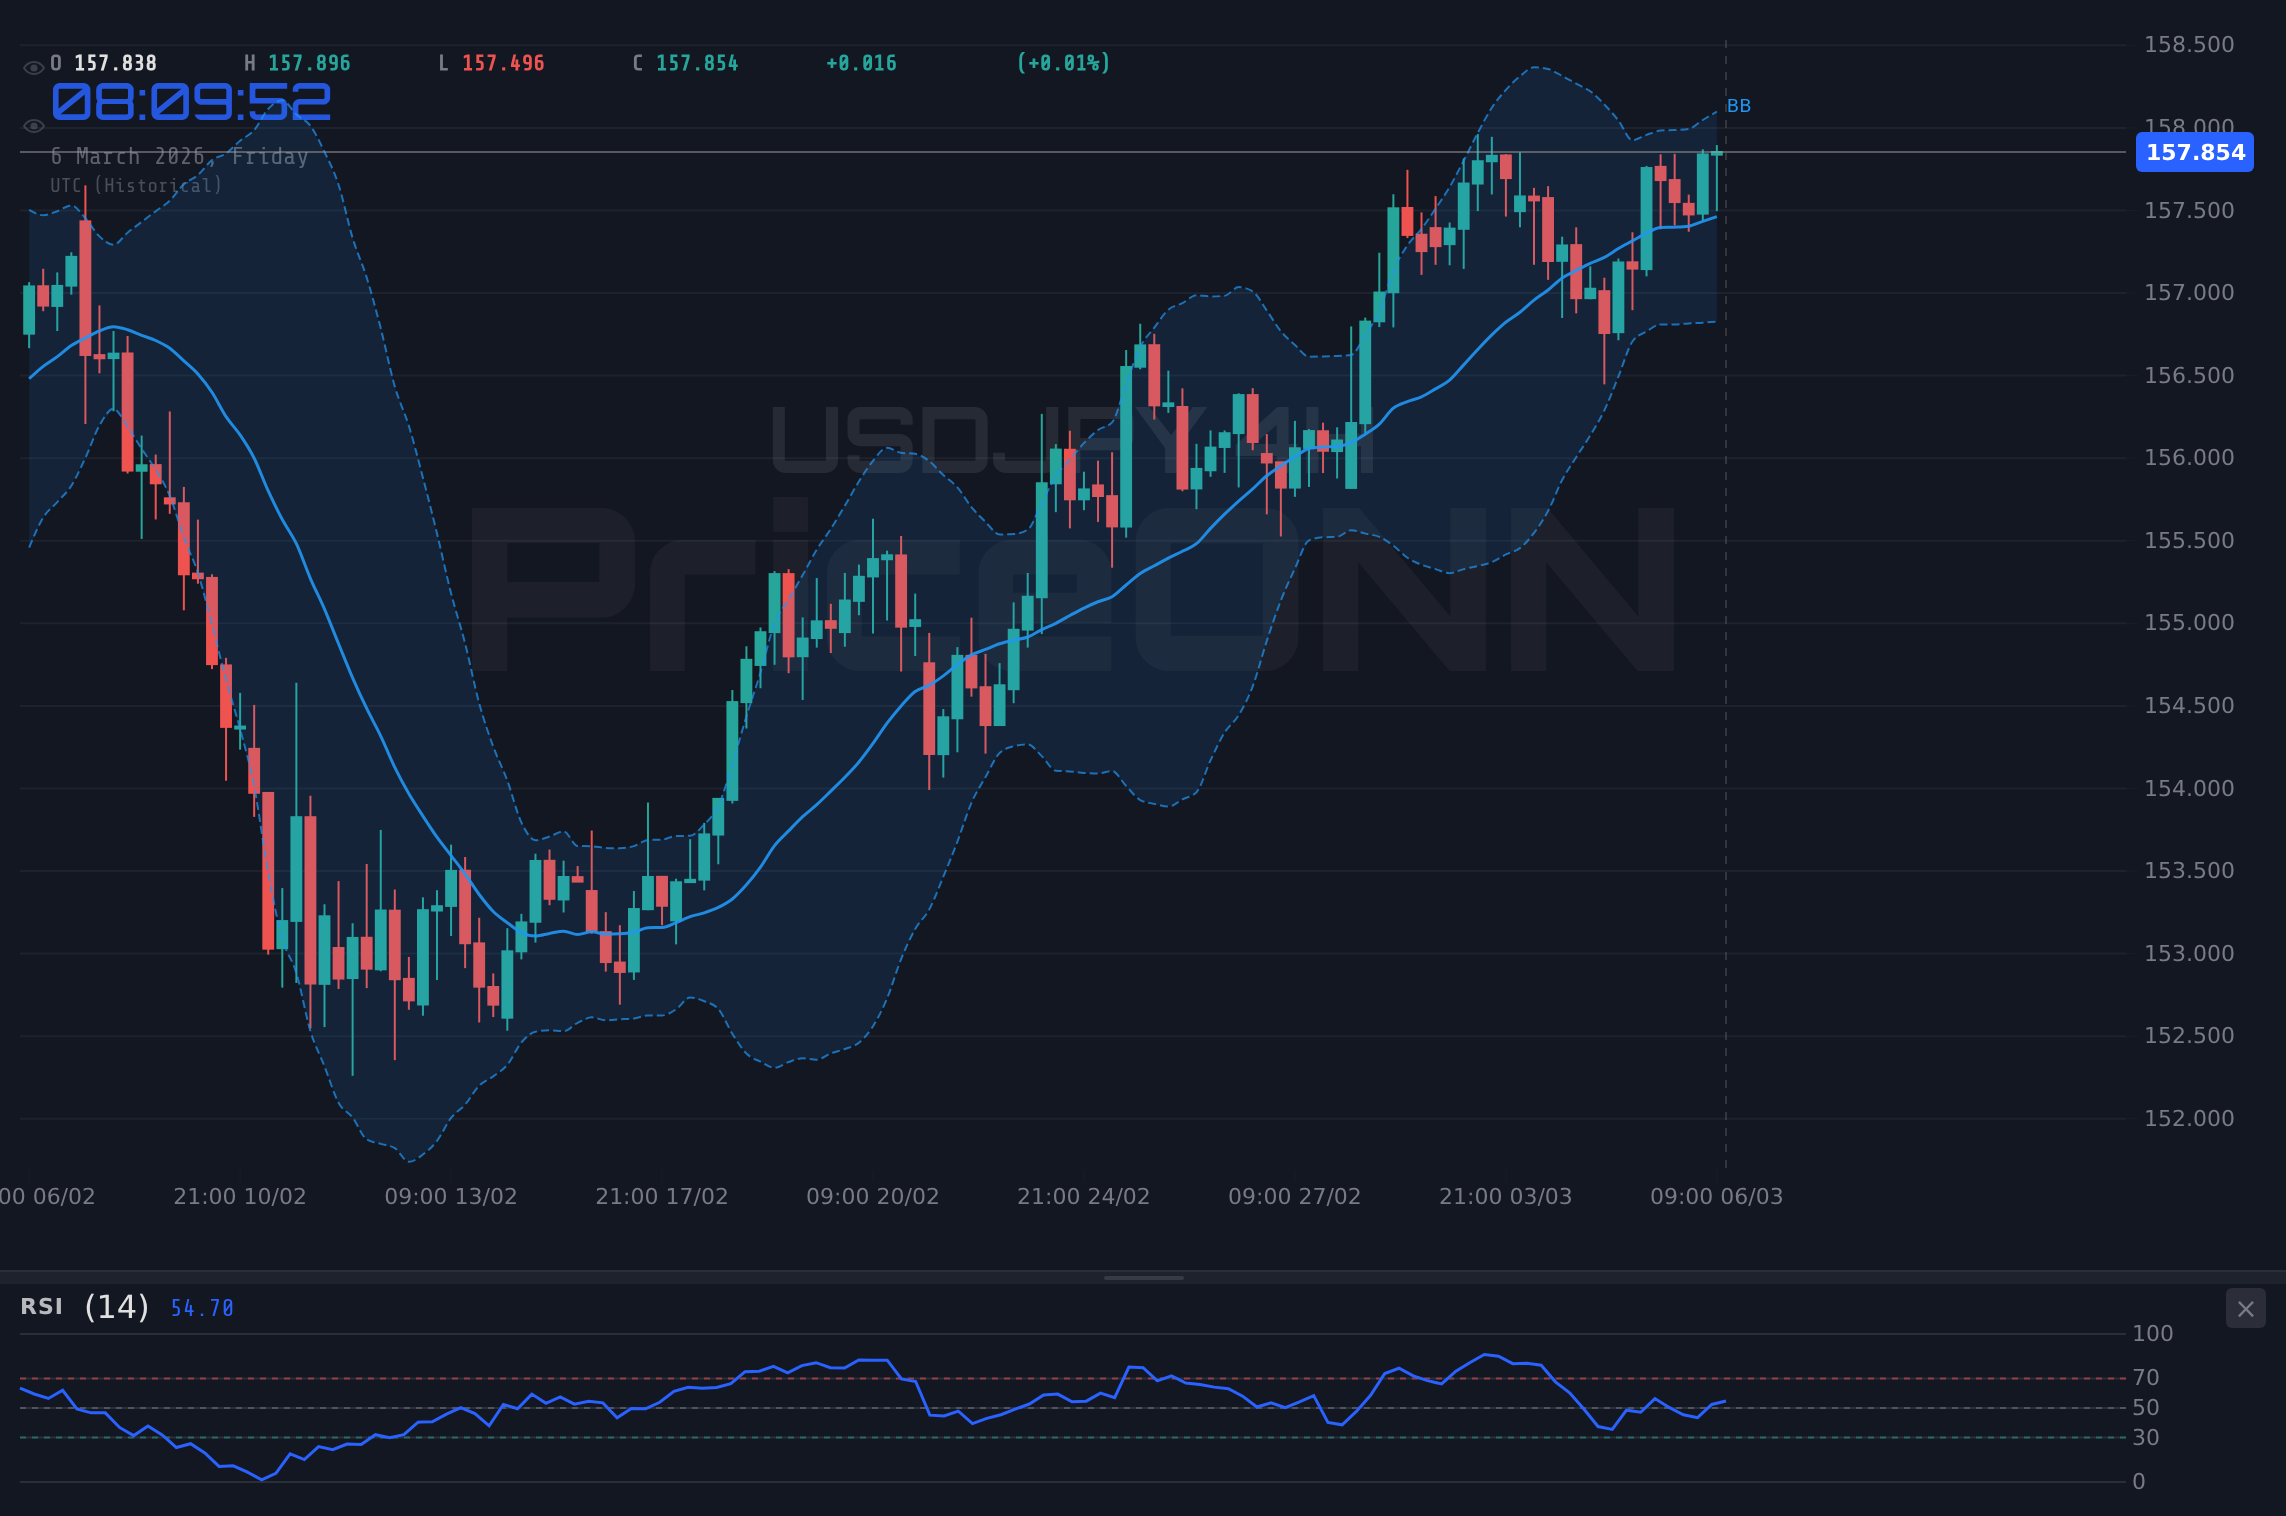
USDJPY is currently trading near $157.54, exhibiting a period of consolidation as market participants closely monitor upcoming Federal Reserve (Fed) speakers and the implications of the latest Japanese Government Bond (JGB) auction. This period of relative calm follows a week of fluctuating risk sentiment influenced by global economic data and geopolitical tensions. The key question now is whether this consolidation is a prelude to a breakout or a continuation of the current range-bound conditions.
- RSI at 58.04 on the 4H chart suggests moderate bullish momentum, but not yet overbought conditions.
- Key support sits at 157.37, a break below which could trigger a bearish move.
- MACD histogram positive on the 1D chart indicates potential for bullish continuation.
- Fed rate expectations and JGB auction outcomes are driving USDJPY correlation with DXY.
The 4-hour chart reveals a neutral trend, with the Relative Strength Index (RSI) positioned at 58.04, indicating a moderate upward momentum without reaching overbought levels. This suggests that the bulls still have some strength, but the market is not excessively skewed towards buying. The Moving Average Convergence Divergence (MACD) histogram is exhibiting positive momentum on the daily timeframe, suggesting the potential for further upside. However, the 1-hour chart displays a Stochastic reading with K=63.96 and D=47.19, signaling a possible near-term pullback as %K is greater than %D. This divergence across timeframes highlights the current market indecision.
Key levels to watch include support at 157.366 on the 4-hour chart, which represents the immediate floor for any potential downside move. A break below this level could open the door to further declines, targeting the 157.256 and 157.141 levels. Conversely, resistance is observed at 157.591, a breach of which could signal a continuation of the bullish trend toward 157.706 and 157.816. The current price action suggests that USDJPY is caught between these levels, awaiting a catalyst to trigger a decisive move. The ADX on the 1H chart is at 14.39, indicating a weak trend which further emphasizes the consolidation.
The direction of USDJPY is intricately linked to the strength of the U.S. Dollar Index (DXY), which currently stands at 98.7. A strengthening dollar, propelled by hawkish signals from Fed speakers, could exert downward pressure on USDJPY. Conversely, a weaker dollar, potentially triggered by dovish commentary or disappointing economic data, could provide a boost to the currency pair. According to recent forex news, the EUR/USD pair is under pressure and struggling below 1.1600, amid geopolitical tensions and cautious ECB rhetoric. This broader dollar strength is important for USDJPY analysis.
The upcoming JGB auction adds another layer of complexity to the outlook. A strong auction could signal increased investor confidence in the Japanese economy, potentially bolstering the Yen and weighing on USDJPY. Conversely, a weak auction could exacerbate concerns about Japan's economic outlook, further weakening the Yen and supporting USDJPY. The market's reaction to the auction will likely depend on the level of demand and the yields offered.
From a technical perspective, the multi-timeframe analysis reveals a mixed picture. While the daily chart suggests potential for further upside, the shorter-term charts indicate a possible pullback. This divergence underscores the need for caution and highlights the importance of waiting for confirmation before initiating any trades. A key level to monitor is the 157.591 resistance. A confirmed break above this level, accompanied by increasing volume, could signal a bullish breakout. On the downside, a break below the 157.366 support could trigger a bearish move.
Given these factors, a neutral to slightly bullish stance seems appropriate. The potential for further upside is supported by the positive MACD histogram on the daily chart, but the near-term risk of a pullback cannot be ignored. Traders should closely monitor the upcoming Fed speakers and the JGB auction for clues about the future direction of the currency pair. Those with a higher risk tolerance may consider initiating long positions on a break above the 157.591 resistance, while more conservative traders may prefer to wait for a confirmed break and retest of this level.
The economic calendar for today, March 6th, includes several high-impact USD events. These events will likely introduce volatility into the market. These events could trigger sharp movements in USDJPY, regardless of the technical picture. Traders should exercise caution and manage their risk accordingly.
USDJPY breaks above the 157.591 resistance level, driven by hawkish Fed commentary. Targets include 157.706 and 157.816. Continuation possible to 158.00 with strong momentum.
USDJPY falls below 157.366 support, fueled by dovish Fed surprises. Targets include 157.256 and 157.141. Breakdown continues to 157.00 with broad risk-off sentiment.
Manage your risk, wait for your setup- the market always gives a second chance. Patient investors always find opportunities- the key is waiting for the right moment. Be bold when the market is fearful, cautious when euphoric- this golden rule applies today.
Technical Outlook Summary
| Indicator | Value | Signal |
|---|---|---|
| RSI (14) | 51.11 | Neutral |
| MACD Histogram | Positive | Bullish |
| Stochastic | 63.96/47.19 | Bullish |
| ADX | 14.39 | Weak |
| Bollinger | Mid Band | Watch |
Key Levels
Support Levels
Resistance Levels
Frequently Asked Questions: USDJPY Analysis
Is USDJPY a good buy right now?
USDJPY is showing mixed signals. Current price is $157.54 with RSI neutral, but the MACD on the daily chart is positive. A buy could be considered if it breaks 157.591 with confirmation.
What is the USDJPY price forecast for this week?
The USDJPY price forecast for this week is cautiously bullish. Expect a range of 157.37 to 157.84. A strong JGB auction could change this dynamic.
What are the key support and resistance levels for USDJPY?
Key support for USDJPY is at 157.366, with resistance at 157.591. These levels are derived from the 4-hour chart and are critical for short-term traders.
Why is USDJPY moving today?
USDJPY is consolidating today as traders await the next catalyst. Potential catalysts include Fed speaker commentary and the upcoming JGB auction results.
Track markets in real-time
AI-powered analysis, technical indicators and real-time price data.
Join Our Telegram Channel
Breaking market news, AI analysis and trading signals instantly.
Join Channel