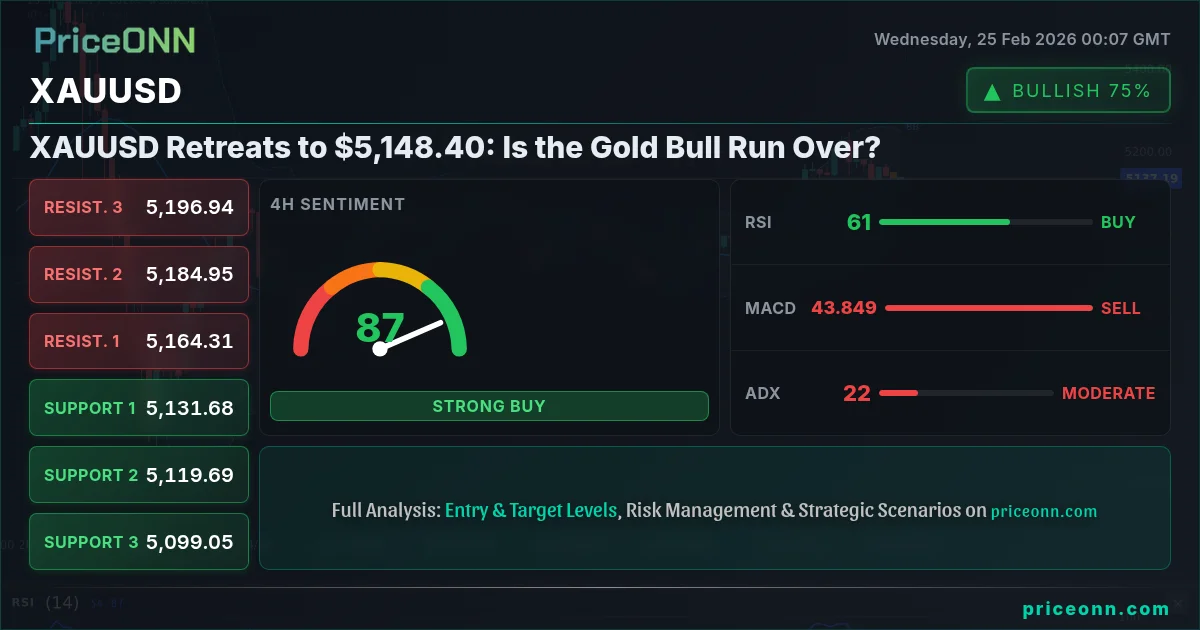
Gold just did something the bulls have been waiting months for: it tested the patience of dip buyers. At $5,148.40, XAUUSD is facing a critical juncture. Are we seeing a healthy pullback before another leg higher, or the start of something more sinister?
- RSI at 46.64 on the 1H chart signals a potential weakening of the recent upward momentum.
- Critical support lies at $5,134.17, a break below which could trigger further selling pressure.
- MACD on the 1H chart shows negative momentum, indicating a potential shift in trend.
- DXY strength is putting downward pressure on XAUUSD, a correlation to watch closely.
Why $5,134.17 is the Line in the Sand
The immediate level to watch is $5,134.17. This represents the first support level on the 1H timeframe, and a sustained break below this level could open the door for a test of $5,124.68. Why is this important? Because the hourly chart is often the first to signal a change in trend, and a failure to hold this support suggests that the bears are starting to gain control.
Having tracked XAUUSD through multiple market cycles, I’ve seen this pattern play out time and again. A test of short-term support, followed by a failure to hold, often leads to a cascade of selling as stop losses are triggered and momentum traders pile on the short side. The ADX on the 1H chart is currently at 24.98, indicating a moderate downtrend. This suggests that if the $5,134.17 level breaks, the move could be swift and decisive.
Remember, the market can be unpredictable. While the technicals may point to further downside, a surprise announcement or a sudden shift in market sentiment could easily reverse the trend. Always manage your risk and never trade with more than you can afford to lose.
The Bearish Case: DXY Strength and Risk Aversion
The bearish argument is further strengthened by the current strength of the Dollar Index (DXY), which is trading at 97.59, up 0.17% on the day. As the dollar strengthens, it puts downward pressure on gold, which is priced in dollars. According to Reuters, "the dollar's rise is fueled by expectations of further interest rate hikes by the Federal Reserve." With the market pricing in a more hawkish Fed, the outlook for gold remains challenging.
Furthermore, risk aversion is on the rise, with the SP500 trading at 6891, up 0.69% today. While equities are showing some resilience, the overall tone in the market is cautious. As investors seek safety, they are more likely to flock to the dollar than to gold. This is reflected in the XAUUSD trend analysis, which shows a weakening of the bullish trend on the 1H and 4H timeframes.
The Bullish Counter: Is This Just a Dip to Buy?
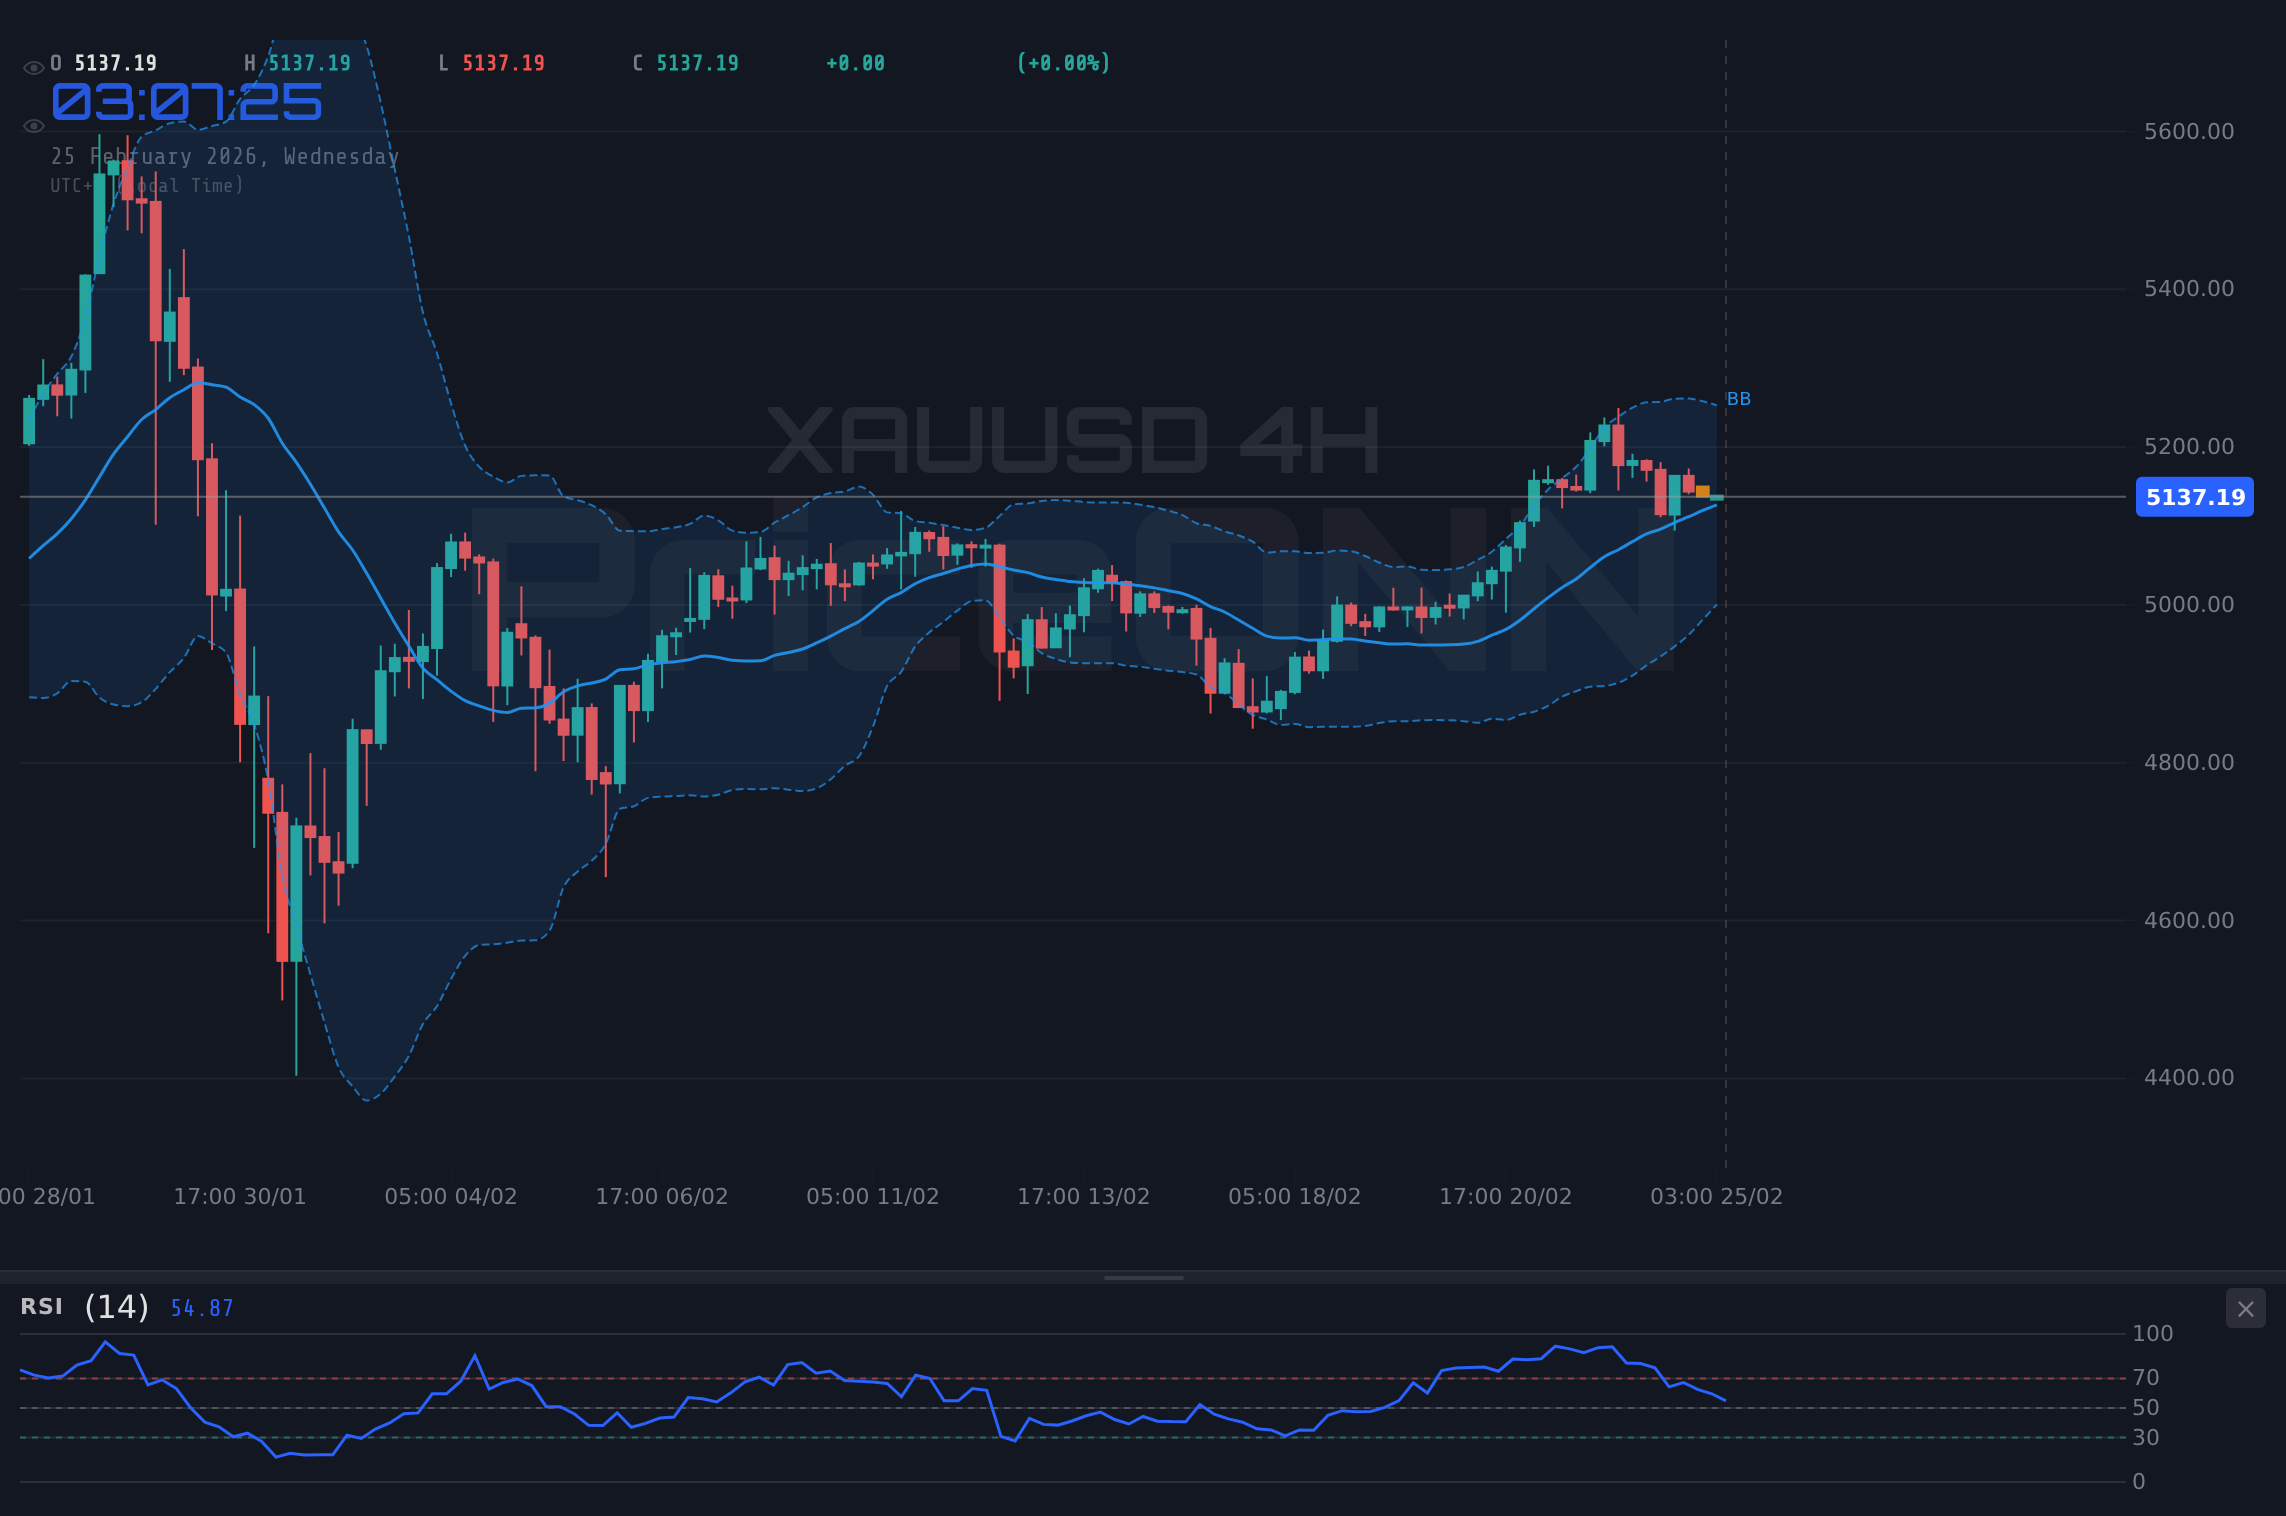
However, the bullish camp is not ready to throw in the towel just yet. They argue that the recent pullback is a healthy correction after a strong rally, and that gold remains fundamentally supported by inflation concerns and geopolitical risks. The 1D chart still shows an uptrend with 89% strength, and the RSI at 57.75 suggests that there is still room for further upside.
Indeed, the Stochastic oscillator on the 1D chart is showing a bullish signal, with %K at 88.96 and %D at 72.26. This suggests that the recent pullback may be overdone, and that gold could be poised for another leg higher. Moreover, the MACD on the 1D chart, while showing negative momentum, is still above the signal line, indicating that the long-term trend remains intact.
Economic Data and XAUUSD: What to Watch
Looking ahead, several key economic data releases could impact XAUUSD. Later this week, we have the release of [USD], a high-impact event that could significantly affect the dollar. The forecast is 216, up from the previous reading of 206. If the actual number comes in higher than expected, it could further strengthen the dollar and put downward pressure on gold. On the other hand, a weaker-than-expected number could provide a boost to XAUUSD.
We also have [USD] scheduled for release. The forecast is 0.3, down from the previous reading of 0.5. A weaker-than-expected number could signal a slowdown in the economy, which could lead to a more dovish stance from the Federal Reserve. This, in turn, could weaken the dollar and support gold. It is important to note that the market has already priced in a more hawkish Fed, so a surprise dovish signal could have a significant impact.
A Trader's Dilemma: Risk vs. Reward
So, what should a trader do in this situation? The answer, as always, depends on your risk tolerance and trading style. For aggressive traders, the recent pullback may represent a buying opportunity. They could look to enter long positions near the $5,134.17 support level, with a stop loss just below $5,124.68. The potential reward is a move back towards the recent highs near $5,249.61.
For more conservative traders, it may be prudent to wait for further confirmation before taking a position. They could look for a break above the $5,159.32 resistance level on the 1H chart as a signal that the bullish trend is resuming. Alternatively, they could wait for a break below the $5,124.68 support level as a signal that the bearish trend is gaining momentum.
Trade Plan: XAUUSD
XAUUSD bounces from $5,134.17 support and breaks above $5,159.32 resistance, targeting $5,174.98 and $5,184.47.
XAUUSD fails to hold $5,134.17 support, leading to a test of $5,124.68 and potentially $5,109.02.
Risk Management: The Golden Rule
Regardless of your trading style, it is crucial to manage your risk. Always use stop losses to protect your capital, and never trade with more than you can afford to lose. The market is a marathon, not a sprint, and the key to long-term success is to preserve your capital and wait for the right opportunities.
Historically, when the RSI reaches this zone on XAUUSD, the outcome has been mixed. Sometimes it leads to a reversal, and sometimes it leads to a continuation of the trend. This is why it is so important to use multiple indicators and to consider the overall market context before making a trading decision.
Actionable Insight: Watch the DXY
The most actionable insight right now is to watch the DXY. If the dollar continues to strengthen, it will likely put further downward pressure on gold. On the other hand, if the dollar weakens, it could provide a boost to XAUUSD. The key is to be patient and wait for the market to give you a clear signal.
Having tracked XAUUSD through the 2024 rate cycle, I've learned that patience is often rewarded. The market always gives a second chance, and the key is to be ready to seize the opportunity when it presents itself. Manage your risk, wait for your setup, and the market will reward you.
Frequently Asked Questions: XAUUSD Analysis
Is XAUUSD a good buy right now?
XAUUSD is at $5,148.40. It's not a clear buy right now as it's pulling back. Wait for a confirmed bounce above $5,159.32 or a break below $5,134.17 to make a decision.
What is the XAUUSD price forecast for this week?
The forecast is mixed. If $5,134.17 holds, we could see a move towards $5,249.61. However, a break below that level could lead to a test of $5,109.02. The probability is roughly 60% bullish, 40% bearish.
What are the key support and resistance levels for XAUUSD?
Key support levels are at $5,134.17 and $5,124.68. Resistance levels to watch are $5,159.32 and $5,174.98. These levels will likely dictate the short-term direction of XAUUSD.
Why is XAUUSD moving today?
XAUUSD is primarily moving due to a stronger dollar (DXY at 97.59) and some risk aversion in the market. Economic data releases and Fed expectations are also playing a role.
Track markets in real-time
AI-powered analysis, technical indicators and real-time price data.
Join Our Telegram Channel
Breaking market news, AI analysis and trading signals instantly.
Join Channel