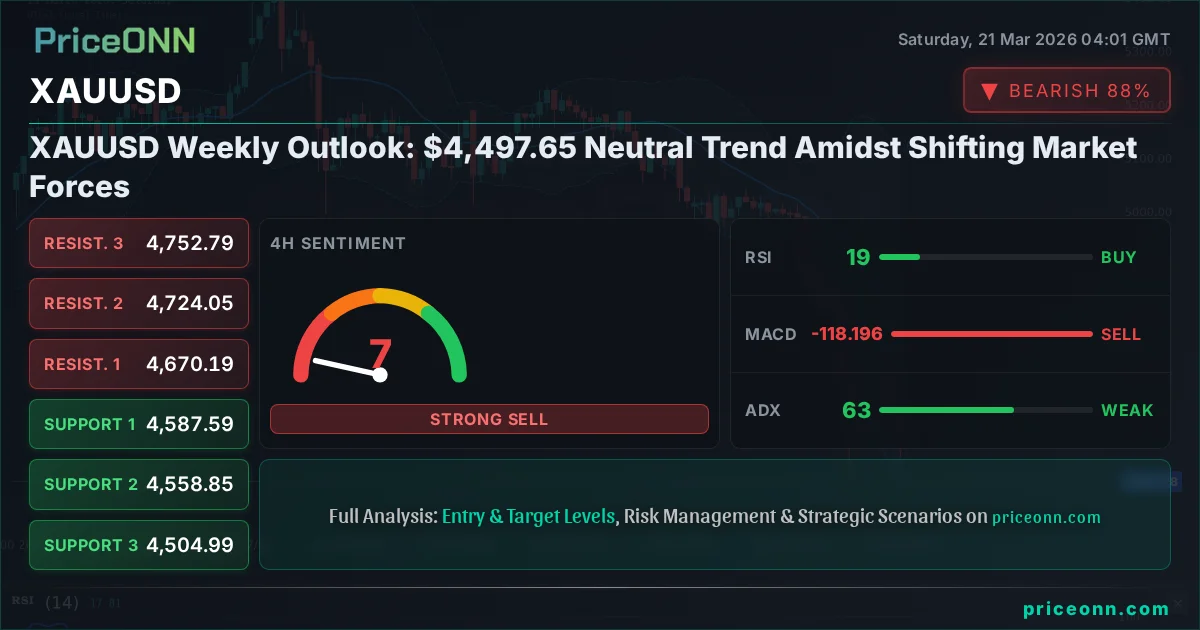
Last week saw a significant downturn for gold, with XAUUSD closing down 3.28% at $4,497.65. This marks a sharp reversal from previous trends and places the precious metal in a technically neutral but sentimentally bearish position. As we enter a new trading week, the market grapples with conflicting signals: persistent geopolitical tensions that typically support gold, yet rising U.S. yields and a strengthening dollar are actively dimming its safe-haven appeal. Understanding the interplay between these forces is crucial for navigating the week ahead.
- RSI at 29.58 on the daily chart indicates oversold conditions, but the ADX at 19.51 suggests a weak trend, meaning a bounce is not guaranteed.
- Critical support for XAUUSD is established at $4,479.29, having been tested multiple times this week; a break below this level could trigger further downside.
- MACD momentum remains negative across all timeframes, signaling that selling pressure is still dominant despite oversold RSI readings.
- The correlation with a strengthening DXY (currently at 99.39) is a key headwind, as higher U.S. yields diminish gold's attractiveness as an alternative store of value.
The dramatic 3.28% weekly decline in gold, closing at $4,497.65, is a stark reminder of how quickly market sentiment can shift. While geopolitical tensions in the Gulf and broader global uncertainties typically fuel demand for safe-haven assets like gold, the prevailing narrative has been dominated by rising U.S. yields and a hawkish stance from the Federal Reserve. This economic backdrop is creating a powerful headwind for bullion, pushing it lower despite the underlying geopolitical instability. The fact that gold tumbled over 8% in the past week, as reported by some sources, underscores the intensity of the selling pressure. This kind of sharp depreciation often signals a capitulation phase, where even traditionally supportive factors struggle to hold the price.
The Dominance of Yields and Dollar Strength
The narrative of higher-for-longer interest rates in the U.S. is proving to be a significant drag on gold. As the Federal Reserve signals a more hawkish approach, U.S. Treasury yields have climbed. The DXY, or Dollar Index, currently trading at 99.39 and showing a strong upward trend on the daily chart, reflects this strength. When the dollar strengthens, it typically makes dollar-denominated assets, like gold, more expensive for holders of other currencies, thereby reducing demand. This inverse correlation between the DXY and XAUUSD is a fundamental driver that cannot be ignored. The market is pricing in fewer rate cuts, or even potential hikes, which boosts the yield on dollar-denominated assets, making them more attractive than non-yielding gold. This is a critical factor that investors must monitor closely as it directly impacts gold's appeal as a store of value.
The recent news highlighting gold's tumble below $4,500 due to rising U.S. yields and diminishing safe-haven appeal perfectly encapsulates this dynamic. The market is prioritizing yield over perceived safety, a shift that has significant implications for precious metals. While geopolitical risks remain elevated, the economic calculus is currently overriding them. This suggests that any geopolitical flare-ups might only provide temporary relief for gold prices unless they directly threaten global economic stability or lead to a significant shift in central bank policy.
Technical Breakdown: A Picture of Weakness
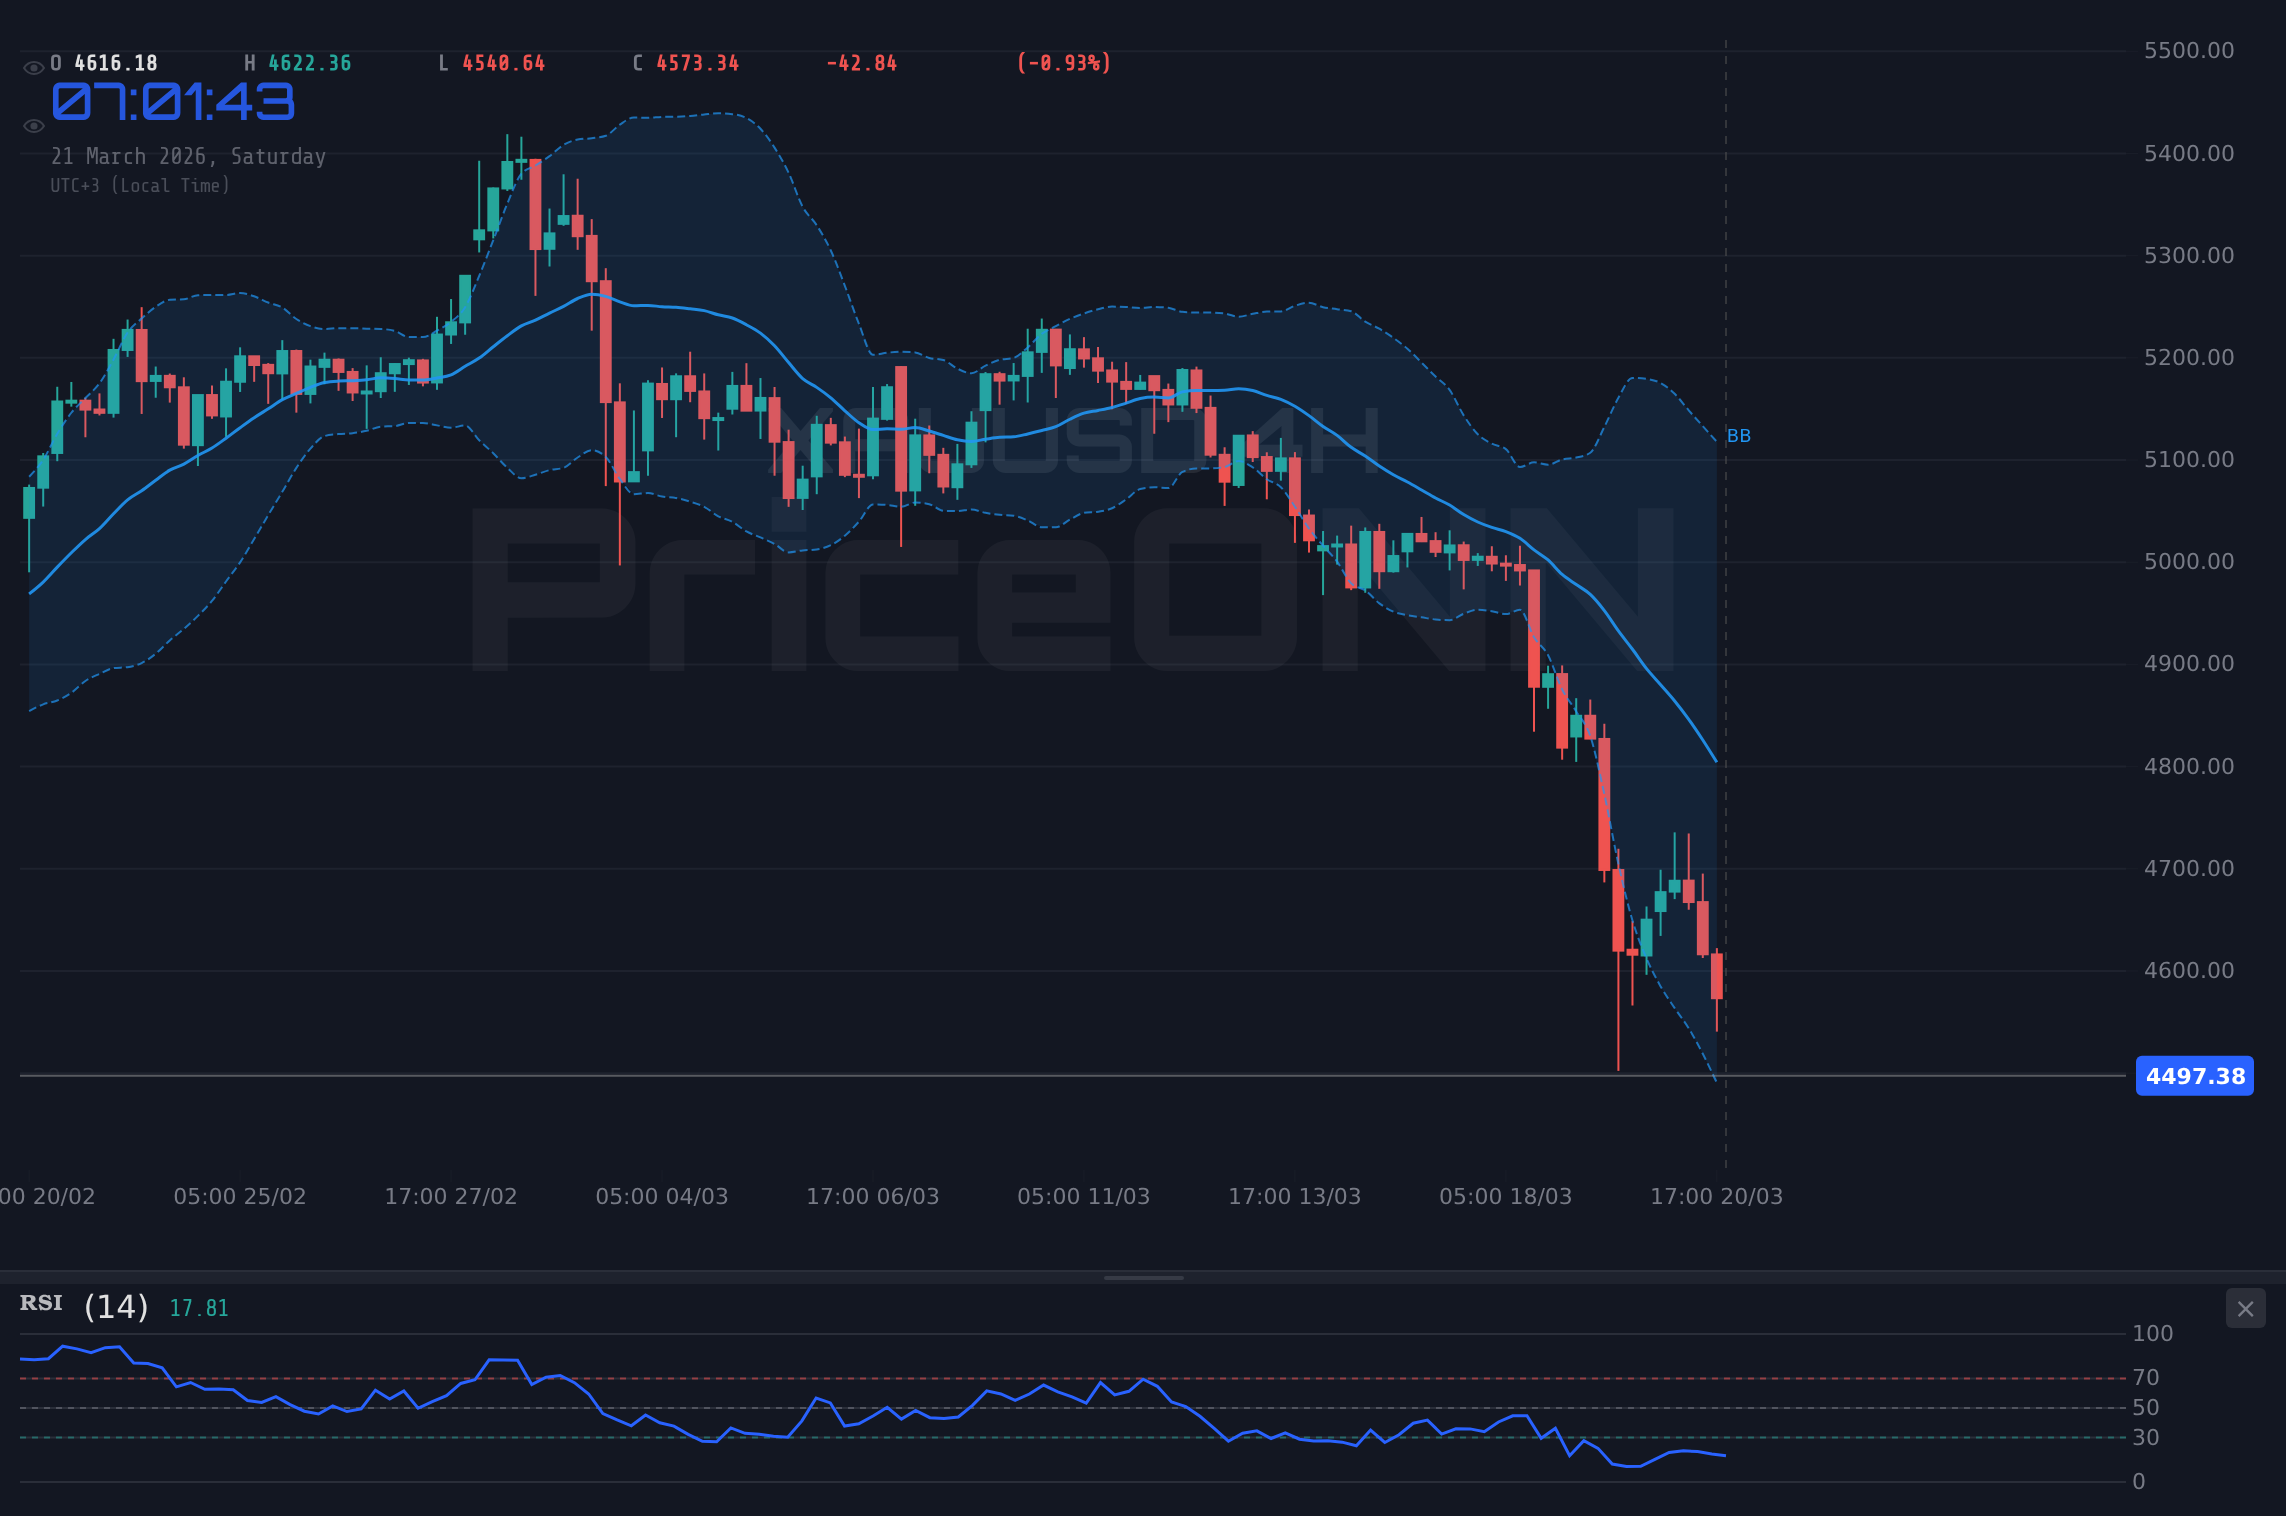
From a technical standpoint, the picture for XAUUSD is unequivocally bearish across multiple timeframes, despite some oversold signals on shorter-term charts. The daily chart shows the price trading below the lower Bollinger Band at $4,479.29, a sign of extreme selling pressure. The RSI(14) is at 29.58, firmly in oversold territory, which historically can signal a potential bounce. However, the ADX on the daily chart is only 19.51, indicating a weak trend, which means that oversold conditions might persist without a significant reversal. The MACD indicator also remains firmly negative, with the MACD line below its signal line, confirming the prevailing downward momentum. This confluence of indicators suggests that while a short-term bounce is possible, the underlying trend is still down, and any rallies may be met with renewed selling pressure.
The 4-hour timeframe paints an even starker picture. The trend is definitively bearish with 100% strength, and the ADX is a staggering 62.9, indicating a very strong downward trend. The RSI is deeply oversold at 19.17, and the Stochastic Oscillator is showing K=25.57, D=34.97, reinforcing the bearish sentiment. The price is trading well below the middle Bollinger Band, and the general signal across this timeframe is a strong sell. This suggests that any short-term recovery attempts are likely to face significant resistance from sellers who are firmly in control of the market. The 1-hour timeframe also shows a bearish trend with 91% strength, RSI at 28.95, and ADX at 31.58, further confirming the dominant bearish sentiment. The technical setup across these timeframes indicates that the path of least resistance for gold is currently downwards.
The Bullish Scenario: A Fragile Hope
For gold prices to stage a meaningful recovery, several conditions must be met. The primary trigger for a bullish reversal would be a decisive break and sustained hold above the immediate resistance level of $4,559.54 on the 1-hour chart. This level, representing the upper boundary of the recent trading range, needs to be cleared with increasing volume to signal genuine buying interest. If this resistance is broken, the next significant hurdle would be the $4,619.31 level. A move above this would suggest that the bears are losing control and that a short-covering rally could be underway. The ultimate confirmation of a bullish trend reversal would be a sustained move above the daily resistance level of $4,844.03. Such a move would signal a complete shift in market sentiment and could open the door for a retest of higher psychological levels, potentially targeting $5,000 and beyond.
However, this bullish scenario is contingent on several factors. Firstly, a significant shift in macroeconomic data, such as weaker-than-expected U.S. inflation figures or a more dovish tone from the Federal Reserve, would be necessary to undermine the current yield-driven narrative. Secondly, an escalation of geopolitical tensions that directly threatens global supply chains or energy security could reignite safe-haven demand. Without these catalysts, the bullish case remains weak. The RSI would need to move decisively above 50, and the MACD would need to generate a bullish crossover, confirming a pickup in upward momentum. The probability of this scenario playing out in the short term, given the current technical and fundamental backdrop, is relatively low. The invalidation of this bullish thesis would occur if price fails to break above $4,559.54 and instead falls back towards the support at $4,458.67.
The Bull's Gambit: A Tentative Bounce
15% ProbabilityThe Bearish Scenario: Further Downside Ahead
The bearish outlook for gold appears to be the most probable scenario, given the current market conditions and technical indicators. The immediate trigger for further downside would be a decisive break below the daily support level of $4,479.29. This level has acted as a temporary floor, but its repeated testing suggests it is weakening. A close below this mark on increased volume would likely trigger stop-loss orders, accelerating the decline towards the next support at $4,417.57. If this level also fails to hold, the path would be cleared for a move towards the more significant support at $4,357.80.
The technical indicators strongly support this bearish view. The ADX at 19.51 on the daily chart, while indicating a weak trend, doesn't prevent further declines, especially when coupled with oversold RSI and negative MACD momentum. On the 4-hour chart, the ADX at 62.9 signals a very strong downtrend, and a break below $4,479.29 would align perfectly with this aggressive trend. Geopolitical tensions, while present, are not currently strong enough to override the macro-economic headwinds of rising yields and a strong dollar. Therefore, the bearish scenario anticipates a continuation of the current downtrend, with potential targets being the support levels identified. The invalidation of this bearish thesis would occur if price were to decisively break above the $4,559.54 resistance and then sustain a move above $4,619.31, suggesting a potential bottom has been put in place.
The Bear's Grip: Continued Decline
65% ProbabilityThe Consolidation Scenario: A Waiting Game
In the absence of clear catalysts to drive a strong directional move, gold could enter a period of consolidation. This scenario typically occurs when opposing forces - geopolitical risk appetite versus macroeconomic headwinds - are in a delicate balance. If XAUUSD fails to break decisively below $4,479.29 and also struggles to overcome $4,559.54, it could become range-bound. This would likely involve trading between these two key levels, with potential volatility within the range as traders react to news flow.
The technical indicators might offer clues if consolidation is imminent. A daily ADX below 20 would strongly suggest a lack of trend, reinforcing the range-bound thesis. The RSI might hover around the 30-50 level, indicating neither extreme overbought nor oversold conditions. During such a phase, price action would become more choppy, and smaller retracements within the range could occur before a larger move eventually breaks the pattern. The trigger for this scenario would be the failure of price to decisively break either the immediate support or resistance levels within the next few trading sessions. The invalidation would occur if either the bullish or bearish scenario's trigger conditions are met. While this scenario represents a pause, it often precedes a more significant breakout as underlying pressures build.
The Sideways Squeeze: Range-Bound Trading
20% ProbabilityThe Most Likely Path Forward
Considering the current technical setup and the prevailing macroeconomic narrative, the bearish scenario appears to be the most probable path for XAUUSD in the immediate term. The strong downtrend signals on the 4-hour and 1-hour charts, coupled with the persistent strength of the DXY and rising U.S. yields, create significant headwinds. While the daily RSI is oversold, the weak daily ADX suggests that this condition might persist without a sharp reversal. The market is currently prioritizing yield over safe-haven demand, a sentiment that is unlikely to change without a significant macroeconomic shock or a dovish pivot from the Federal Reserve.
The probability assigned to the bearish scenario is 65%, reflecting the strong technical alignment and fundamental headwinds. The neutral scenario, with a 20% probability, remains a possibility if geopolitical events intensify without a corresponding shift in Fed policy, creating a tug-of-war. The bullish scenario, with only a 15% probability, would require a confluence of significant positive catalysts, including a dovish Fed surprise and a clear break of key resistance levels that are currently holding firm. Therefore, traders should remain cautious and prepared for potential further downside, focusing on risk management and waiting for clear confirmation before considering any long positions.
What I'm Watching This Week
As we look ahead, several key triggers will dictate the direction of XAUUSD. Firstly, the ability of the price to hold above the critical daily support at $4,479.29 is paramount. A failure here would likely accelerate the downward move. Secondly, I will be closely watching the U.S. Dollar Index (DXY) and U.S. Treasury yields. Any signs of weakness in the dollar or a dip in yields could provide a temporary reprieve for gold. Conversely, continued strength in the DXY, currently trading at 99.39, will likely keep gold under pressure. Finally, any significant geopolitical developments that increase global risk aversion could temporarily override the macro-economic concerns, but the sustainability of such a move remains questionable given the current yield environment.
The upcoming week's economic calendar, while not featuring major high-impact events like NFP or CPI, will still provide crucial data points. Any speeches from Federal Reserve officials will be scrutinized for hints about future monetary policy. Unexpected shifts in inflation or employment data could also influence market sentiment. For traders, the focus should remain on price action around the key levels of $4,479.29 and $4,559.54. A decisive move beyond either of these levels will likely dictate the short-to-medium term direction for gold. Patience and disciplined risk management will be essential in navigating this potentially volatile period.
| Indicator | Value | Signal | Interpretation |
|---|---|---|---|
| RSI (14) | 29.58 | Oversold | Potential for bounce, but trend weakness limits upside. |
| MACD Histogram | -15.20 | Negative Momentum | Sellers are in control; downward pressure persists. |
| Stochastic (%K) | 8.5 | Oversold | Extreme oversold conditions may precede a reversal, but confirmation is needed. |
| ADX | 19.51 | Weak Trend | Current lack of strong trend suggests consolidation or trend continuation is uncertain. |
| Bollinger Bands | Lower Band | Below Band | Price is trading outside the lower band, indicating extreme bearish pressure. |
Frequently Asked Questions: XAUUSD Analysis
What happens if XAUUSD breaks below the $4,479.29 support level?
A break below $4,479.29 on the daily chart would invalidate the current neutral stance and likely trigger further selling pressure. The immediate downside target would be $4,417.57, with a more significant support level at $4,357.80. This move would confirm the prevailing bearish sentiment driven by higher yields and a strong dollar.
Is the current RSI reading of 29.58 a buy signal for XAUUSD at $4,497.65?
While an RSI of 29.58 is technically oversold, it does not automatically translate to a buy signal, especially with a weak ADX of 19.51 indicating a lack of trend. The negative MACD momentum also suggests that selling pressure is still dominant. A confirmed buy signal would require price to break key resistance levels like $4,559.54 and for RSI to move convincingly above 50.
How will the strengthening DXY at 99.39 affect XAUUSD's trend analysis this week?
The DXY at 99.39, showing a strong upward trend on the daily chart, acts as a significant headwind for XAUUSD. This strengthens the bearish outlook, as a stronger dollar makes gold more expensive for foreign buyers and reduces its appeal as an alternative asset. Traders should monitor the DXY for any signs of weakness, as this could provide some relief for gold prices.
What is the most probable scenario for XAUUSD given the current technicals and macro drivers?
The most probable scenario, with a 65% probability, is further downside for XAUUSD. This is driven by strong bearish technical signals across multiple timeframes and macroeconomic headwinds from rising U.S. yields and a strong dollar. Key support at $4,479.29 needs to hold to prevent a sharper decline towards $4,417.57.
Track markets in real-time
AI-powered analysis, technical indicators and real-time price data.
Join Our Telegram Channel
Breaking market news, AI analysis and trading signals instantly.
Join Channel