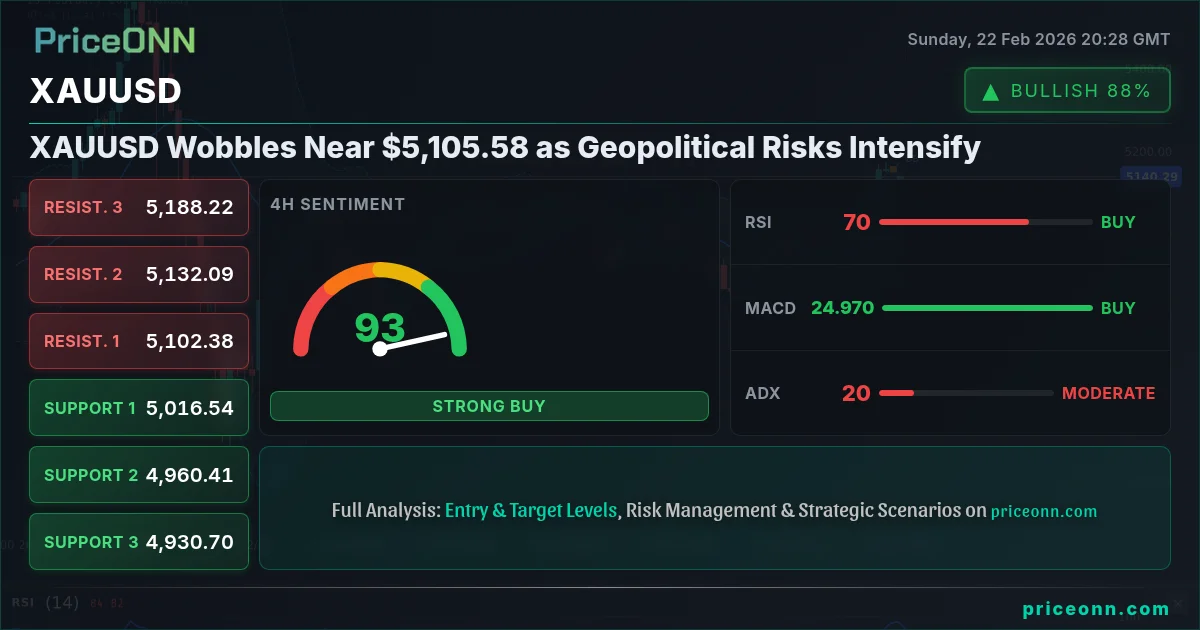
As global uncertainties mount, XAUUSD finds itself in a precarious position near $5,105.58. Escalating geopolitical tensions are providing a tailwind, but a strengthening dollar and looming retail data releases next week are casting a shadow over the precious metal's prospects.
- XAUUSD hovers around $5,105.58 amid conflicting signals from geopolitical risks and DXY strength.
- Key support lies at $5,072.12 on the 1H timeframe, tested multiple times this week.
- MACD histogram on the 1H chart shows positive momentum, but RSI at 73.63 indicates overbought conditions.
- Upcoming U.S. retail data releases will likely drive XAUUSD correlation with DXY.
Last Week's Price Action: A Geopolitical Rollercoaster
Last week was a whirlwind for XAUUSD, marked by a series of geopolitical events that sent the precious metal on a rollercoaster ride. Heightened tensions in the Middle East, coupled with ongoing concerns about global economic growth, fueled safe-haven demand, pushing gold prices to new highs. However, a resurgence in the U.S. dollar, driven by hawkish comments from Federal Reserve officials, capped the upside potential.
Gold's surge above $5,060, as reported by PriceONN on February 21st, initially sparked hopes of a new bull run. However, the rally faced headwinds as the dollar strengthened, leading to a pullback from the $5,000 level. The tug-of-war between safe-haven demand and dollar strength has kept XAUUSD in a state of flux, making it challenging for traders to establish a clear directional bias.
According to Reuters, Fed officials emphasized that inflation remained 'stubbornly high,' dampening expectations of imminent interest rate cuts. This hawkish stance bolstered the dollar, weighing on gold prices. The SP500 index, meanwhile, displayed resilience, trading around 6904.87, suggesting that risk appetite hasn't completely evaporated, further complicating the outlook for XAUUSD.
XAUUSD Technical Analysis: A Battleground of Signals
From a technical perspective, XAUUSD presents a mixed bag of signals. On the 1H timeframe, the trend is bullish with a strength of 91%, but the RSI at 73.63 indicates overbought conditions, suggesting a potential for a pullback. The MACD histogram shows positive momentum, but the stochastic oscillator, with K=97.87 and D=91.2, is also flashing overbought signals, reinforcing the possibility of a near-term correction.
The ADX on the 1H chart reads 12.56, signaling a weak trend. This lack of strong directional conviction adds to the uncertainty surrounding XAUUSD's short-term trajectory. A weak ADX suggests that the current rally may lack staying power, making it vulnerable to a reversal.
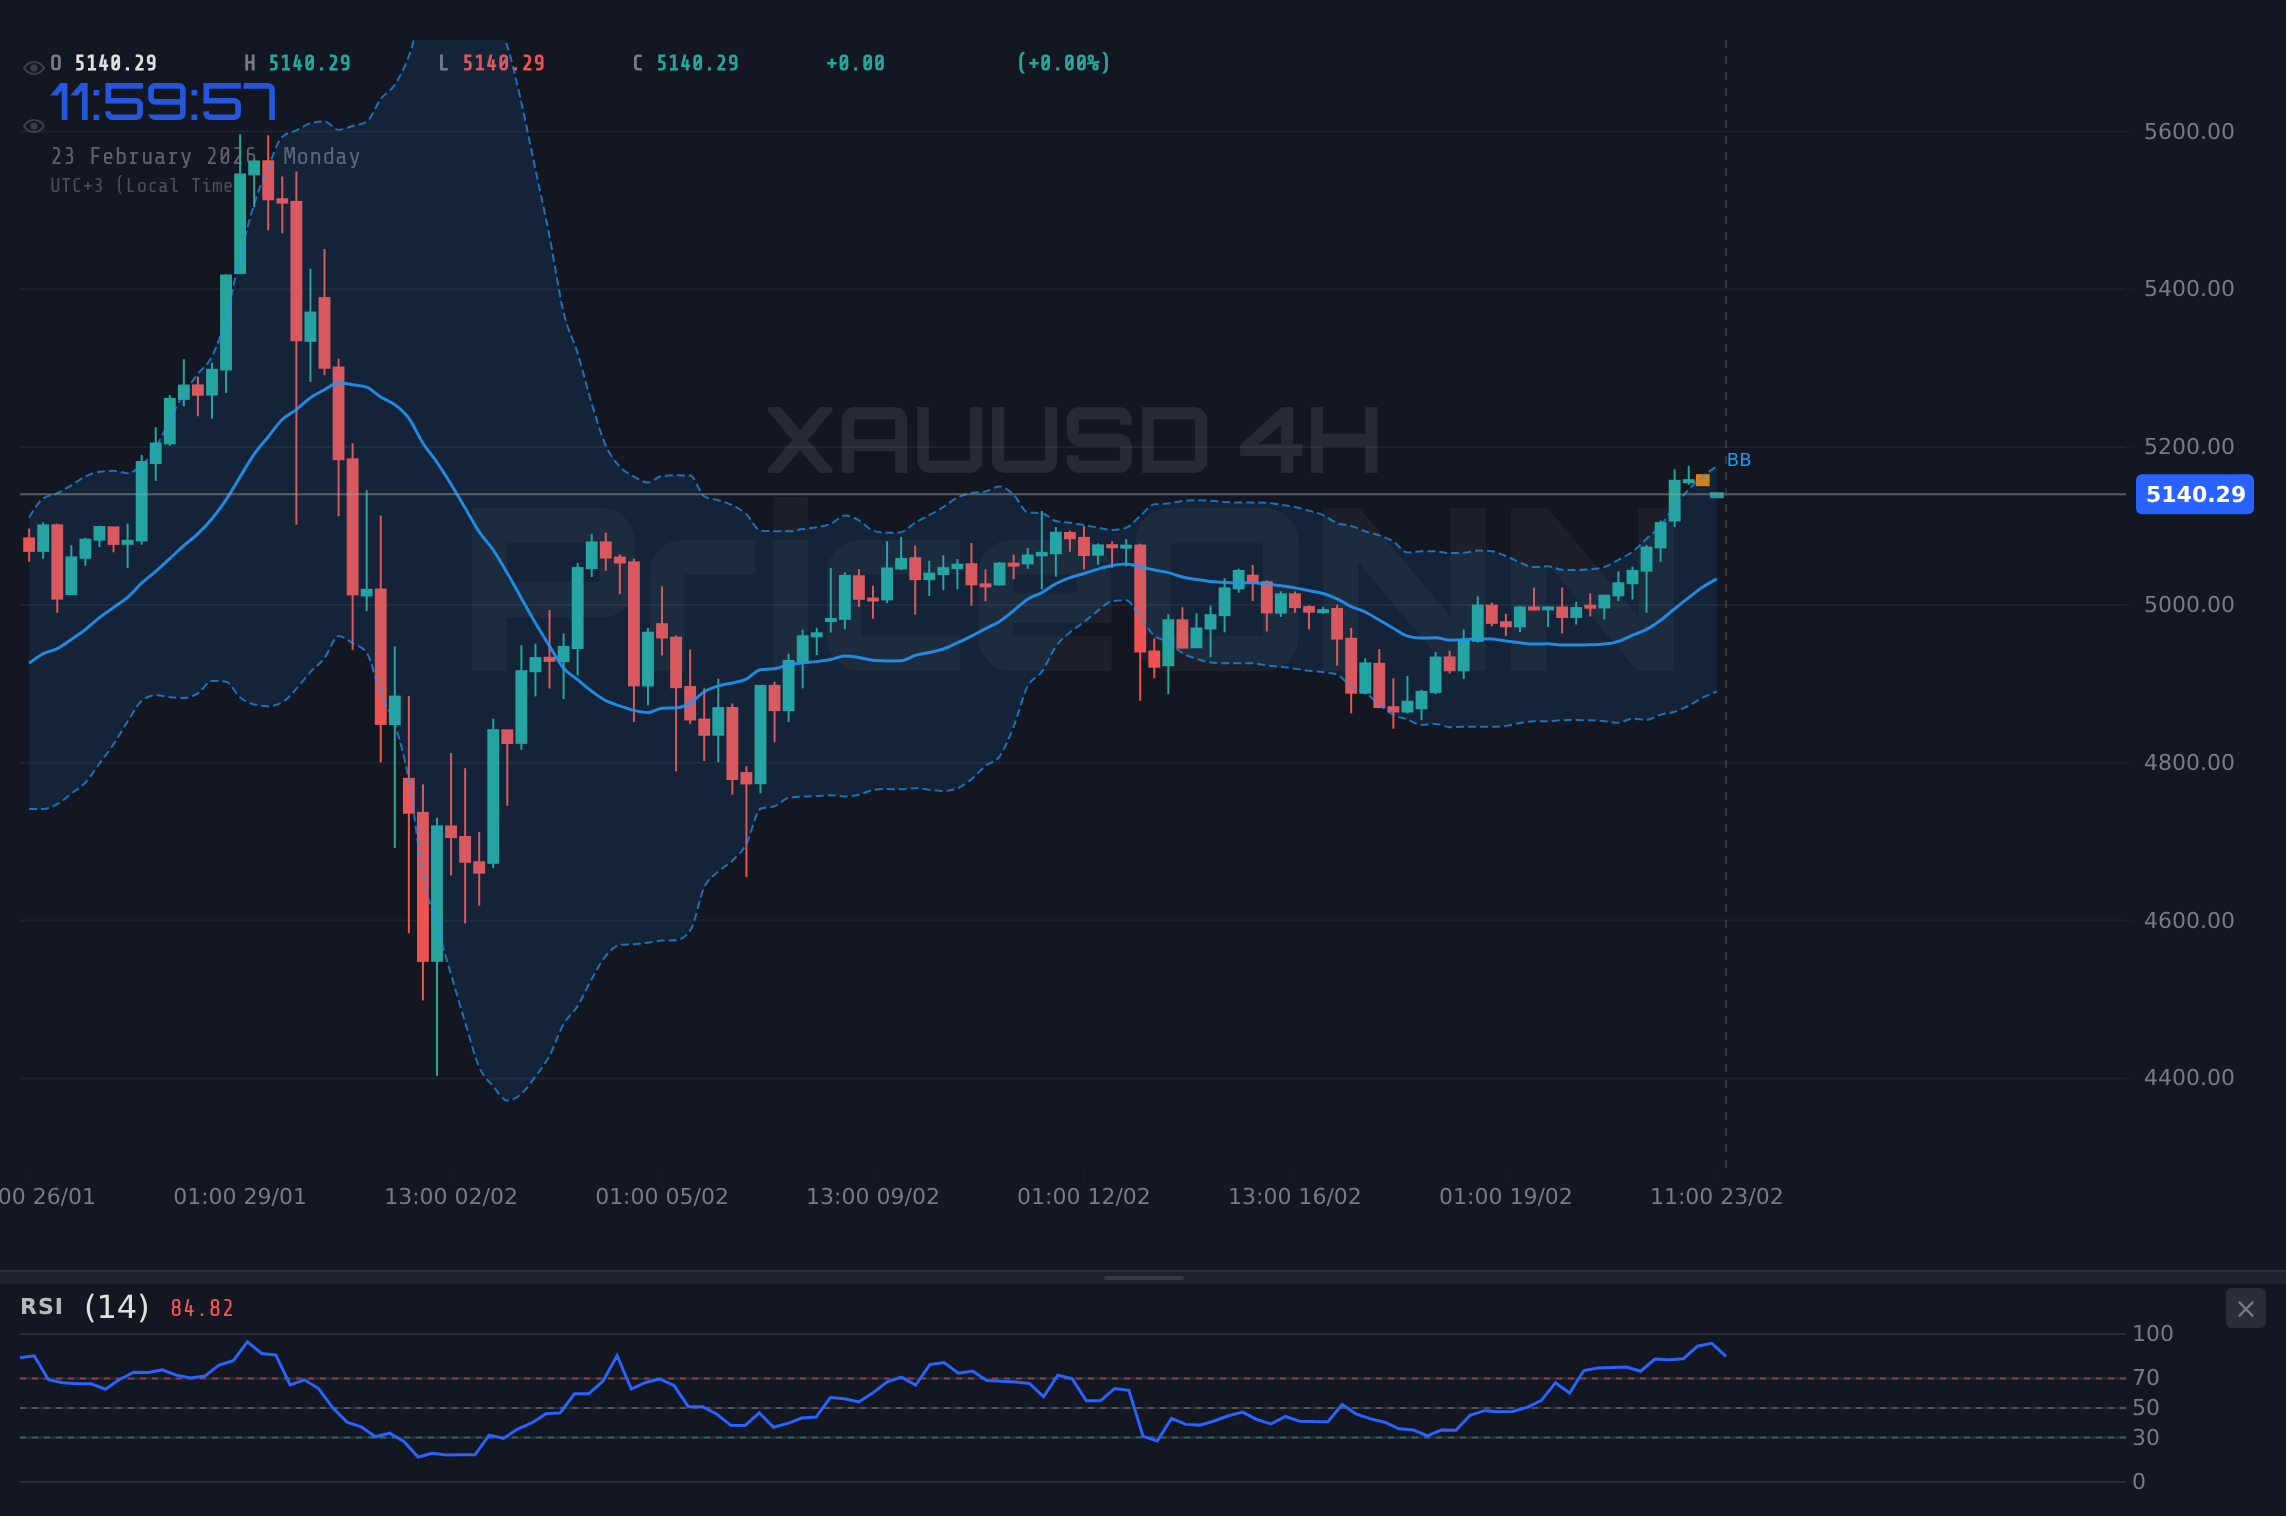
Zooming out to the 4H timeframe, the trend shifts to neutral, with a strength of 50%. The RSI at 69.6 is approaching overbought territory, while the MACD continues to show positive momentum. The stochastic oscillator, with K=91.81 and D=79.08, is also signaling overbought conditions. The ADX remains weak at 19.5, further highlighting the lack of a clear directional bias.
On the daily chart, the trend is bullish with a strength of 85%, but the MACD histogram is showing negative momentum, creating a divergence that warrants caution. The RSI at 57.57 is in neutral territory, while the stochastic oscillator, with K=73.3 and D=68.73, is signaling a potential for further upside. The ADX remains weak at 19.59, suggesting that the current rally may be losing steam.
Key Levels to Watch: $5,072.12 is the Line in the Sand
The near-term outlook for XAUUSD hinges on its ability to hold key support levels. On the 1H timeframe, immediate support lies at $5,072.12, followed by $5,064.93 and $5,061.13. A break below $5,072.12 could trigger a deeper correction, potentially sending XAUUSD back towards the $5,000 level.
On the upside, immediate resistance is seen at $5,083.11, followed by $5,086.91 and $5,094.1. A sustained break above $5,083.11 could pave the way for a retest of the recent highs near $5,106.88. However, given the overbought conditions and the weak ADX, a breakout above $5,083.11 appears unlikely in the near term.
The 4H timeframe reveals a broader range of support and resistance levels. Key support lies at $5,017.18, followed by $4,991.17 and $4,975.49. On the upside, resistance is seen at $5,058.87, followed by $5,074.55 and $5,100.56. These levels provide a broader framework for assessing XAUUSD's potential trading range in the coming days.
Risks to the Bullish Thesis: DXY Strength and Inflation Data
The primary risk to the bullish thesis for XAUUSD is the potential for further dollar strength. The DXY currently trades at 97.44, and a sustained break above this level could put significant pressure on gold prices. The DXY's 4H timeframe shows a bullish trend with a strength of 100%, and the ADX at 44.84 confirms the strength of the uptrend. If the DXY continues to climb, XAUUSD could face a significant headwind.
Another key risk is the upcoming retail data releases. If these data points surprise to the upside, it could reinforce the Fed's hawkish stance, further boosting the dollar and weighing on gold. The economic calendar is full of USD events, with multiple high importance events scheduled. Strong retail data could trigger a significant sell-off in XAUUSD, especially given the overbought conditions and the weak ADX.
Trading Strategy: Patience is Key
Given the conflicting signals and the looming risks, patience is paramount when trading XAUUSD. While the long-term outlook for gold remains constructive, the near-term picture is clouded by uncertainty. Traders should avoid chasing the rally and instead focus on identifying potential pullback opportunities.
One potential strategy is to wait for a break below the key support level of $5,072.12 on the 1H timeframe. A confirmed break below this level could signal the start of a deeper correction, providing an opportunity to enter short positions with a target near $5,000. However, traders should be mindful of the potential for a false breakout and use appropriate risk management techniques.
Alternatively, traders could wait for a pullback towards the $5,000 level and look for signs of a bottom. A bullish reversal pattern near this level, coupled with a weakening dollar, could provide an opportunity to enter long positions with a target near the recent highs of $5,106.88. However, traders should be prepared to cut their losses if the pullback turns into a full-blown sell-off.
Expert Commentary: What the Pros Are Watching
Market analysts are closely monitoring the interplay between geopolitical risks, dollar strength, and inflation expectations. According to Bloomberg, central banks are expected to maintain a cautious stance on interest rates, which could provide some support for gold prices. However, analysts also warn that a stronger dollar could offset any gains from safe-haven demand.
The Financial Times reports that institutional investors are increasing their exposure to gold, citing concerns about global economic growth and rising inflation. This suggests that the long-term outlook for gold remains positive, despite the near-term volatility. However, traders should be mindful of the potential for a shift in sentiment, especially if economic data improves and the Fed signals a more hawkish stance.
The Week Ahead: Retail Data and Geopolitical Developments
The coming week promises to be another eventful one for XAUUSD, with a series of key economic data releases and geopolitical developments on the horizon. The primary focus will be on the U.S. retail data, which is expected to provide further clues about the strength of the U.S. economy and the Fed's potential policy response. Better-than-expected data could boost the dollar and weigh on gold, while weaker-than-expected data could have the opposite effect.
Traders should also keep a close eye on geopolitical developments, as any escalation in tensions could trigger a fresh wave of safe-haven demand. The ongoing conflict in Ukraine, coupled with rising tensions in the Middle East, continues to pose a significant risk to global stability. A sudden surge in geopolitical risk could send gold prices soaring, regardless of the dollar's performance.
Frequently Asked Questions: XAUUSD Analysis
Is XAUUSD a good buy right now?
XAUUSD is trading around $5,105.58, and while the long-term outlook is positive, overbought conditions suggest caution. A pullback to $5,072.12 could present a buying opportunity if support holds, but a break below this level could signal further downside.
What is the XAUUSD price forecast for this week?
The XAUUSD price forecast for this week is mixed. A sustained break above $5,083.11 could lead to a retest of the recent highs near $5,106.88, but a stronger dollar could limit upside potential. Expect a trading range between $5,000 and $5,100, with a slight bearish bias.
What are the key support and resistance levels for XAUUSD?
Key support levels for XAUUSD are $5,072.12, $5,064.93, and $5,061.13. Key resistance levels are $5,083.11, $5,086.91, and $5,094.1. These levels provide a framework for assessing potential trading opportunities.
Why is XAUUSD moving today?
XAUUSD is currently moving due to a combination of factors, including geopolitical tensions, dollar strength, and technical signals. Overbought conditions and a weak ADX suggest that the rally may be losing steam, while a stronger dollar could trigger a correction.
Track markets in real-time
AI-powered analysis, technical indicators and real-time price data.
Join Our Telegram Channel
Breaking market news, AI analysis and trading signals instantly.
Join Channel