Is GBP/USD Headed for Further Declines as Key Resistance Holds Firm?

Market Context
Sterling has experienced a notable downturn against the US Dollar, shedding recent gains and trading below the key 1.3300 psychological level. This move signals increasing bearish sentiment, further evidenced by the formation of a downward-sloping trend line on the 4-hour chart, which now acts as resistance at approximately 1.3380. The broader market mood appears to be one of risk aversion, with gold prices also experiencing a significant sell-off, dropping from highs near $5,050 to below the $5,000 mark. The Euro is also showing signs of weakness, with EUR/USD encountering resistance near 1.1550 and 1.1565.
Analysis & Drivers
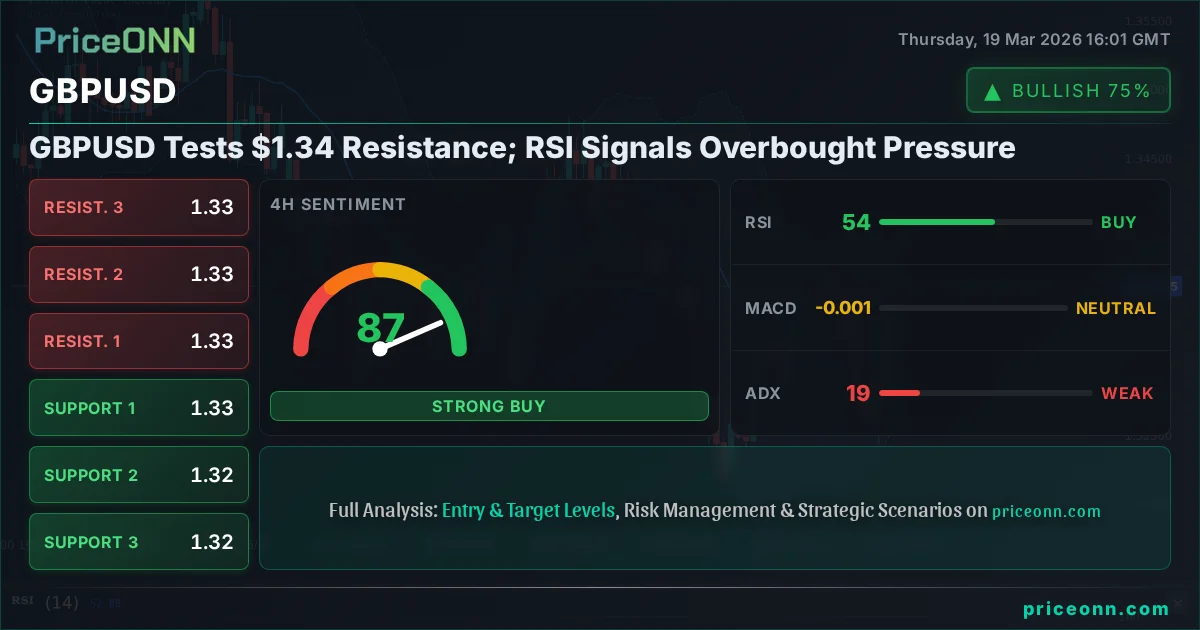
The inability of GBP/USD to sustain its position above the 1.3380 resistance zone is a critical development for currency traders. The pair has not only broken below 1.3350 but is now consolidating these losses, indicating that the immediate path higher is fraught with obstacles. Several technical indicators are converging to form a formidable barrier in the 1.3380 area. This includes the 100-period simple moving average (SMA), the 200-period SMA, and the aforementioned bearish trend line. Adding to the complexity, this resistance zone also aligns with the 61.8% Fibonacci retracement level of the prior move from the 1.3483 peak down to the recent trough of 1.3219. The intraday trading session saw a sharp dip to 1.3219, highlighting the vulnerability of Sterling at these levels. The current technical landscape suggests that a significant bullish resurgence for GBP/USD would require a decisive break and sustained hold above this multi-layered resistance.
Trader Implications
Traders are advised to monitor the 1.3380 level closely as a critical inflection point for GBP/USD. A failure to break through this resistance, especially with increasing bearish momentum, could lead to further downside pressure, with the next potential support level to watch being the recent low around 1.3219. Conversely, a strong breakout above 1.3380, ideally accompanied by increased trading volume, could signal a potential reversal and open the door for a move towards the 1.3420 level. Upcoming economic data releases from the UK, particularly employment figures, and any commentary from the Bank of England (BoE) will be crucial in shaping market sentiment and could provide the catalyst for a decisive move. Investors are also keeping a close eye on US economic indicators and Federal Reserve policy signals, which continue to influence the broader US Dollar strength.
Outlook
The immediate outlook for GBP/USD remains cautious as it battles significant technical resistance. The confluence of moving averages and Fibonacci retracement levels around 1.3380 presents a formidable challenge for Sterling bulls. Should this resistance hold, the pair could retest recent lows, especially if upcoming economic data fails to provide a supportive boost. Market participants will be keenly awaiting the Bank of England's next policy meeting and key employment statistics, which could inject volatility into the pair. A sustained break above 1.3380 is necessary to shift the technical picture to a more constructive outlook, but for now, the bears appear to have the upper hand.
Frequently Asked Questions
What is the key resistance level for GBP/USD currently?
The key resistance level for GBP/USD is currently situated around 1.3380. This area is a confluence of a bearish trend line, the 100-period SMA, and the 61.8% Fibonacci retracement level, making it a significant hurdle for any upward price movement.
What economic events should traders watch for GBP/USD?
Traders should closely monitor upcoming employment data from the United Kingdom and any statements or policy indications from the Bank of England (BoE). These events could provide the necessary catalysts to break the current resistance or confirm further downside.
Could GBP/USD fall below 1.3200?
Yes, if the 1.3380 resistance holds firm and negative sentiment persists, GBP/USD could retest the recent low of 1.3219. A break below this level could indeed open the door for a move towards the 1.3200 psychological barrier.
Track markets in real-time
Empower your investment decisions with AI-powered analysis, technical indicators and real-time price data.
Join Our Telegram Channel
Get breaking market news, AI analysis and trading signals delivered instantly to your Telegram.
Join Channel


PriceONN