Is Gold's Brutal Selloff Over as Liquidity Squeeze Eases Near $4,500?
Market Context
Gold prices have found a tentative pause near the $4,500 mark following a brutal and disorderly decline witnessed yesterday. This sharp downturn appears to have been exacerbated by a significant liquidity crunch, indicating that market plumbing issues, rather than purely fundamental economic drivers, dictated price movements. While hawkish signals from major central banks this week, including the Federal Reserve, European Central Bank, Bank of England, and Bank of Japan, certainly set a challenging tone for gold, the sheer velocity and scale of the subsequent drop point towards a market dislocation. The critical breach below the psychologically significant $5,000 level unleashed a torrent of margin calls on highly leveraged positions. This cascade triggered further liquidation, a classic pattern often seen during liquidity stress where trading mechanics overwhelm underlying value considerations.
Adding to the selling pressure, substantial outflows were recorded from major gold-backed exchange-traded funds. Significant redemptions from prominent funds underscore the aggressive unwinding of institutional positions. Intriguingly, this sharp selloff coincided with a softening U.S. Dollar, which further reinforces the narrative that liquidity constraints, rather than foreign exchange headwinds, were the primary driver of the dramatic price action.
Analysis & Drivers
The recent collapse in gold prices was not a simple reaction to monetary policy shifts. While central banks have indeed adopted a hawkish stance, signaling a higher-for-longer interest rate environment, the scale of gold's decline suggests a more acute issue at play: a liquidity squeeze. Such events occur when there isn't enough readily available cash or buyers to absorb selling orders, leading to sharp price drops as sellers are forced to accept lower prices. This was evident as gold broke below the key $5,000 support level, triggering a cascade of forced selling through margin calls.
The simultaneous weakening of the U.S. Dollar, typically a negative for gold, did not mitigate the decline, further pointing away from currency movements as the principal cause. Instead, the narrative centers on the mechanics of the market itself. Large outflows from gold ETFs, such as GLD, indicate that institutional investors were liquidating their holdings, likely to meet margin requirements or reallocate capital under pressure. This forced deleveraging can create a self-reinforcing downward spiral, independent of the asset's intrinsic value.
Trader Implications
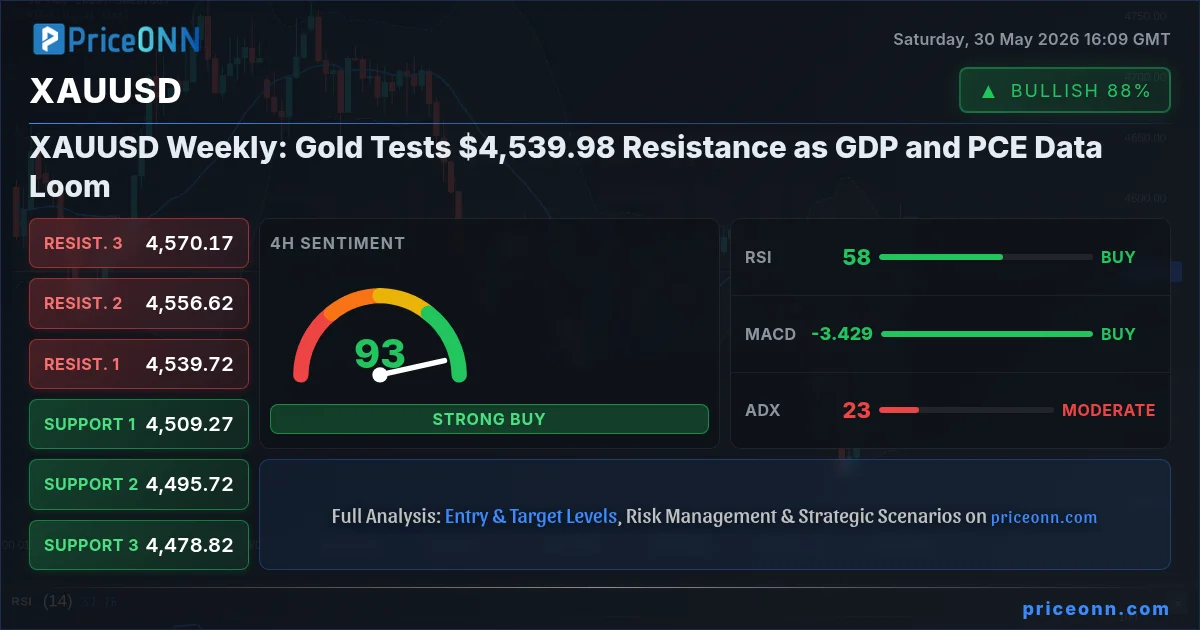
With the most intense phase of forced selling appearing to have abated, gold is beginning to establish support in the vicinity of $4,500. This stabilization suggests that extreme selling pressure may have eased, potentially paving the way for a period of consolidation. Traders should closely monitor this $4,500 level as a crucial support zone. A sustained hold above this price could indicate a bottoming process, while a decisive break below could signal further downside, with a potential target around $4,000, as previously indicated by some market watchers.
Key factors to watch include:
- The resilience of the $4,500 support level.
- Volume and flow data from major gold ETFs for signs of institutional sentiment.
- The U.S. Dollar Index (DXY) – while not the primary driver, its direction can influence risk sentiment.
- Any further commentary from major central banks regarding their monetary policy stance.
Given the recent volatility, risk management is paramount. Traders might consider looking for confirmation of a bottoming pattern before initiating new long positions. Conversely, any signs of renewed selling pressure below $4,500 could present shorting opportunities, targeting lower levels.
Outlook
The immediate outlook for gold hinges on whether the liquidity issues that triggered the sharp decline have truly subsided. If the market can absorb selling pressure without further dramatic price drops, gold may enter a consolidation phase around the current levels. However, the underlying hawkish sentiment from central banks remains a headwind for non-yielding assets like gold. Should the U.S. Dollar find renewed strength or if economic data points to persistent inflation, further pressure on gold is possible. The next significant price action will likely be determined by the market's ability to digest existing positions and the emergence of new fundamental catalysts, with the $4,000 level remaining a key area of interest if current support fails.
Frequently Asked Questions
What is the current support level for gold?
Gold has stabilized around the $4,500 level, which is now acting as a key support zone. A failure to hold this level could lead to further declines.
What caused the recent sharp decline in gold prices?
The primary driver appears to have been a liquidity squeeze, exacerbated by margin calls after gold broke below $5,000. This led to forced selling, overwhelming normal market fundamentals.
What is the potential downside target for gold if support breaks?
If the $4,500 support fails, market data suggests that a potential target for gold could be around the $4,000 mark.
Track markets in real-time
Empower your investment decisions with AI-powered analysis, technical indicators and real-time price data.
Join Our Telegram Channel
Get breaking market news, AI analysis and trading signals delivered instantly to your Telegram.
Join ChannelFinancial markets traded with a mixed tone today as investors tried to balance fresh signs of diplomatic progress in the Middle East against lingering concerns that the region’s energy and security risks are far from resolved. The shift in sentiment was reflected most clearly in currency markets, where Dollar weakened broadly as traders scaled back […] The post Dollar Falls as Peace Hopes Return, But Risks Haven’t Gone Away appeared first on ActionForex.
USDJPY has returned to the area of previous interventions. The ECB is moving towards a rate hike in June. The US dollar retreated on Friday amid new record highs for stock indices and rumours of amendments to the US-Iran agreement. However, tit-for-tat exchanges between the adversaries pushed the dollar index back into the support zone […] The post Yen Braces for a New Storm appeared first on ActionForex.
For a market supposedly obsessed with geopolitics, investors appear remarkably calm. The proposed US-Iran agreement remains unsigned, key details are still unresolved, and military exchanges between the two sides continue. Yet financial markets are behaving as though a lasting settlement is only a matter of time. Oil remains well below recent highs, Treasury yields are […] The post Trump Says “Relax”, Markets Appear To Be Listening Despite Ongoing Iran Tensions appeared first on ActionForex.
USD/CAD is showing signs of potential weakness as Canada's economy struggles with a -0.1% Q1 GDP contraction and the specter of renewed trade uncertainties, while global oil prices react to Middle East truce hopes.
The US Dollar experienced a notable decline last week as markets priced in a potential diplomatic resolution to the US-Iran conflict, leading to a drop in oil prices and Treasury yields. This shift in sentiment suggests a move away from stagflation fears towards a more stable economic outlook.
Canada's labor market is showing signs of stabilization, with analysts predicting a dip in the unemployment rate to 6.8% in May, driven by an expected 25,000 new jobs. This follows a period of sluggish GDP growth and rising joblessness earlier in the year.
The Canadian dollar faces headwinds as domestic demand cools and investment remains sluggish. However, upcoming trade negotiations could offer a much-needed catalyst for a rebound.
Markets are pricing in a potential de-escalation in the US-Iran conflict, leading to a significant drop in crude oil prices and a weakening US Dollar as diplomatic efforts appear to be gaining traction.
Canada's economy showed signs of a slowdown in early 2026, but upcoming May jobs data is expected to reveal a modest uplift. Analysts anticipate the unemployment rate to fall to 6.8%.
The dominant story across financial markets last week was not artificial intelligence, central banks, or economic data. It was a dramatic shift in expectations regarding the future of the US-Iran conflict. Investors increasingly embraced the view that the three-month war is moving toward a diplomatic resolution after reports emerged that negotiators had drafted a 60-day […] The post US-Iran Endgame in Sight? Markets Vote for Peace as Oil, Yields and Dollar Fall appeared first on ActionForex.
USD/CAD faces pressure as Canada's economy shows signs of stalling, with Q1 GDP contracting 0.1% and domestic demand weakening. This comes as trade negotiations and geopolitical shifts add layers of uncertainty.
Canada's economy showed signs of life in early 2026, with analysts expecting a moderate job growth of around 25,000 positions and a potential dip in the unemployment rate to 6.8% for May.