Gold stabilizes at 4,500 as liquidation exhausts, 4,000 remains target
Liquidity Crunch Triggers Gold Collapse
The yellow metal has found a tentative pause near the 4,500 level after experiencing a brutal, disorderly decline yesterday. This sharp downturn appears to have been a consequence of a significant liquidity crunch, a scenario where market plumbing issues, rather than pure economic fundamentals, dictate price movements. Central bank pronouncements this week from the Federal Reserve, the European Central Bank, the Bank of England, and even the Bank of Japan, certainly set a hawkish tone, initially pressuring gold. However, the sheer velocity and scale of the subsequent drop suggest a market dislocation was at play.
A critical tipping point was breached when gold's price action decisively fell below the psychologically significant 5,000 mark. This break unleashed a torrent of margin calls across highly leveraged positions. As forced selling snowballed, prices plummeted, triggering further liquidation rounds in a classic, damaging cascade. This pattern is often a hallmark of liquidity stress, where the mechanics of trading overwhelm underlying value considerations.
Adding fuel to the fire, substantial outflows from major gold-backed exchange traded funds were recorded. Significant redemptions from prominent funds, such as GLD, underscore the aggressive unwinding of institutional positions. Intriguingly, this sharp selloff coincided with a softening U.S. Dollar, which further reinforces the narrative that liquidity constraints, not foreign exchange headwinds, were the primary driver of the dramatic price action.
Technical Levels and Future Trajectory
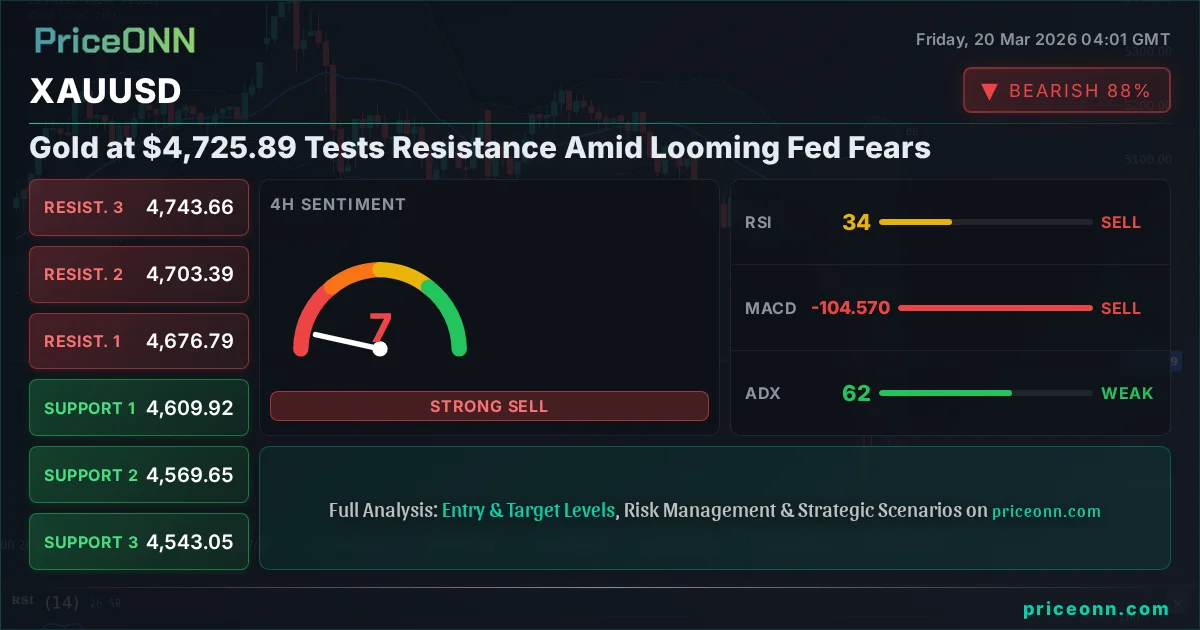
With the most intense phase of forced selling likely behind us, gold is beginning to establish support in the vicinity of 4,500. This stabilization suggests that the extreme selling pressure may have abated, potentially paving the way for a period of consolidation as market participants re-evaluate the broader economic landscape. From a technical perspective, the recent dip to 4502.43 has fulfilled a significant downside projection. Specifically, it met the 161.8% Fibonacci extension of the move from 5149.02 to 4996.03, projected from 5238.55, which landed at 4554.15. This technical confluence lends credence to the idea of a temporary floor being established.
However, any upward retracements are likely to encounter stiff resistance. The declining 55-period Exponential Moving Average on the 4-hour chart, currently situated around 4970.12 and trending lower, represents a key overhead barrier. This technical resistance will likely cap any immediate rallies.
Looking at the broader chart patterns, gold remains entrenched within a corrective phase that originated from the peak established at 5,598.38. The current decline, originating from 5419.02, appears to be the third wave of this larger correction. The existing structure strongly implies that further downward movement is probable, with the 4,000 psychological level emerging as a significant magnet. This target zone aligns with key technical indicators, including the 38.2% Fibonacci retracement of the entire move from 1614.60 to 5998.38, which falls at 4076.57. Furthermore, the 55-week Exponential Moving Average, currently hovering around 3995.30, also points to this critical area. This region is anticipated to attract considerable buying interest and could potentially form a more enduring base for gold once this corrective pattern reaches its conclusion.
Market Ripple Effects
The violent price swings in gold, driven by liquidity stress rather than fundamental value, send ripples across related markets. The immediate aftermath of such a sharp liquidation event can create a vacuum, leading to unpredictable price action in other risk assets and currencies. The U.S. Dollar's muted reaction during the gold selloff is particularly noteworthy, suggesting that currency markets were not fully participating in the gold rout, further highlighting the technical and liquidity-driven nature of the move. This disconnect could imply that the Dollar's trajectory might diverge from gold's immediate recovery path.
Traders will be closely watching the U.S. Dollar Index (DXY) for signs of renewed strength or weakness, as its movement often correlates inversely with gold. Additionally, the performance of equity markets, particularly technology stocks sensitive to liquidity conditions, will be a key indicator of overall risk appetite. The price action in Treasury yields could also provide clues; if yields continue to rise on hawkish central bank expectations, it would typically pressure gold, but the liquidity squeeze narrative might temporarily decouple these relationships. Finally, the commodity complex as a whole might see increased volatility as traders reassess risk premised on liquidity availability.
Track markets in real-time
Empower your investment decisions with AI-powered analysis, technical indicators and real-time price data.
Join Our Telegram Channel
Get breaking market news, AI analysis and trading signals delivered instantly to your Telegram.
Join Channel