Let me say the quiet part out loud: a daily RSI reading of 15.5 on Bitcoin is not normal. It is the kind of number that shows up a handful of times per cycle, and every time it does, the same argument breaks out between the people screaming capitulation and the people warning about a falling knife. Right now BTCUSD is sitting at $60,933, down a brutal 6.27% on the day, and that exact argument is playing out in real time.
So here is my stance, plainly: this is a forced, momentum-driven flush, not a slow bleed. The structure of the move - the speed, the oversold extremes across every timeframe, the correlated tech wreck next door - tells you this is liquidation mechanics doing the heavy lifting. That does not make it a buy. It makes it a level to respect and a setup to stalk. BTCUSD today analysis has to start with one honest admission: the trend is down, the momentum is violent, and yet the rubber band is stretched about as far as it gets.
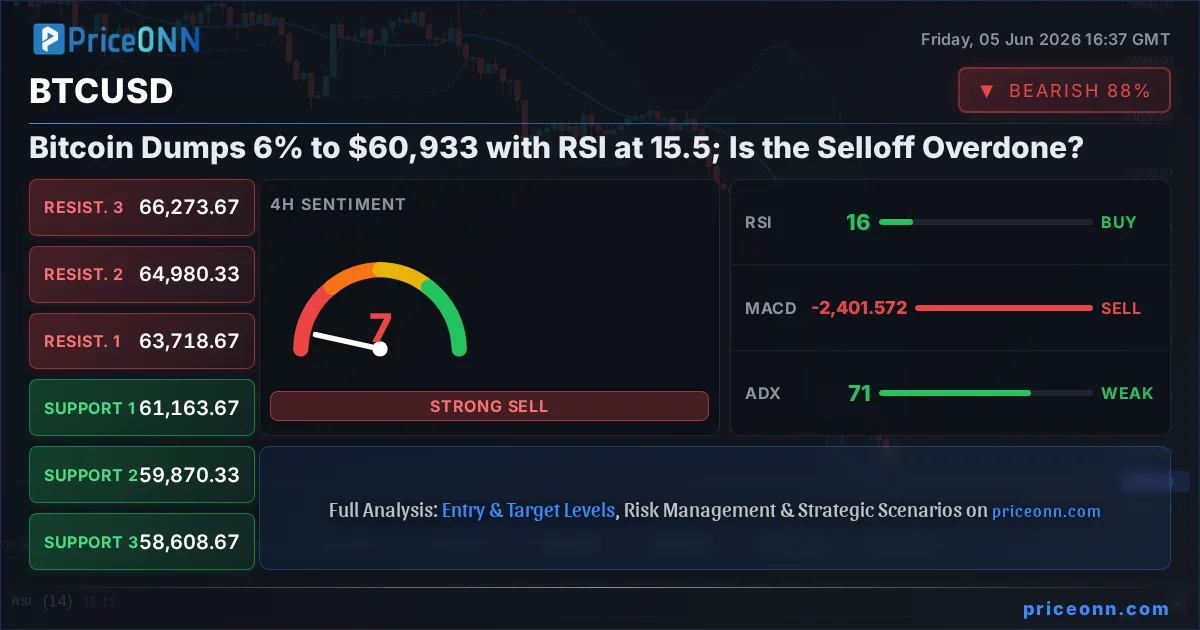
- BTCUSD trades at $60,933, down 6.27% (-$4,077) on the session, after sweeping a daily range of $61,388 to $65,863.
- Daily RSI sits at 15.52 and the 4-hour RSI at 15.98 - deep oversold territory that historically marks short-term exhaustion, not a fresh entry signal.
- The 4-hour ADX at 71.21 confirms an extraordinarily strong downtrend; this is one of the most committed bearish readings you will see on any timeframe.
- DXY strength at 99.80 (+0.56%) plus a 3.15% Nasdaq 100 drop point to a broad risk-off macro driver, not a crypto-specific catalyst.
Time Horizon: This commentary frames the intraday-to-swing picture for BTCUSD, with key levels relevant over the next several sessions.
Why $60,933 Is the Number That Actually Matters Right Now
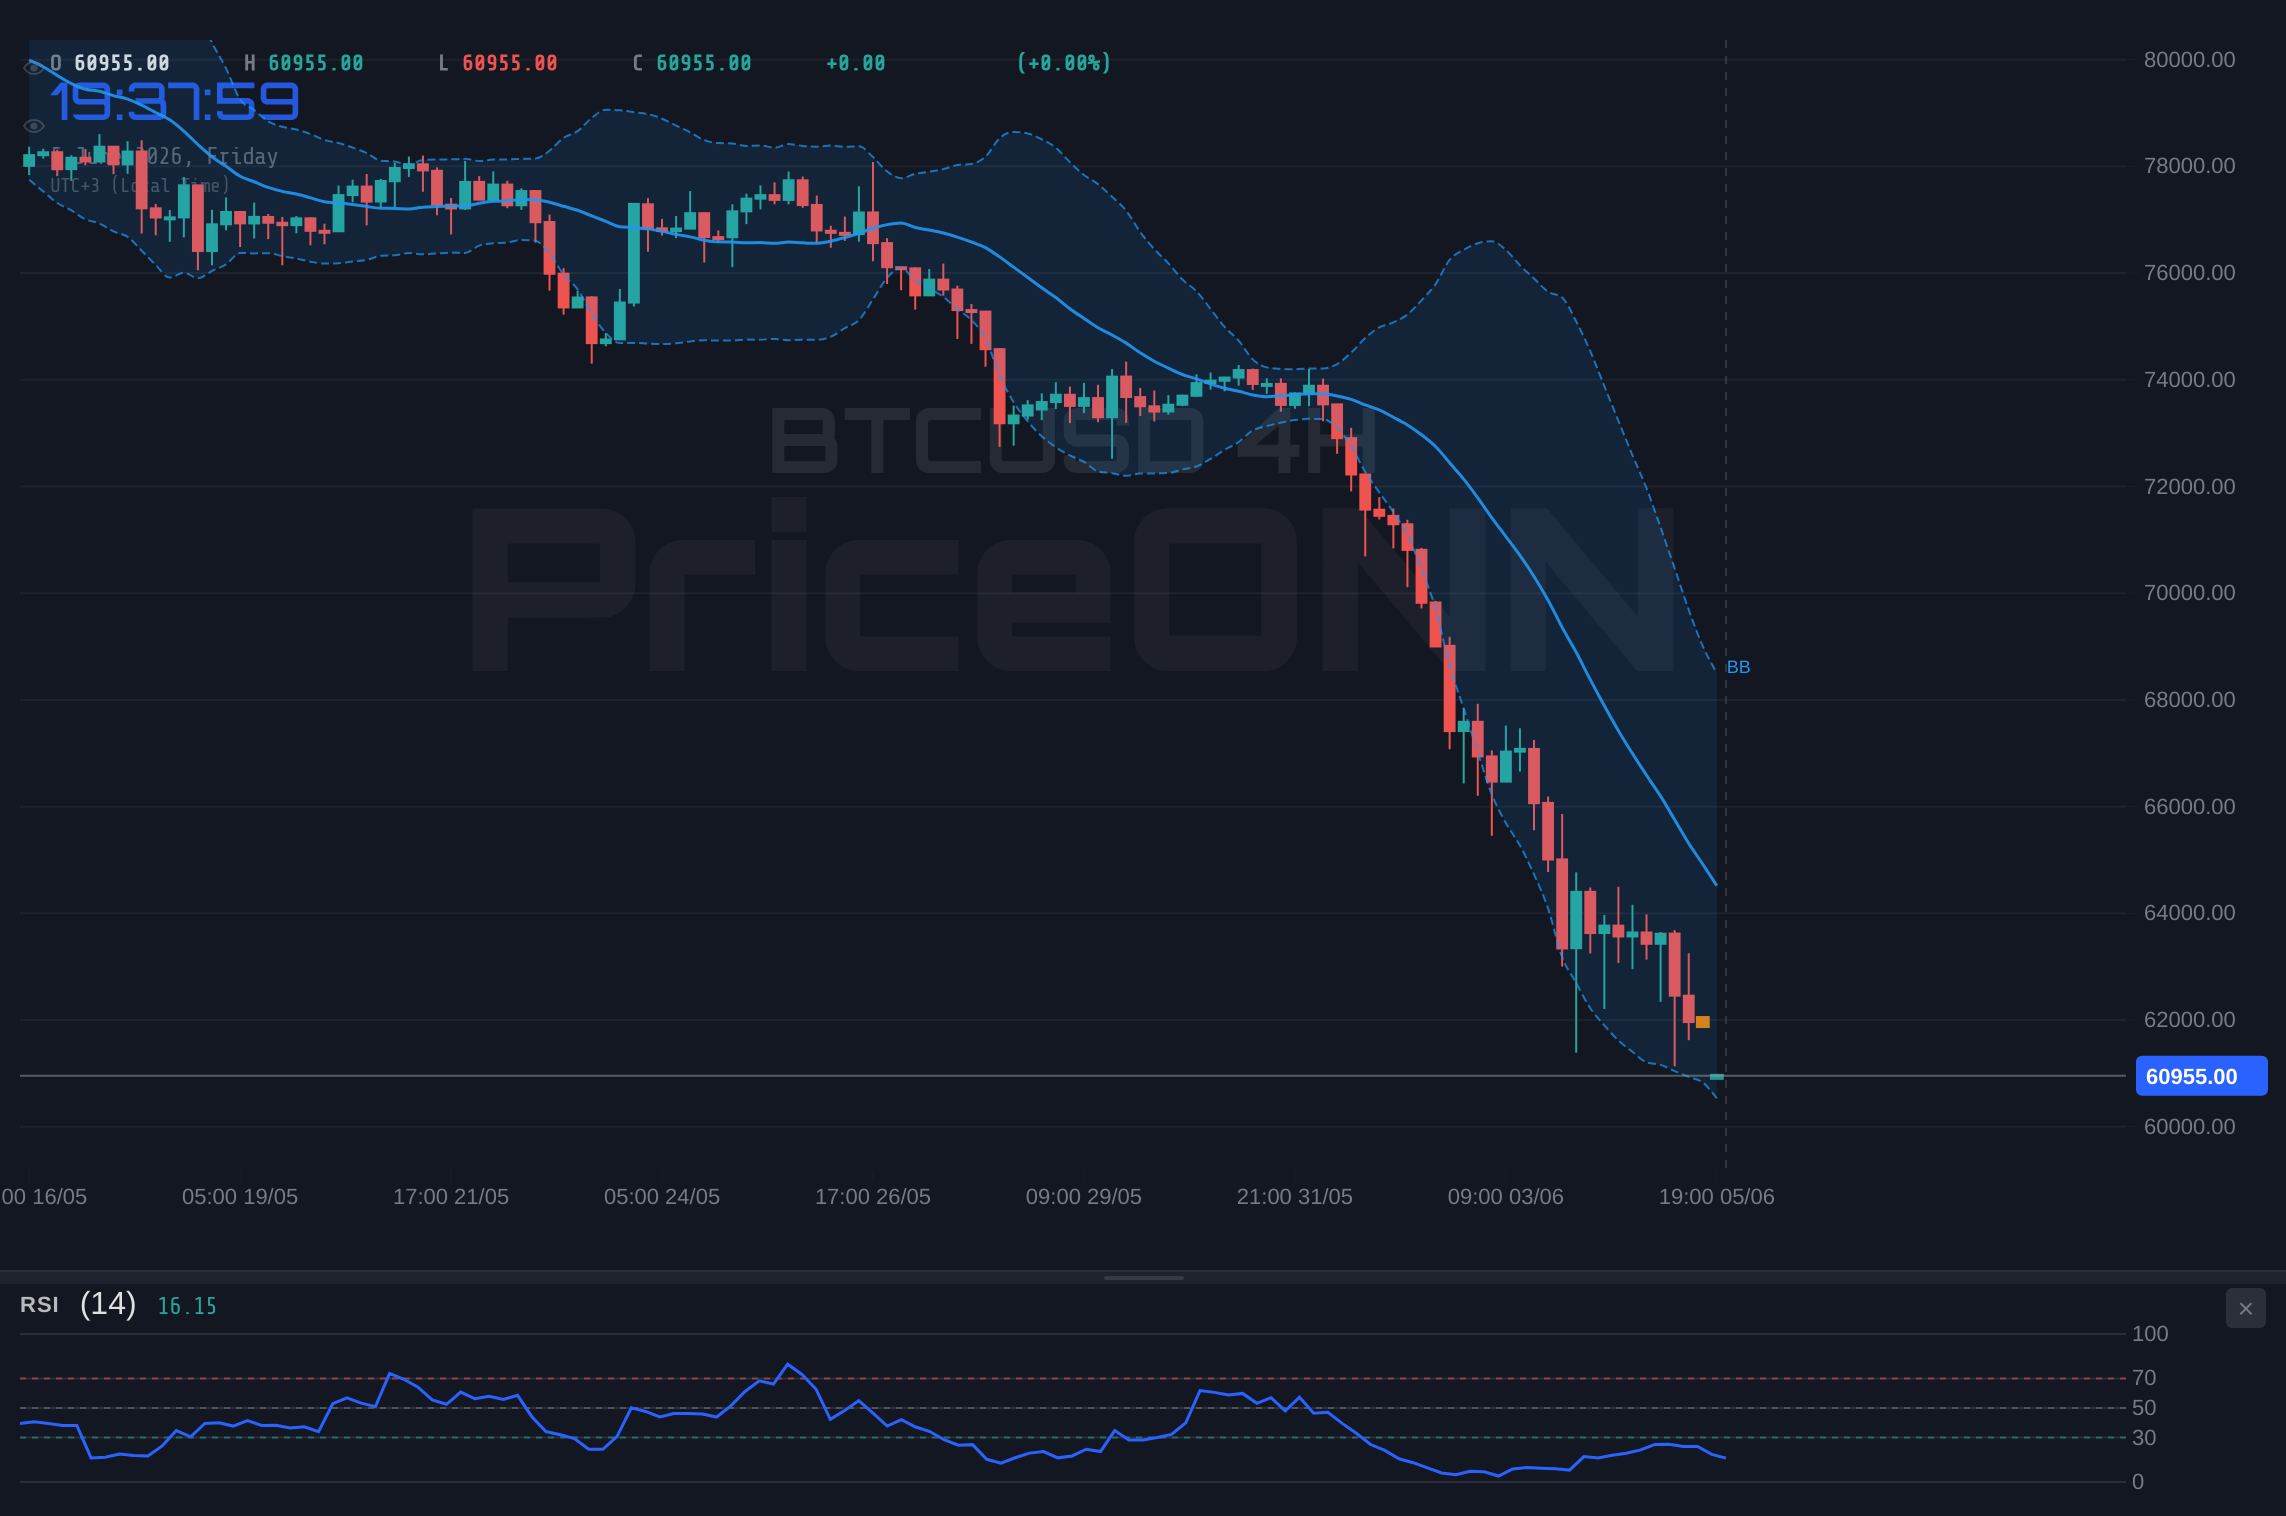
Look, this level is critical, and not for sentimental reasons. The daily candle swept all the way down from $65,863 and is now pinned near the lows around $61,388. Price closing and holding around $60,933 keeps Bitcoin perched right on the edge of the 1-hour support shelf at $60,397, with $59,922 and $59,509 stacked beneath it. Lose $60,397 with conviction and the next liquidity pocket opens fast - that is where the falling-knife crowd gets proven right.
On the upside, the immediate ceiling is tight and obvious. The 1-hour resistance cluster runs $61,285, then $61,698, then $62,173. Notice how close $61,285 is to spot. That tells you the very first hurdle bulls face is barely above current price, and reclaiming it is the minimum bar for any relief bounce to even begin. A daily close back above $62,173 would be the first real evidence that the liquidation cascade has exhausted its sellers. Until that happens, every bounce is suspect.
This is exactly where you need to pay attention. Oversold does not mean reversal. It means the move is mature. Those are different things, and conflating them is how traders catch knives.
What BTCUSD RSI at 15.5 Is Really Telling Us
Here is where the indicators get interesting, because they are screaming in unison. The daily RSI at 15.52 is one of the lowest prints of the entire cycle. The 4-hour RSI at 15.98 mirrors it, and even the 1-hour RSI at 35.08 has bounced off its own oversold extreme. When momentum oscillators get this depressed across multiple timeframes, history on BTCUSD suggests the immediate downside energy is largely spent in the very short term. The seller has done most of the damage. What is left is the aftershock.
But - and this is the part the permabulls skip - the trend strength tells the opposite story. The 4-hour ADX at a staggering 71.21 signals one of the strongest, most one-directional downtrends you can measure. The daily ADX at 35.29 confirms a powerful bearish trend, not a fading one. So you have a genuine conflict: oversold momentum versus dominant trend strength. That conflict is the whole story. RSI says "exhausted," ADX says "do not fight me yet." The resolution comes from price, specifically from whether bulls can reclaim that $62,173 line.
MACD offers no relief either. On every timeframe the histogram is negative and price sits below the signal line, so there is no momentum divergence yet that would hint at a turn. The daily Stochastic at K=3.89, D=14.86 is buried at the bottom, which again screams oversold but does not, on its own, generate a long. For that you want to see %K cross back above %D and lift off the floor. Right now it is still pinned.
An RSI of 15.5 is a yellow flag for shorts, not a green light for longs. In strong downtrends, oversold readings can persist for days while price grinds lower. The 4-hour ADX at 71.21 is your reminder that this trend has real conviction behind it.
The Macro Backdrop: This Was a Risk-Off Day, Not a Bitcoin Problem
Bitcoin did not break in a vacuum. Zoom out and the fingerprints are all over the macro tape. The Nasdaq 100 got hammered 3.15% to 29,479, with its own 1-hour RSI down at 22.67 in oversold territory. When high-beta tech bleeds like that, Bitcoin almost always bleeds with it - the correlation tightens precisely on the days everyone wishes it would decouple. Today was one of those days.
At the same time the dollar flexed. The Dollar Index pushed to 99.80, up 0.56%, with a 1-hour RSI of 80.71 deep in overbought. According to Reuters, the dollar strengthened broadly in the early US session after a much stronger-than-expected US employment report reinforced confidence that the Fed can stay patient. That "Fed patience" narrative is poison for risk assets. A firmer dollar and a higher-for-longer rate path drains liquidity from exactly the speculative corners of the market where Bitcoin lives. With DXY this strong, BTCUSD is fighting an uphill macro current.
The economic calendar keeps the pressure on. The market is staring down a week framed by US inflation data and, as one forex note put it this week, a Fed countdown that is now firmly underway with Chair Warsh's first meeting approaching. Several high-impact US releases sit on the docket, including consumer sentiment readings forecast near 70.7 prior and ISM-style services prints around 53.6. None of these are crypto-specific, but all of them feed the dollar and rate-expectations machine that just pushed Bitcoin off a cliff. The takeaway: the catalyst for BTCUSD's next real move may come from a US data print, not from anything on-chain.
The Altcoin Carnage Confirms the Liquidation Read
If you want proof this was a leverage flush rather than orderly distribution, look at Ethereum. ETHUSD collapsed 10.41% to $1,594, with a 4-hour RSI of 12.59 and a daily RSI of 14.77 - even more stretched than Bitcoin. That kind of altcoin underperformance, where ETH drops nearly double Bitcoin's percentage, is the classic signature of forced deleveraging across the crypto complex. When the whole board lights up red and the higher-beta assets get hit hardest, you are watching margin calls, not measured selling.
This also nudges Bitcoin dominance higher almost by default, since BTC's 6.27% drop is gentler than the broader altcoin bloodbath. In a risk-off liquidation, capital that stays in crypto tends to huddle into Bitcoin as the relative safe harbor of the asset class. That is a subtle tell: the rotation out of altcoins into BTC during a sweep often precedes the moment selling pressure finds a floor. It does not time the bottom, but it frames the behavior.
For the on-chain watchers, this is the environment where you want to track exchange inflows and whale movements closely. Aggressive coins flowing onto exchanges during a flush signal more selling to come, while a sudden drop in inflows after a capitulation candle often marks seller exhaustion. The $60,933 zone is where that battle is being fought right now.
What Different Traders Should Actually Do Here
This is a watch zone, not a trade-now setup, and the right move depends entirely on your timeframe.
For the Scalper
The 1-hour chart is your battlefield. The $60,397 support and the $61,285 resistance form a tight cage. A reclaim of $61,285 with a volume surge is the first sign a relief bounce has legs toward $61,698 and $62,173. Lose $60,397 and the short-term bias flips back down toward $59,922. Trade the edges, not the middle, and respect how violent the tape is.
For the Swing Trader
Patience is the entire edge here. The daily downtrend is intact and the ADX confirms it, so chasing a falling knife into 15.5 RSI is not a plan, it is a hope. A daily close back above $62,173 would be the first piece of evidence worth acting on, and a reclaim of the $63,718 zone on the 4-hour would suggest the cascade has truly broken. Until then, the structure favors lower prices, and the smart play is to let the chart prove the bottom rather than guess it.
For the Long-Term Holder
Deep oversold flushes like this are historically where the strongest hands accumulate, but even then, scaling beats lump-summing into momentum this aggressive. The thesis fails if BTCUSD closes decisively below $59,509 and accelerates; that would open a deeper retracement and demand more patience. Let the dust settle.
The cleanest tell to watch is confluence: an RSI lifting off 15, a daily Stochastic %K crossing back above %D, and a reclaim of $62,173 all happening together. One signal is noise. All three is a setup.
BTCUSD Key Levels to Watch
Three Ways This Resolves
Knife Keeps Falling: Support Gives Way
55% ProbabilityOversold Chop: Range Builds a Base
30% ProbabilityRelief Bounce: Bulls Reclaim the Shelf
15% ProbabilityFrequently Asked Questions: BTCUSD Analysis
Is RSI at 15.5 a buy signal for BTCUSD right now?
Not by itself. A daily RSI of 15.52 confirms Bitcoin is deeply oversold, but with the 4-hour ADX at 71.21 signaling an exceptionally strong downtrend, oversold can persist for days. Wait for confirmation, such as a reclaim of $62,173, before treating it as a long.
What happens if BTCUSD breaks below $60,397 support?
A decisive break below the $60,397 1-hour support opens the path toward $59,922 and then $59,509. Given the momentum and the negative MACD across timeframes, losing that shelf would likely accelerate the liquidation rather than slow it.
Why did Bitcoin drop 6% to $60,933 today?
The selloff was macro-driven. The Nasdaq 100 fell 3.15% and the Dollar Index surged to 99.80 after a stronger-than-expected US jobs report reinforced Fed patience, per Reuters. Risk-off flows plus a firm dollar hit Bitcoin and the broader crypto complex, with Ethereum down 10.41%.
How will upcoming US inflation data affect BTCUSD this week?
With a Fed countdown underway and key US inflation and sentiment data due, the dollar and rate expectations will likely drive Bitcoin's next move. Hotter data would strengthen DXY further and pressure BTCUSD, while softer prints could ease the dollar and let the oversold bounce develop above $62,173.
The honest read is this: Bitcoin is stretched, the trend is angry, and the next clean signal lives at $62,173 on the way up and $60,397 on the way down. Volatility this extreme always creates opportunity for those who wait for confirmation instead of guessing the turn. Manage your risk, stalk the reclaim, and let the chart prove the bottom; the market always offers a second entry to the patient.
Track markets in real-time
AI-powered analysis, technical indicators and real-time price data.
Join Our Telegram Channel
Breaking market news, AI analysis and trading signals instantly.
Join Channel