Is Brent Crude poised for another leg higher, or is the $113.15 mark the start of a significant pullback? The market is at a critical juncture, with bulls and bears fiercely contesting the current price territory. With Brent trading at $113.15, it’s hovering just below a significant resistance level that, if breached, could signal a renewed upward push. However, the prevailing risk sentiment and a complex web of global economic factors suggest that the path forward is far from straightforward. The recent surge in oil prices, driven by a confluence of geopolitical tensions and persistent demand, has brought Brent back into focus. But as it approaches higher levels, the question on every trader's mind is whether the momentum is sustainable or if a correction is imminent. This analysis delves into the bull and bear arguments, supported by current market data and broader economic context, to illuminate the potential path for Brent Crude.
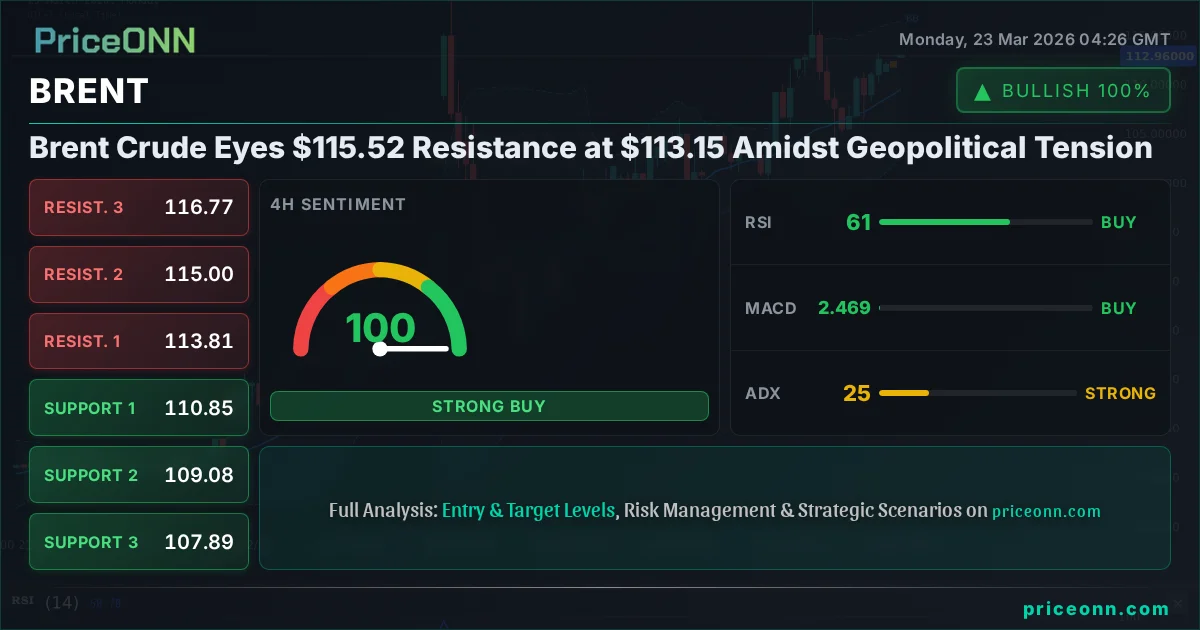
- Brent Crude is currently trading at $113.15, approaching the critical resistance level of $115.52.
- The ADX at 25.31 indicates a strong upward trend on the 4-hour chart, suggesting underlying strength.
- RSI at 61.34 on the 4H chart signals bullish momentum, but the 1D RSI at 82.72 is deep in overbought territory, warning of potential pullbacks.
- Geopolitical tensions in the Middle East are a significant driver, supporting higher oil prices and influencing safe-haven flows.
The Bull Case: Riding the Geopolitical Wave
The arguments for a continued ascent in Brent Crude are compelling, primarily fueled by escalating geopolitical tensions and robust demand dynamics. The current price of $113.15, while testing near-term resistance, sits within a broader uptrend that has seen significant gains. On the 4-hour chart, the ADX stands at a strong 25.31, indicating a healthy trend is in place, which typically supports further price appreciation. Furthermore, the RSI(14) at 61.34 on the same timeframe suggests that bullish momentum is still present, albeit not yet in extreme territory. This aligns with the WTI crude oil briefly breaking above $100, as reported by recent news, indicating a general upward pressure across energy markets. The narrative supporting higher prices is amplified by supply-side concerns. Ongoing geopolitical instability, particularly in the Middle East, creates inherent risks to crude oil supply routes and production. Any disruption, or even the perceived threat of one, can immediately translate into higher prices as traders price in potential shortages. This risk premium is a significant factor currently supporting Brent. Moreover, the global energy transition, while ongoing, has not yet significantly curtailed demand for fossil fuels, especially in key industrial economies. As economies continue to recover or expand, energy consumption naturally rises, providing a fundamental floor for oil prices.
The 1-hour chart also offers some support for the bullish outlook, with a strong trend indicated by an ADX of 19.38 and positive momentum signaled by the MACD. The Stochastic oscillator on the 1H chart at 90.29, although in overbought territory, suggests strong buying pressure is present. This confluence of factors paints a picture of an asset with underlying strength, driven by both immediate geopolitical catalysts and sustained demand. The fact that Brent is trading above its 1-hour middle Bollinger band further reinforces the short-term bullish sentiment. While the daily RSI at 82.72 is a clear warning sign of an overextended market, short-term strength can sometimes persist longer than expected, especially when geopolitical events are the primary catalyst. The resilience shown by oil prices, even as broader risk assets like SP500 and Nasdaq experience pullbacks, highlights oil's unique position as both a commodity and a geopolitical barometer. Investors are closely watching how these tensions unfold, and any escalation is likely to be met with further bids in Brent.
The Bear Case: Overbought Signals and Macro Headwinds
Despite the bullish narrative, a strong counter-argument emerges when examining the longer-term technicals and broader macroeconomic pressures. The most glaring red flag is the daily RSI(14) reading of 82.72. This is deep into overbought territory, historically signaling that the asset is due for a correction or a period of consolidation. While the 4-hour chart shows a healthy RSI of 61.34, the weekly and daily charts are screaming caution. The ADX on the daily timeframe is at a very strong 66.86, indicating a powerful uptrend, but such strong trends can be prone to sharp reversals once momentum falters. The Stochastic oscillator on the daily chart, at 77.43 for K and 65.57 for D, also suggests an overextended market, even though it's still trending upwards. This divergence between the short-term bullish signals and the longer-term overbought conditions creates a significant risk for traders chasing the rally. Furthermore, the strengthening US Dollar Index (DXY), currently at 99.45 and showing a strong upward trend on the daily chart, typically exerts downward pressure on dollar-denominated commodities like Brent. A higher DXY makes oil more expensive for holders of other currencies, potentially dampening demand. The recent news highlighting that "Gold prices have fallen to near $4,460 per ounce amid a strengthening US Dollar, rising bond yields, and persistent inflation fears" indirectly supports this bearish outlook for commodities correlated with the dollar.
Broader market sentiment also plays a crucial role. While geopolitical tensions can support oil prices, a significant downturn in global risk appetite, as seen with the SP500's fall of -0.86% and Nasdaq's -0.94%, can spill over into commodities. If major equity indices continue to slide, it suggests a potential slowdown in global economic activity, which would naturally reduce oil demand. The news about "Quantum Battery Breakthrough" and "Solar Surge" also points towards long-term energy transition trends that could eventually reduce reliance on fossil fuels, although their immediate impact is minimal. However, from a risk management perspective, the extremely overbought daily indicators cannot be ignored. The potential for a sharp profit-taking sell-off or a technical reversal is elevated. Traders who are already long might consider taking profits, and new entries at these levels carry a higher risk of being caught on the wrong side of a reversal, especially if global risk sentiment deteriorates further or if the DXY continues its upward trajectory.
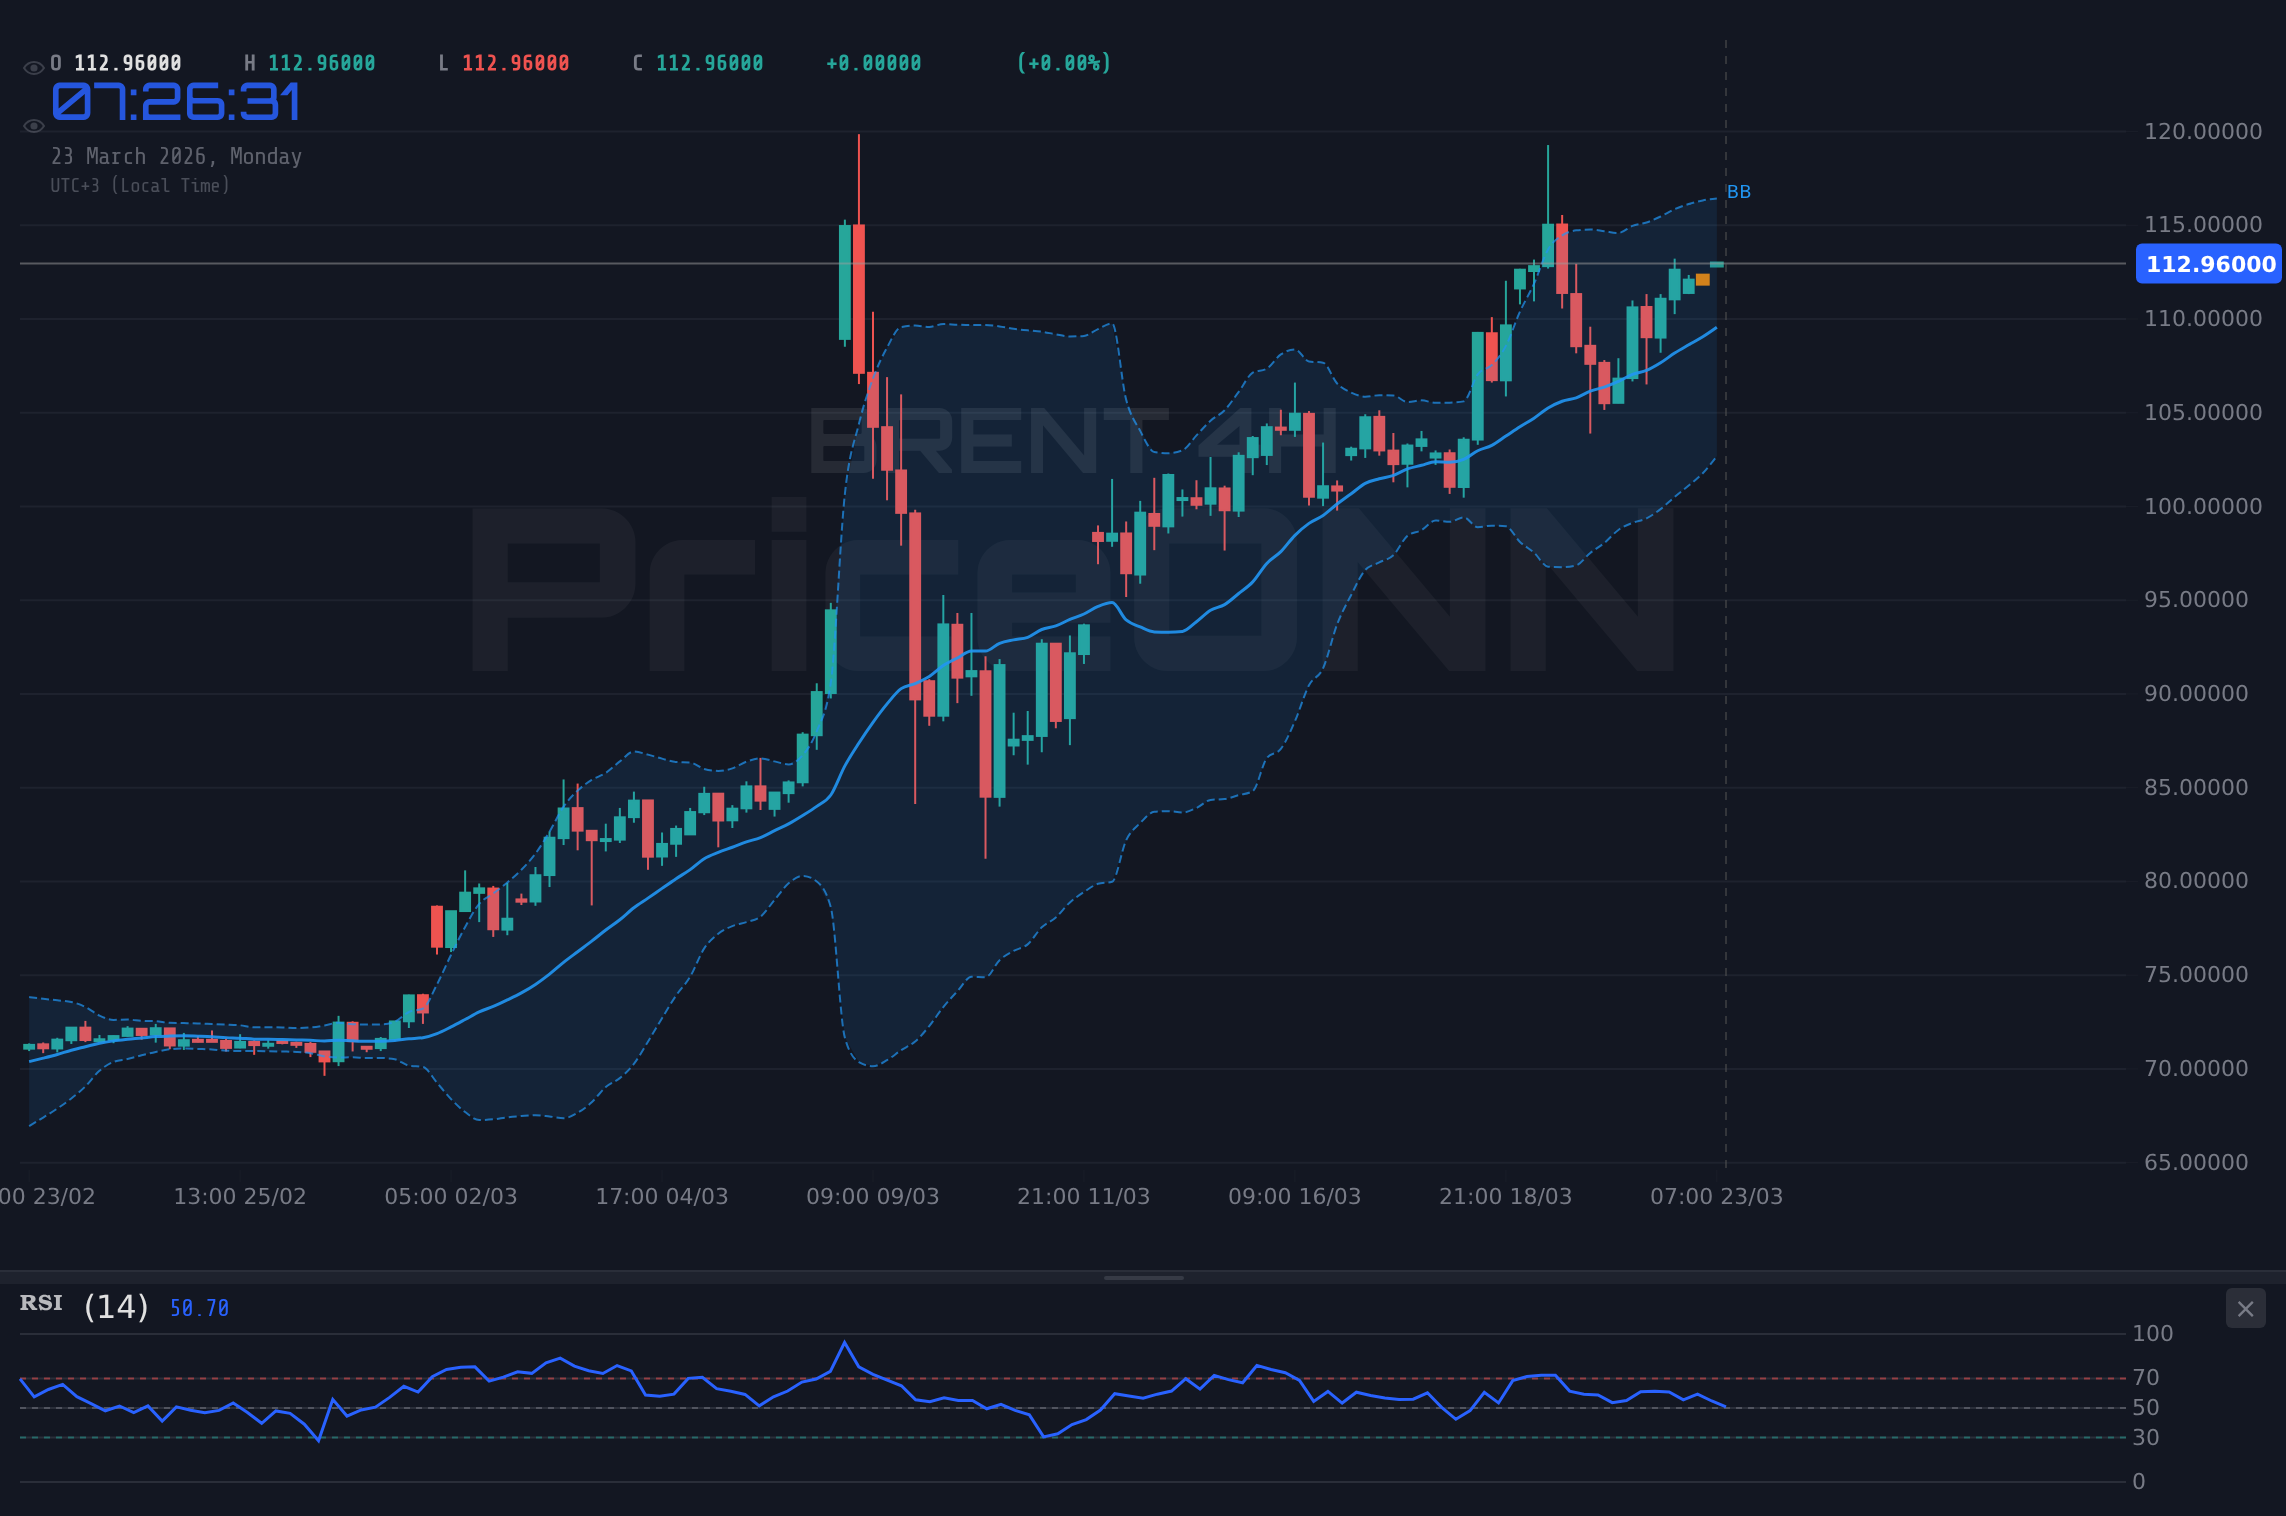
The Technical Battleground: $113.15 and Beyond
The current price of $113.15 for Brent Crude sits at a fascinating technical crossroads. On the 1-hour chart, the price is above the middle Bollinger Band, and the MACD is showing positive momentum with the histogram above the signal line. The ADX at 19.38 suggests a weak trend, but the Stochastic oscillator's position in overbought territory (K=90.29) hints at immediate buying pressure, though it also signals a potential for a short-term reversal. Resistance on this timeframe is seen at $113.35, $113.84, and $114.70. A break above $113.35 could encourage further short-term gains.
However, shifting to the 4-hour timeframe, the picture becomes more complex. The ADX at 25.31 indicates a stronger trend, supporting the upward move. The RSI at 61.34 is in bullish territory but not yet extreme. The Stochastic K=73.64 and D=40.33 shows a bullish signal with %K > %D, and it's moving up from neutral levels. The key resistance on this timeframe is cluster around $113.81, $115.00, and $116.77. A decisive close above $113.81 would be the first sign of strength breaking through immediate selling pressure.
The daily chart presents the most significant challenge to the bullish narrative. The RSI at 82.72 is a glaring indicator of an overextended market, suggesting that the current rally is mature and susceptible to a reversal. The ADX at 66.86 confirms a very strong uptrend, but extreme ADX values can sometimes precede sharp corrections. The Stochastic K=77.43, D=65.57 reinforces the overbought condition. The key resistance levels on the daily chart are $115.52, $118.40, and $123.59. While $115.52 remains a significant psychological and technical barrier, the daily overbought RSI makes a sustained push above it challenging without a significant pullback first. The conflict between the short-term bullish signals and the long-term overbought conditions creates a high-stakes environment. A break above $115.52 would require significant conviction and likely a shift in broader market sentiment or further escalation of geopolitical risks to overcome the prevailing overbought conditions.
Market Context and Correlations
Understanding Brent's price action requires looking beyond the oil market itself. The US Dollar Index (DXY) is currently at 99.45, with a daily trend strength of 92% and an ADX of 34.7. This signifies a strong upward trend in the dollar. Historically, a strong dollar tends to put pressure on commodities priced in dollars, including Brent Crude. The fact that Brent is still showing resilience despite a rising DXY suggests that the geopolitical risk premium is currently outweighing the negative impact of a stronger dollar, or that the dollar's strength is being driven by safe-haven flows rather than purely economic fundamentals, which can sometimes correlate with commodity strength during crises. The SP500, trading at 6479.1 with a daily trend strength of 100% in a downward direction, and Nasdaq at 23766.76 also falling sharply, indicates a significant risk-off sentiment in the broader market. Typically, a decline in equities would dampen demand expectations for oil, leading to lower prices. However, in this scenario, the geopolitical factor appears to be overriding the risk-off sentiment for oil specifically. This decoupling is notable and suggests that energy security concerns are paramount for market participants right now. The news about "Why are oil prices stuck above $98 Amidst Geopolitical Tensions and Energy Transitions?" highlights this complex interplay, where tensions keep prices elevated despite potential demand slowdowns.
Looking at other commodities, Gold is trading at $4368.62, down -2.86% for the day, with a very strong daily downtrend indicated by ADX 64.39. This is somewhat unusual given the risk-off environment, where gold typically acts as a safe haven. The news snippet stating "Gold Dips Below $4,460 as Inflation Fears Spark Rate Hike Speculation" provides a clue: rising bond yields and rate hike speculation are weighing on gold, potentially pulling some investment away from it and into dollar-denominated assets or even riskier commodities if the geopolitical situation is dire enough. Silver is also experiencing a sharp decline, trading at $65.71, down -3.14%, with strong downtrends across timeframes. The fact that both precious metals are under pressure while Brent is holding strong further emphasizes the unique drivers in the energy market currently, primarily geopolitical risk and supply fears.
Navigating the Trade: Scenarios and Strategy
Bearish Reversal Scenario
25% ProbabilityConsolidation Scenario
30% ProbabilityBullish Continuation Scenario
45% ProbabilityGiven the mixed signals - strong short-term momentum against long-term overbought conditions, coupled with significant geopolitical drivers - a cautious approach is warranted. The Decision: FULL_TRADE_PLAN with a score of 4/8 reflects this ambiguity. The ADX at 25.31 on the 4H chart suggests a trend is in place, and the RSI at 61.34 supports bullish momentum, but the daily RSI at 82.72 is a major concern. The most probable scenario (45%) is a bullish continuation, contingent on breaking the immediate resistance at $113.84, with a primary target at $114.70 and a more significant psychological level at $115.52. This scenario is invalidated if price closes below the $112.00 support level. A consolidation scenario (30% probability) is also plausible, with price trading in a range between $112.00 and $113.84, particularly if broader market sentiment remains uncertain or if geopolitical news provides no further clear direction. A bearish reversal (25% probability) becomes more likely if price fails to hold above $112.00 and breaks decisively below this level, targeting $111.14 and then $110.85. The key is to manage risk diligently. For aggressive traders, a break above $113.84 could offer an entry, with a stop-loss placed below $112.00. More conservative traders might wait for a confirmed break above $115.52 or a pullback to key support levels like $111.14 before considering positions. The overriding factor remains geopolitical developments; any major news could rapidly shift the probabilities.
The daily RSI reading of 82.72 indicates significant overbought conditions, increasing the risk of a sharp pullback or reversal despite current bullish momentum. Geopolitical events can cause extreme volatility, making stop-loss orders crucial for risk management.
The Bigger Picture: Energy Transitions and Market Sentiment
While immediate price action is dominated by geopolitical tensions, the long-term outlook for Brent Crude is increasingly shaped by the global energy transition. News regarding solar power surges and quantum battery breakthroughs, while not immediately impacting oil demand, signals a fundamental shift occurring in the energy landscape. This transition introduces a structural headwind for fossil fuels over the coming decades. However, in the medium term, the market remains heavily reliant on traditional energy sources. The current geopolitical climate, particularly concerning the Middle East, ensures that supply disruptions remain a potent factor. As highlighted in recent energy discussions, "Crude oil benchmarks remain elevated, trading near $100 per barrel for WTI and over $110 for Brent, as geopolitical unease persists." This suggests that for the foreseeable future, geopolitical risk premiums will continue to play a significant role in price discovery, potentially overshadowing the long-term transition trends. The market's reaction to Brent nearing $115.52 resistance will be a key test. A failure to decisively break through this level, coupled with a downturn in global risk sentiment (as indicated by falling equities), could signal that the market is beginning to price in slower demand growth or increased supply stability, despite ongoing tensions. Conversely, a strong breakout above $115.52, especially if accompanied by further geopolitical escalation or supply-side shocks, could signal a sustained move higher, potentially targeting levels not seen in years, though this would be heavily dependent on the daily overbought conditions being resolved through a sharp, albeit potentially brief, correction.
The interplay between supply-driven price increases (geopolitics) and demand-driven pressures (economic slowdown, energy transition) creates a complex environment. For traders, this means constant vigilance is required. The current setup, with Brent at $113.15 approaching $115.52 resistance, represents a critical inflection point. The bullish case relies on geopolitical factors continuing to dominate, potentially pushing prices higher despite overbought technicals and a strong dollar. The bearish case hinges on these overbought conditions and macroeconomic headwinds, particularly a risk-off sentiment and a stronger dollar, eventually taking precedence. The ultimate direction will likely depend on which narrative gains more traction in the coming days and weeks, and whether any specific supply disruptions materialize.
Monitor the DXY's movement closely. A sustained push above 99.50 could add significant pressure on Brent, even with geopolitical tailwinds. Conversely, a DXY pullback below 99.00 could provide additional room for Brent to test higher resistance levels.
Conclusion: A Waiting Game at the Threshold
Brent Crude at $113.15 stands at a pivotal moment, caught between the powerful influence of geopolitical tensions driving prices higher and the looming threat of overbought technicals and macroeconomic headwinds pushing back. The immediate resistance at $115.52 looms large, and the market's ability to overcome this level will be a crucial determinant of its short-to-medium term trajectory. While the 4-hour chart shows encouraging signs for bulls, the daily overbought RSI(14) at 82.72 cannot be ignored, signaling a high probability of a pullback or consolidation phase. The strong ADX values across timeframes confirm that significant trends are in play, but even the strongest trends can experience sharp corrections. For now, patience appears to be the most prudent strategy. Traders should watch for a decisive break above $113.84, targeting $114.70 and then $115.52, with a strict stop-loss below $112.00 for bullish positions. Alternatively, a failure to hold $112.00 could signal a move towards $111.14. The ongoing narrative of energy security versus demand slowdown, intertwined with the dollar's strength, will continue to dictate price action. Ultimately, disciplined risk management and adherence to clear price levels will be key to navigating this volatile landscape.
Volatility creates opportunity - those prepared will be rewarded.
With clear levels and a defined risk strategy, navigating these turbulent markets becomes manageable.
Technical Outlook Summary
| Indicator | Value | Signal | Interpretation |
|---|---|---|---|
| RSI (14) | 82.72 | Overbought | Daily RSI is extremely overbought, signaling a potential reversal. |
| MACD Histogram | +1.08 | Bullish Momentum | Positive histogram on 1D suggests upward momentum continues, but watch for divergence. |
| Stochastic | K:77.43, D:65.57 | Overbought | Daily Stochastic is in overbought territory, indicating potential for a pullback. |
| ADX | 66.86 | Strong Trend | Very strong trend on daily chart, but extreme values can precede reversals. |
| Bollinger Bands | Upper Band | Watch | Price is pushing towards the upper band on shorter timeframes, but daily is extended. |
Key Levels
Frequently Asked Questions: BRENT Analysis
What happens if BRENT breaks above the $113.84 resistance level?
A decisive break above $113.84 on the 4-hour chart, supported by sustained volume, could trigger further upside momentum. The immediate target would be $114.70, with a secondary target at the significant psychological resistance of $115.52.
Should I consider buying BRENT at current levels around $113.15 given the daily RSI is 82.72?
Buying at current levels carries significant risk due to the extremely overbought daily RSI. A more prudent approach would be to wait for a pullback to support levels like $112.00 or $111.14, or for a confirmed breakout above $115.52, with a tight stop-loss.
Is the daily ADX at 66.86 a sell signal for BRENT right now?
An ADX of 66.86 indicates a very strong trend, not necessarily a sell signal itself. However, such extreme values, combined with overbought RSI, suggest the current uptrend is mature and vulnerable to a sharp correction or reversal. Caution is advised.
How will escalating Middle East tensions affect BRENT prices this week?
Escalating tensions typically add a geopolitical risk premium to crude oil prices. If significant supply disruptions occur or are threatened, Brent could break above $115.52 resistance. Conversely, if tensions de-escalate, the overbought technicals could lead to a sharp sell-off.
Track markets in real-time
AI-powered analysis, technical indicators and real-time price data.
Join Our Telegram Channel
Breaking market news, AI analysis and trading signals instantly.
Join Channel