The global energy landscape is once again dominated by geopolitical fault lines, with escalating tensions in the Middle East sending shockwaves through oil markets. Brent crude, the international benchmark, is currently trading at a critical juncture, hovering around the $112.90 mark. This price point is not just a number; it represents a confluence of strong bullish momentum driven by supply concerns and the ever-present threat of significant resistance levels that have historically capped upward price action. Traders and investors are closely watching to see if the current upward trajectory, fueled by fears of supply disruptions, has enough power to breach these formidable barriers, or if profit-taking and the potential for de-escalation will bring the rally to a halt.
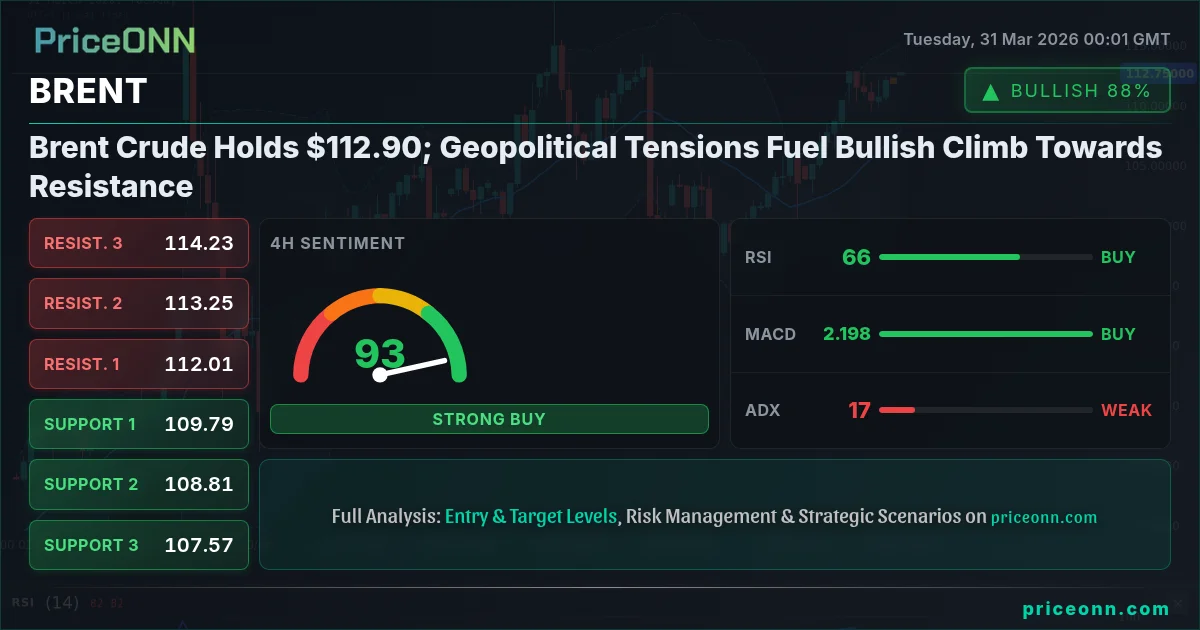
- Brent crude is trading at $112.90, showing bullish momentum with an ADX of 16.96 suggesting a consolidating trend.
- Key support for Brent sits at $109.79 (4H S1), while immediate resistance is at $112.04 (1H R1).
- RSI at 67.32 on the 1H chart signals overbought pressure, indicating caution is needed despite the bullish trend.
- Geopolitical risks in the Middle East are a primary driver, potentially impacting supply and supporting prices near $112.90.
The intricate dance between supply-side anxieties and broader market sentiment is painting a volatile picture for crude oil. Recent events in the Middle East have once again brought supply chain vulnerabilities to the forefront. Any hint of escalation or prolonged conflict in this strategically vital region immediately translates into a risk premium being priced into oil futures. This geopolitical backdrop has been a consistent catalyst for upward price movements in Brent crude, as traders factor in the potential for physical supply disruptions or transit route blockades. The current price of $112.90 reflects this heightened awareness, with the market seemingly pricing in a baseline level of geopolitical risk.
From a technical standpoint, the 1-hour chart for Brent crude presents a compelling, albeit mixed, signal. While the overall trend strength is moderate at 80%, the ADX reading of 19.73 suggests that the current move, despite its upward bias, lacks strong directional conviction. This implies that the market might be consolidating or experiencing a period of indecision, even as prices push higher. The RSI(14) at 67.32 is inching towards overbought territory, a classic sign that the current bullish momentum might be straining. However, it's not yet in the extreme zone that typically signals an imminent reversal. The Stochastic indicator, with %K at 80.02 and %D at 56.87, is showing a strong bullish signal, indicating that the upward momentum is still building, yet it also hovers near overbought levels, warranting close observation for potential pullbacks.
The Bollinger Bands on the 1-hour timeframe are currently positioned above the middle band, reinforcing the bullish sentiment. However, the price hugging the upper band can sometimes indicate an overextended move, susceptible to a sharp correction if underlying fundamentals shift or if profit-taking intensifies. The MACD, while showing positive momentum, is currently below its signal line, adding a layer of caution. This divergence between the Stochastic and MACD could be signaling a potential shift in momentum, or simply a temporary pause before the next leg higher. The interplay of these indicators suggests that while the path of least resistance appears to be upwards, the market is not without its internal conflicts, making the $112.90 price level a focal point for immediate action.
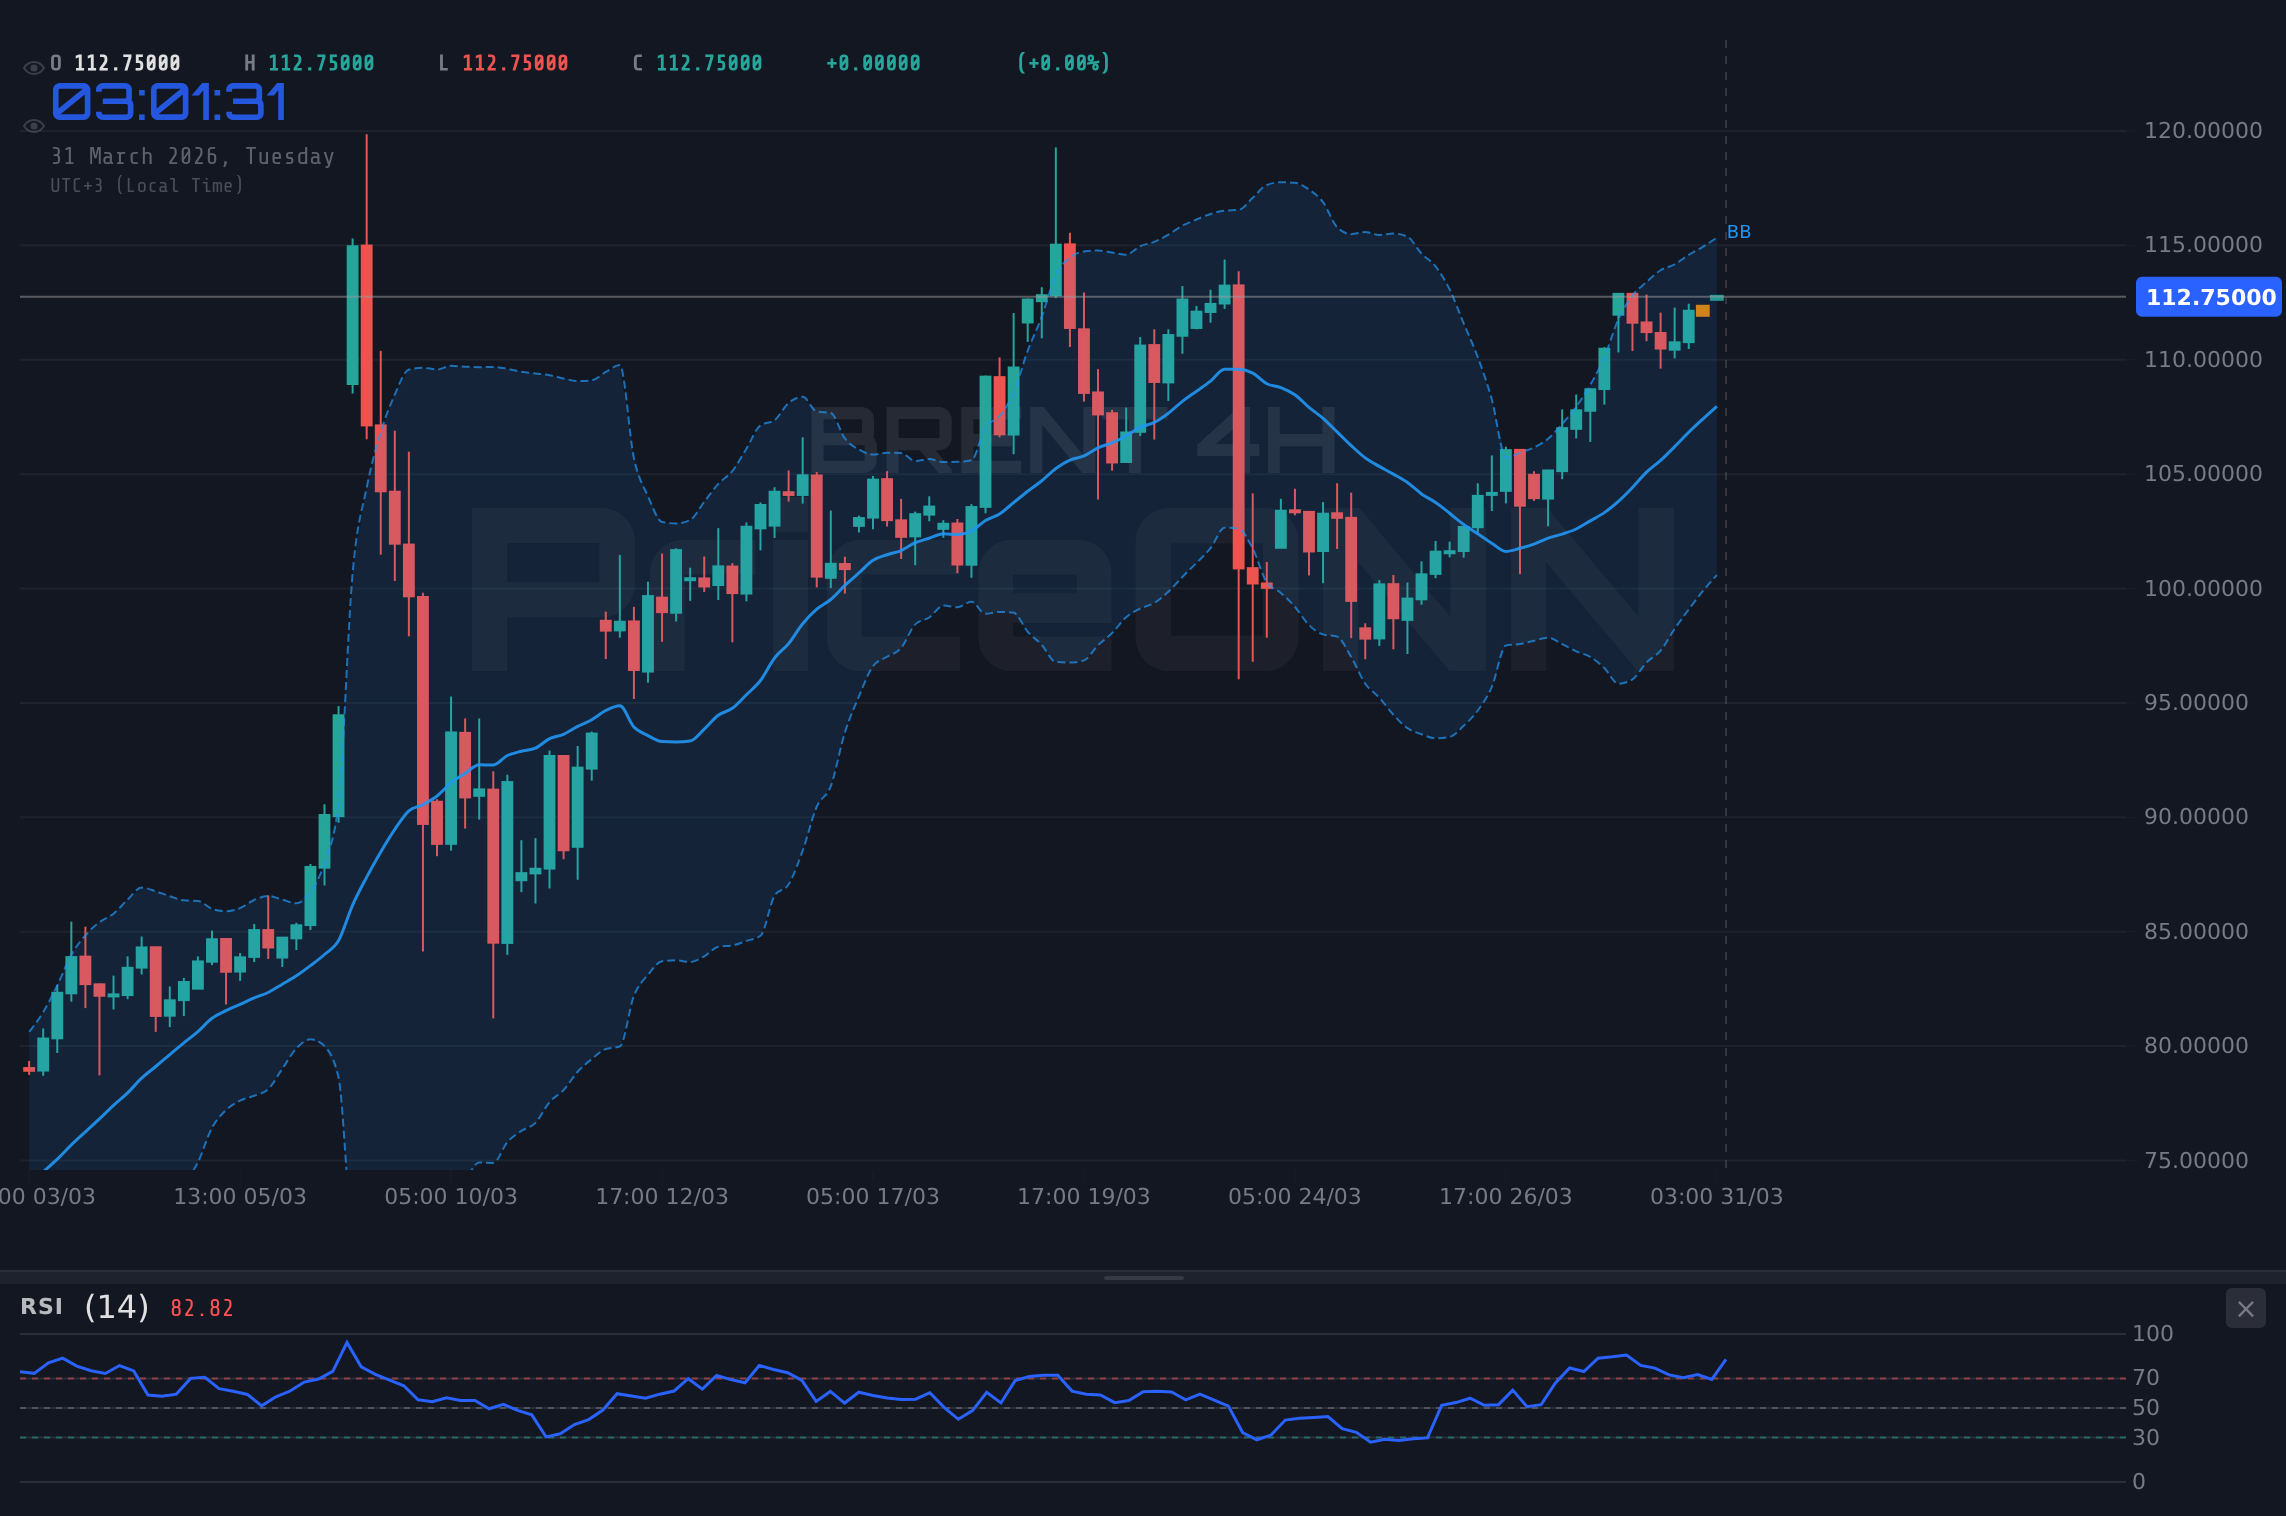
Diving deeper into the 4-hour timeframe offers a slightly more robust bullish outlook, though still within a context of moderate trend strength (50%). The trend is officially classified as 'Up' with a strength of 93%, a notable increase from the 1-hour view. The ADX at 16.96, however, echoes the 1-hour chart's finding of a weak trend, suggesting that the upward move might be more of a grind than a powerful breakout. The RSI(14) here stands at 65.94, still in neutral territory but showing a clear upward inclination. This suggests room for further price appreciation before hitting overbought conditions. The MACD is firmly in positive territory, with its histogram above the signal line, indicating strengthening bullish momentum – a cleaner signal than seen on the shorter timeframe.
The Stochastic on the 4-hour chart is at K=83.09 and D=88.4, signaling an overbought condition. This is a critical divergence from the MACD and raises a red flag. While the MACD suggests the uptrend is gaining steam, the Stochastic is screaming that the rally might be getting stretched. The Bollinger Bands on this timeframe are also above the middle band, confirming the bullish bias. However, the Stochastic's overbought reading, coupled with the moderate ADX, implies that this rally might be approaching a point where consolidation or a minor pullback is more likely than a sustained surge higher. The price at $112.90 is therefore navigating these conflicting signals, perched between the potential for further gains and the risk of a short-term correction.
On the daily chart, the picture becomes significantly clearer, revealing a strong, established bullish trend with a power rating of 100%. The ADX at a robust 62.65 signifies a very strong trend, indicating that the current upward movement in Brent crude is not a mere fluctuation but a committed directional push. The RSI(14) sits at 70.87, firmly in overbought territory. This is a classic signal that the asset is trading at a pace that may be unsustainable in the short to medium term and could be due for a consolidation or pullback. However, in strong trending markets, RSI can remain overbought for extended periods. The MACD is positive and above its signal line, confirming the strong bullish momentum on this longer timeframe. The Stochastic, at K=55.78 and D=43.27, still shows a bullish signal, indicating that despite the RSI's overbought status, the underlying upward pressure remains intact.
The Bollinger Bands on the daily chart are also positioned above the middle band, aligning with the bullish trend. The price action at $112.90 is currently testing the upper limits of this upward momentum. The confluence of a very strong daily trend (ADX > 60) with an overbought RSI (above 70) often leads to periods of sideways consolidation rather than sharp reversals. This suggests that while the immediate risk of a dramatic fall might be limited, the potential for the rally to stall and consolidate around current levels before potentially continuing higher or experiencing a more significant correction increases. The market is at a critical point where the daily trend strength is undeniable, but the shorter-term indicators are flashing warnings of overextension.
When we correlate Brent's price action with macroeconomic factors, the picture becomes even more nuanced. The Dollar Index (DXY) is currently showing strength, trading at 100.33 and exhibiting a powerful 1-hour and 4-hour uptrend. Historically, a strengthening dollar often puts downward pressure on dollar-denominated commodities like oil, as they become more expensive for holders of other currencies. However, in this instance, the geopolitical risk premium appears to be overriding the typical inverse correlation. Despite the DXY's upward push, Brent crude is rallying, highlighting the dominance of supply-side concerns. This suggests that market participants are prioritizing the immediate threat to oil supply over the currency dynamics, a sign of significant underlying bullish sentiment in the energy complex.
Furthermore, the performance of major equity indices like the SP500 and Nasdaq 100 adds another layer to the narrative. Both indices are showing significant daily declines, with the SP500 down 0.44% and the Nasdaq 100 down 0.99%. This indicates a general risk-off sentiment in the broader financial markets. Typically, a decline in equities would correlate with a drop in oil prices as investors reduce exposure to riskier assets. However, Brent's resilience, trading at $112.90 and showing a bullish trend on longer timeframes, suggests that oil is acting as a relative safe haven or, more accurately, is being driven by specific fundamental factors (geopolitics and supply) that are independent of, or even counteracting, the broader market's risk aversion. This divergence is a key observation for traders.
Looking at the specific support and resistance levels, the immediate price action around $112.90 is critical. On the 1-hour chart, the closest resistance is identified at $112.04, with further levels at $112.35 and $112.79. Given the current price, these levels are already being tested or are very close. The support levels on this timeframe are $111.29, $110.85, and $110.54. A decisive break above the $112.79 resistance could signal further upside potential. Conversely, a failure to hold $111.29 could lead to a swift move lower.
On the 4-hour chart, the resistance levels are more significant, starting at $112.01, followed by $113.25, and then $114.23. The current price of $112.90 is pushing towards the $113.25 level. A sustained move above $114.23 would be a strong bullish signal. The support levels here are $109.79, $108.81, and $107.57. These lower levels represent crucial areas where buying interest could re-emerge if a pullback occurs. The daily chart resistance levels are even higher, with $113.11, $115.75, and $117.45, suggesting that while current resistance is significant, the longer-term trend still has room to run if these immediate hurdles are cleared.
The economic calendar provides context, though much of the immediate driver appears to be geopolitical rather than data-driven at this exact moment. However, upcoming high-impact events, particularly those related to energy-consuming economies like the US and Europe, will be crucial. For instance, US inflation data and employment figures, typically released mid-week, will provide insights into demand-side strength. If inflation proves persistent, it could signal continued demand for oil, while stronger employment numbers might suggest robust economic activity. Conversely, weaker-than-expected data could dampen demand expectations and put pressure on oil prices, even amidst geopolitical jitters. The market's reaction to these upcoming releases will be key in determining whether the current Brent rally has legs or if it's a temporary surge driven solely by supply fears.
The news regarding Bangladesh seeking Russian diesel amidst global energy shocks, as reported by sources like Reuters, underscores the fragmented and complex nature of the current energy market. Countries are actively seeking alternative supply routes and sources, which can create localized price pressures and shifts in global trade flows. While this specific deal might not dramatically impact global Brent prices immediately, it highlights the underlying tightness and the lengths nations are going to secure energy resources. This persistent demand-side pressure, coupled with supply-side risks, creates a bullish undercurrent for crude oil prices, supporting the move towards $112.90 and beyond.
Considering the technical signals and the macroeconomic backdrop, the scenario analysis for Brent crude at $112.90 becomes crucial for traders. The strong daily trend is undeniable, supported by robust ADX and positive MACD readings on longer timeframes. However, the overbought RSI on the 1H and daily charts, combined with the weak trend strength indicated by the ADX on shorter timeframes, suggests that the path forward might not be a straight line. The immediate resistance levels are formidable, and a failure to break them decisively could lead to a period of consolidation or a short-term pullback. The market is at a crossroads, where geopolitical headlines could easily override technical signals, or vice versa.
Bearish Scenario: Consolidation or Correction Near Resistance
65% ProbabilityNeutral Scenario: Range-Bound Trading Around $112.90
25% ProbabilityBullish Scenario: Breakout Above Resistance
10% ProbabilityFrequently Asked Questions: BRENT Analysis
What happens if Brent crude breaks above the $114.23 resistance level?
A sustained break above the $114.23 resistance on the 4-hour chart, a level confirmed by our data, would signal a strong bullish continuation. This could potentially target the next significant resistance at $115.75 (1D R2), driven by ongoing geopolitical supply concerns.
Should I consider buying Brent at current levels of $112.90 given the RSI at 67.32?
With the 1-hour RSI at 67.32 and the 4-hour Stochastic in overbought territory, buying aggressively at $112.90 carries risk. While the daily trend is bullish, the immediate overbought conditions suggest waiting for a potential pullback towards support around $111.29 (1H S1) or for consolidation before entering.
Is the ADX at 16.96 a sell signal for Brent crude right now?
An ADX reading of 16.96 on the 1-hour and 4-hour charts indicates a weak trend, not necessarily a sell signal. It suggests the market is consolidating or lacks strong directional conviction despite the price movement. A stronger ADX reading (above 25) would be needed to confirm a sustained trend. Therefore, caution is advised when trading BRENT at $112.90 with such a low ADX.
How will upcoming US inflation data affect Brent crude prices around $112.90?
Higher-than-expected US inflation data could signal robust demand, potentially supporting Brent prices near $112.90 by reinforcing the bullish trend. Conversely, lower inflation might dampen demand expectations, potentially triggering a pullback towards support levels as the market reassesses the economic outlook.
Track markets in real-time
AI-powered analysis, technical indicators and real-time price data.
Join Our Telegram Channel
Breaking market news, AI analysis and trading signals instantly.
Join Channel