The narrative around Brent crude has dramatically shifted. Just days ago, the market was fixated on the potential for an energy shock driving prices skyward. Now, the conversation is pivoting towards the economic ramifications of elevated oil prices, particularly as geopolitical tensions continue to simmer in the Middle East. Brent is currently trading around $106.25, a level that demands close attention as it navigates this complex fundamental landscape.
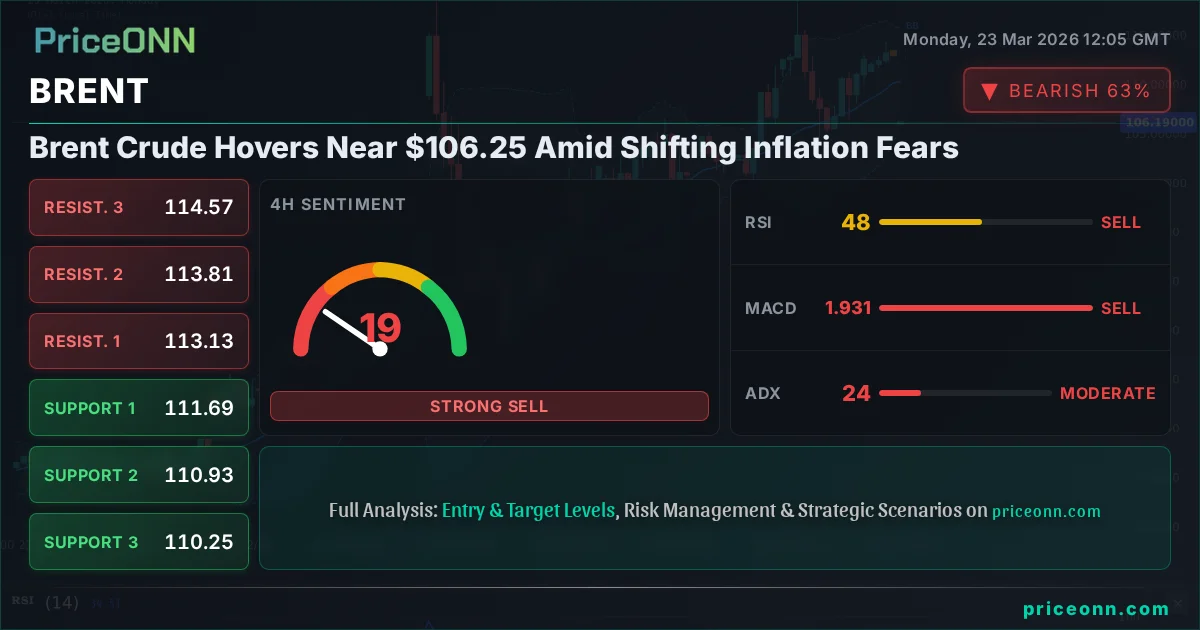
- Brent crude is trading near $106.25, reflecting a market grappling with both supply-side risks and demand-side concerns.
- Geopolitical tensions in the Middle East are a significant driver, prompting discussions about strategic reserve releases by the IEA.
- The correlation between oil prices and inflation remains a critical factor, with rising energy costs potentially embedding inflation and influencing central bank policy.
- Technical indicators on the 1-hour and 4-hour charts suggest a cautious outlook, with mixed signals that warrant close monitoring of key support and resistance levels.
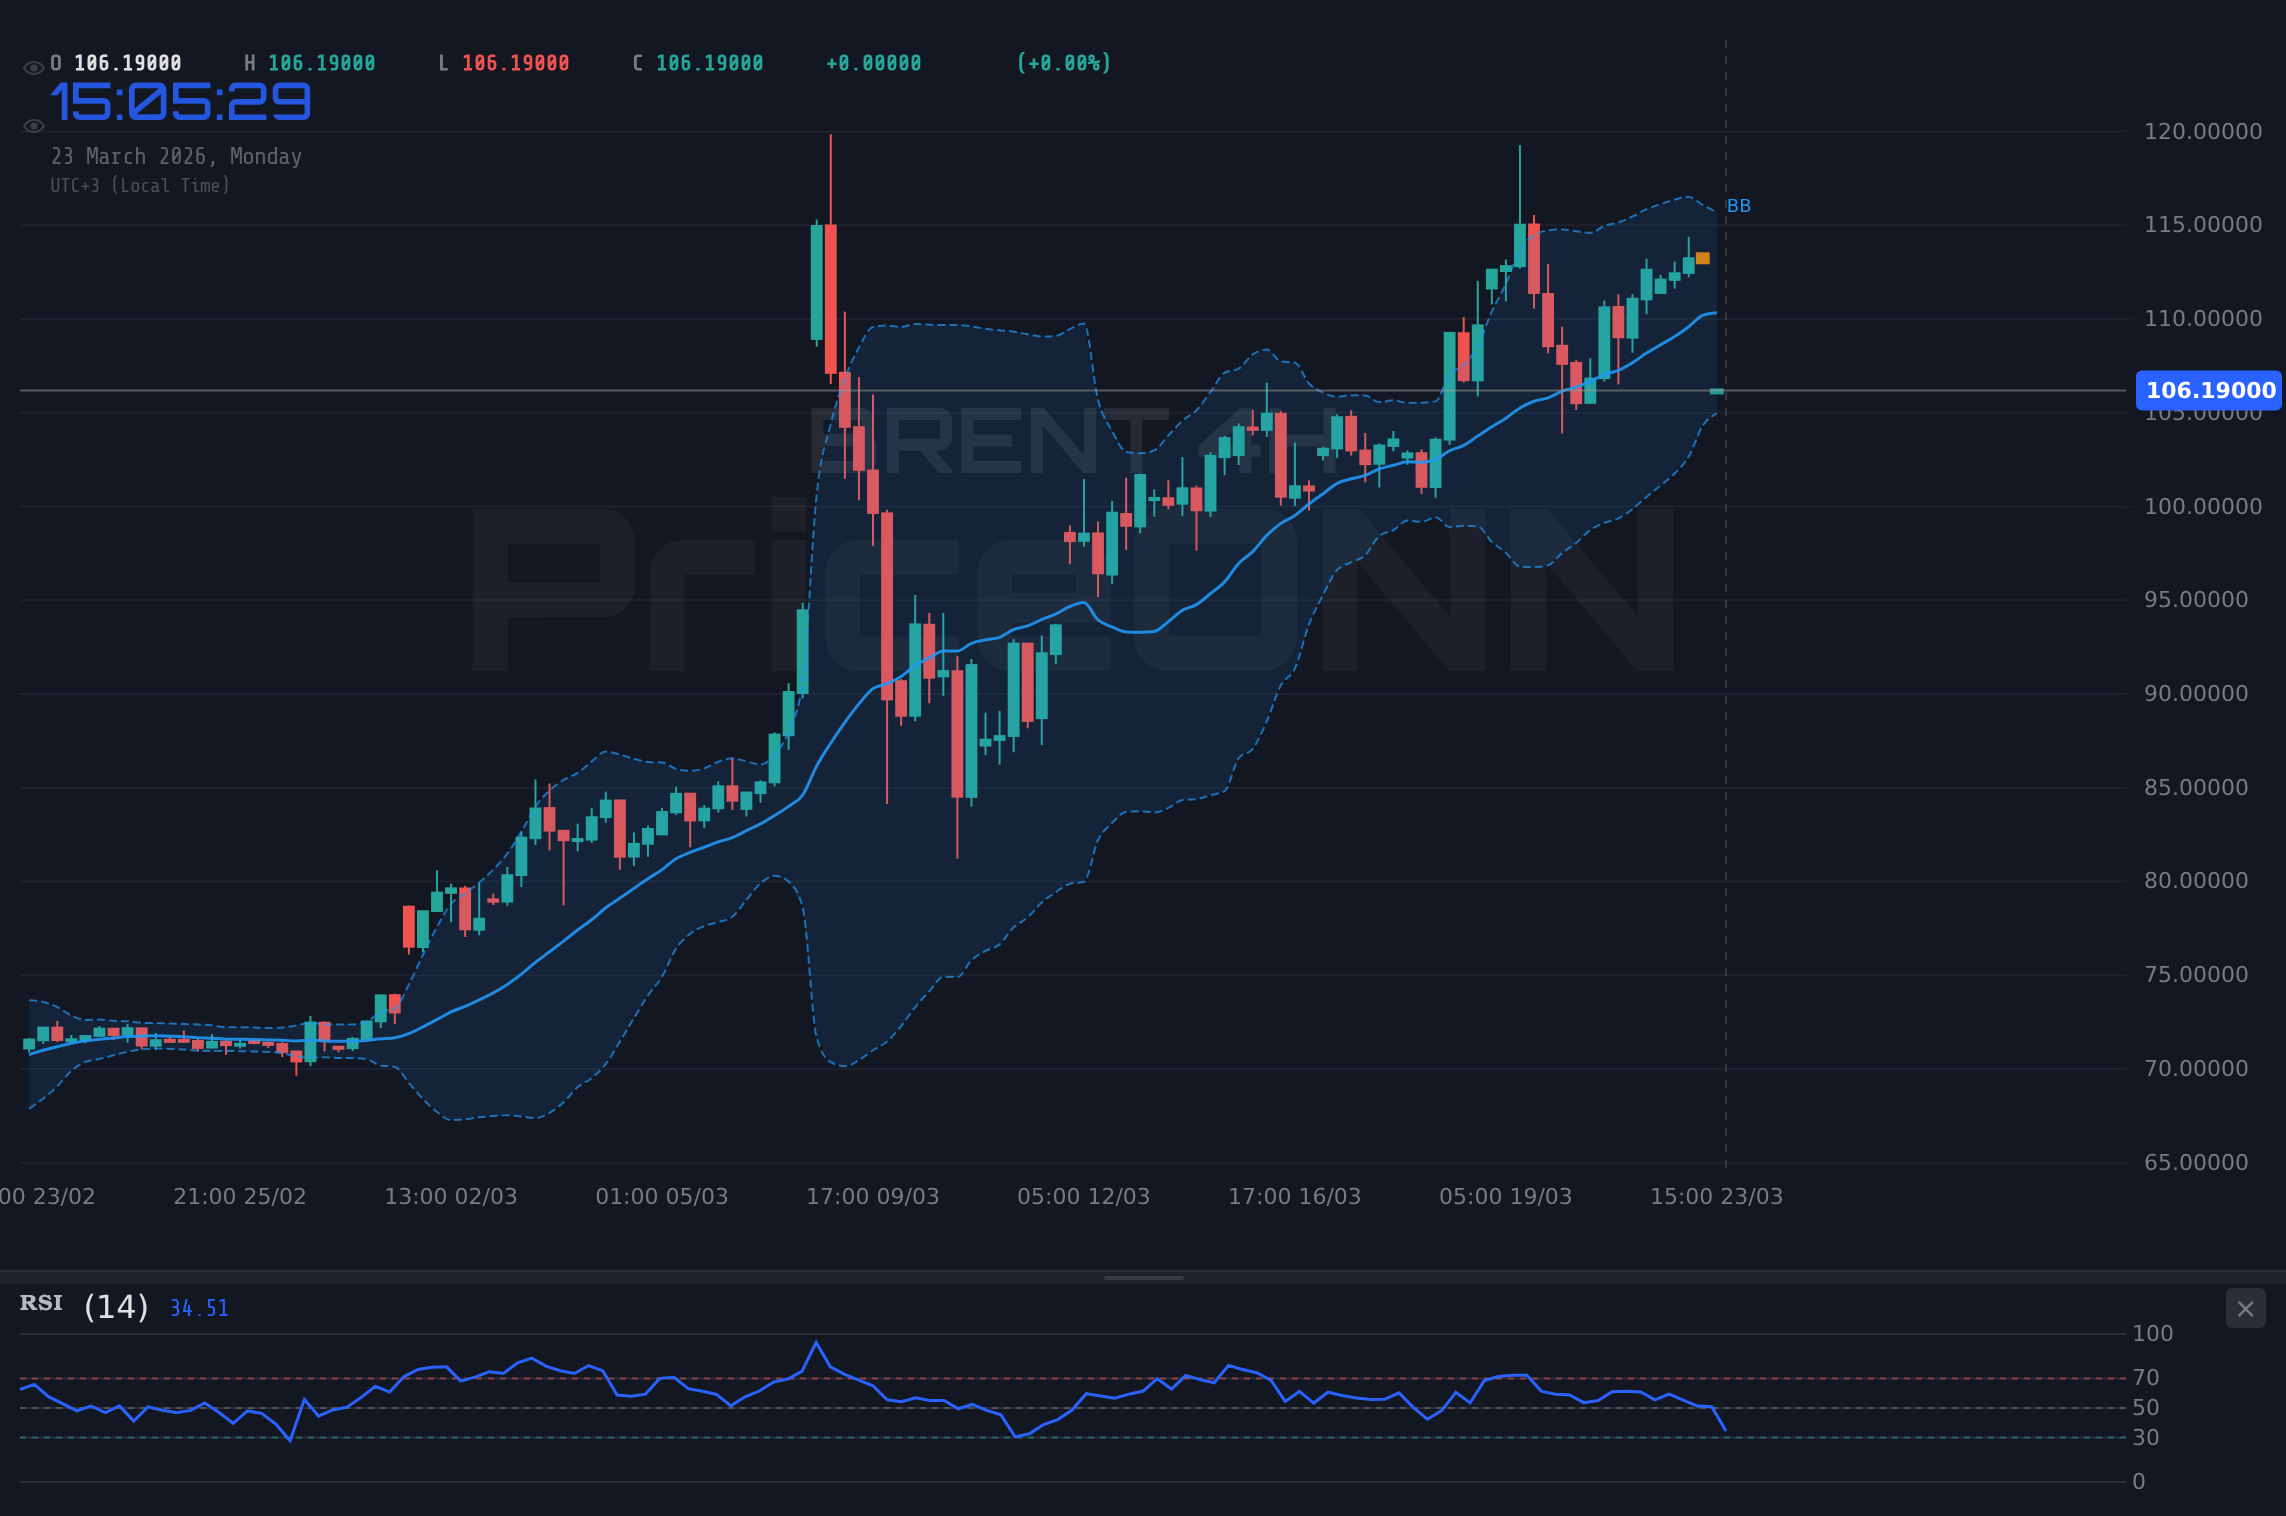
The recent sharp decline in Brent crude, dropping significantly from its highs, underscores the market's sensitivity to both supply disruptions and the broader economic outlook. While the International Energy Agency (IEA) is signaling readiness to release more crude from strategic reserves amid escalating Middle East tensions, the underlying economic concerns are casting a long shadow. This is not just about the immediate availability of oil; it's about how sustained high energy prices will impact global growth, consumer spending, and ultimately, inflation. The market is clearly weighing these competing forces, leading to the current choppy price action around the $106.25 mark.
The Tug-of-War: Geopolitics vs. Economic Headwinds
The geopolitical backdrop remains a primary catalyst for oil price volatility. Heightened tensions in the Middle East have historically been a trigger for price spikes, and the current climate is no exception. News reports indicate that the IEA is actively discussing potential interventions, such as releasing more crude from strategic reserves. This suggests a concerted effort by major consuming nations to mitigate the inflationary impact of any supply shock. However, the effectiveness of such measures in the long run is debatable. While they can provide temporary relief, they do not address the fundamental supply-demand imbalances or the underlying geopolitical instability.
This dynamic creates a fascinating tug-of-war for traders. On one hand, supply-side fears driven by geopolitical events can create upward pressure on prices. On the other, the potential for strategic reserve releases and the growing concern over stagflation - a scenario of high inflation coupled with slow economic growth - act as a strong counterweight. The market's reaction to these conflicting signals is what we are witnessing around the $106.25 level for Brent. Traders are trying to price in the probability of both a supply disruption and a subsequent economic slowdown that could dampen demand.
Inflationary Pressures and Central Bank Scrutiny
The relationship between oil prices and inflation is deeply intertwined. As energy costs represent a significant component of consumer and industrial expenses, sustained high oil prices can embed inflationary pressures throughout the economy. This is a critical concern for central banks worldwide, which are already battling elevated inflation rates. The market is keenly watching how central banks like the Federal Reserve and the European Central Bank will react to this persistent inflationary backdrop. Any indication of a more hawkish stance - meaning a greater likelihood of interest rate hikes or a slower pace of rate cuts - could significantly impact global growth prospects and, consequently, oil demand.
The recent surge in oil prices, even with the subsequent pullback, has reignited fears of stagflation. This is a particularly challenging economic environment where rising prices are accompanied by stagnant economic growth. In such a scenario, central banks face a difficult dilemma: raise interest rates to combat inflation, potentially further slowing growth, or maintain accommodative policies, risking even higher inflation. The market's interpretation of these central bank responses will be a key determinant of future oil price movements. For Brent crude, currently hovering near $106.25, this means that any commentary from policymakers or economic data releases that signals a tougher stance on inflation will likely weigh on prices, while signs of economic resilience could offer support.
Technical Signals: A Mixed Picture at $106.25
Turning to the technical charts, the picture for Brent crude around the $106.25 level is nuanced, offering mixed signals across different timeframes. On the 1-hour chart, the trend is described as neutral with a force of 50%. The RSI(14) is at 41.7, indicating a downward inclination within the neutral zone. The MACD shows positive momentum, with the MACD line above its signal line, suggesting some underlying strength. However, the Bollinger Bands are trading below the middle band, pointing to a bearish tendency. The Stochastic Oscillator, with K=55.26 and D=32.11, offers a bullish signal as %K is above %D, but this is countered by a strong ADX of 49.35, which signifies a powerful downtrend in force. The overall signal on this timeframe is 'SELL', with 3 buys, 5 sells, and 0 neutral indicators.
The 4-hour timeframe presents a clearer, albeit bearish, picture. The trend is firmly in 'Downtrend' with 100% force. The RSI(14) at 19.36 is deep in oversold territory, theoretically presenting a potential buying opportunity. However, the MACD is negative, and the Bollinger Bands are below the middle band, reinforcing the bearish sentiment. The Stochastic is also signaling a 'SELL' with %K below %D. Most notably, the ADX at 66.75 indicates a very strong downtrend. The overwhelming 'SELL' signal on this timeframe, despite the oversold RSI, suggests that short-term traders might be looking for further downside before any significant reversal can be expected. This suggests that the $106.25 price point is currently facing selling pressure.
On the daily chart, the trend is again neutral with 50% force. The RSI(14) at 26.31 is also in oversold territory, hinting at a possible bounce. The MACD is negative, and the Bollinger Bands are below the lower band, indicating extreme bearishness or a potential breakout to the downside. The Stochastic is deeply oversold at 8.77 for K and 10.76 for D, pointing towards a potential reversal. However, the ADX at 22.26 suggests only a moderately strong downtrend. The overall signal is 'SELL', with 3 buys, 5 sells, and 0 neutral indicators. This confluence of oversold conditions on longer timeframes, coupled with strong downtrend signals on shorter timeframes, creates a complex environment for traders attempting to navigate Brent crude's price action around $106.25.
Correlation Analysis: DXY and Equities
Understanding the correlation between Brent crude and other major market instruments is crucial for a holistic view. The Dollar Index (DXY) is currently trading at 99.36 and showing a rising trend on the daily chart (92% strength). Historically, a stronger dollar tends to put pressure on dollar-denominated commodities like Brent crude, as they become more expensive for holders of other currencies. With the DXY showing strength, this presents a headwind for oil prices. The market's reaction around $106.25 for Brent will likely be influenced by the DXY's ability to maintain its upward momentum.
Equities, particularly the S&P 500 (currently at 6586.8 and showing a strong downtrend on the daily chart with 100% force) and the Nasdaq 100 (at 24185.48, also in a strong downtrend), provide another layer of correlation. A declining risk appetite, as indicated by weakness in major equity indices, often leads to increased demand for safe-haven assets and a reduction in speculative commodity trading. If stocks continue to fall, it could signal a broader economic slowdown, which would naturally dampen oil demand and weigh on Brent prices. Conversely, a recovery in equities, potentially fueled by positive economic data or central bank dovishness, could provide a tailwind for oil.
Economic Calendar Watchlist
The economic calendar is packed with events that could significantly influence Brent crude's trajectory. Given the market's focus on inflation and central bank policy, upcoming data releases related to consumer prices (CPI), producer prices (PPI), and employment figures (like Non-Farm Payrolls) will be closely scrutinized. The actual results versus forecasts for these indicators will provide crucial insights into the health of the global economy and the potential path of monetary policy. For instance, higher-than-expected inflation data could reinforce fears of stagflation and prompt a more aggressive response from central banks, potentially dampening oil demand.
Furthermore, manufacturing and services PMI data from major economies like the US, Eurozone, and China will offer real-time indicators of economic activity. A strong PMI reading would suggest robust demand, potentially supporting oil prices, while a weak reading could confirm fears of a slowdown. Investors will also be paying attention to any commentary from central bank officials, particularly from the Federal Reserve. Any hints about future interest rate decisions or their outlook on inflation will be critical in shaping market sentiment and, consequently, oil price expectations. The current price of Brent crude around $106.25 is a precarious position, highly sensitive to these upcoming fundamental catalysts.
Bearish Scenario: Continued Downside Pressure
65% ProbabilityNeutral Scenario: Range-Bound Consolidation
25% ProbabilityBullish Scenario: Reversal Potential
10% ProbabilityFrequently Asked Questions: BRENT Analysis
What happens if Brent crude breaks below the $111.88 support level?
If Brent crude closes below the $111.88 support level, the bearish scenario becomes more probable. This could trigger a move towards the next support at $110.85, as the strong downtrend on the 4-hour chart would be reinforced.
Should I consider buying Brent near $106.25 given the oversold RSI on the daily chart?
While the daily RSI at 26.31 suggests oversold conditions, the strong downtrend signals on shorter timeframes and the prevailing geopolitical risks warrant caution. A confirmed break above $113.91 resistance would be a more reliable buy signal, suggesting a shift in momentum.
Is the ADX at 49.35 on the 1H chart a sell signal for Brent crude?
An ADX value of 49.35 on the 1-hour chart indicates a very strong trend. Combined with the other bearish indicators on this timeframe, it suggests that downward momentum is significant. However, traders should look for confirmation from price action and other indicators before initiating a short position.
How will the potential IEA oil reserve release affect Brent crude prices this week?
A release of strategic oil reserves by the IEA could provide temporary downward pressure on Brent prices, potentially pushing them towards $111.88 or lower. However, the long-term impact will depend on the scale of the release and the persistence of geopolitical tensions.
Technical Outlook Summary
| Indicator | Value | Signal | Interpretation |
|---|---|---|---|
| RSI (14) | 41.7 | Neutral | Downward inclination within neutral zone on 1H. Deep oversold on 1D (26.31). |
| MACD Histogram | Positive Momentum (1H), Negative (4H/1D) | Bearish | Mixed signals, but negative momentum dominates on longer timeframes. |
| Stochastic | K=55.26, D=32.11 (1H) / K=19.27, D=22.77 (4H) | Bearish | Bullish on 1H, but bearish on 4H and deeply oversold on 1D. |
| ADX | 49.35 (1H), 66.75 (4H), 22.26 (1D) | Bearish | Very strong downtrend indicated on 4H, strong on 1H, moderate on 1D. |
| Bollinger Bands | Below Middle Band (1H/4H), Below Lower Band (1D) | Bearish | Indicates selling pressure and potential for further downside. |
Track markets in real-time
AI-powered analysis, technical indicators and real-time price data.
Join Our Telegram Channel
Breaking market news, AI analysis and trading signals instantly.
Join Channel