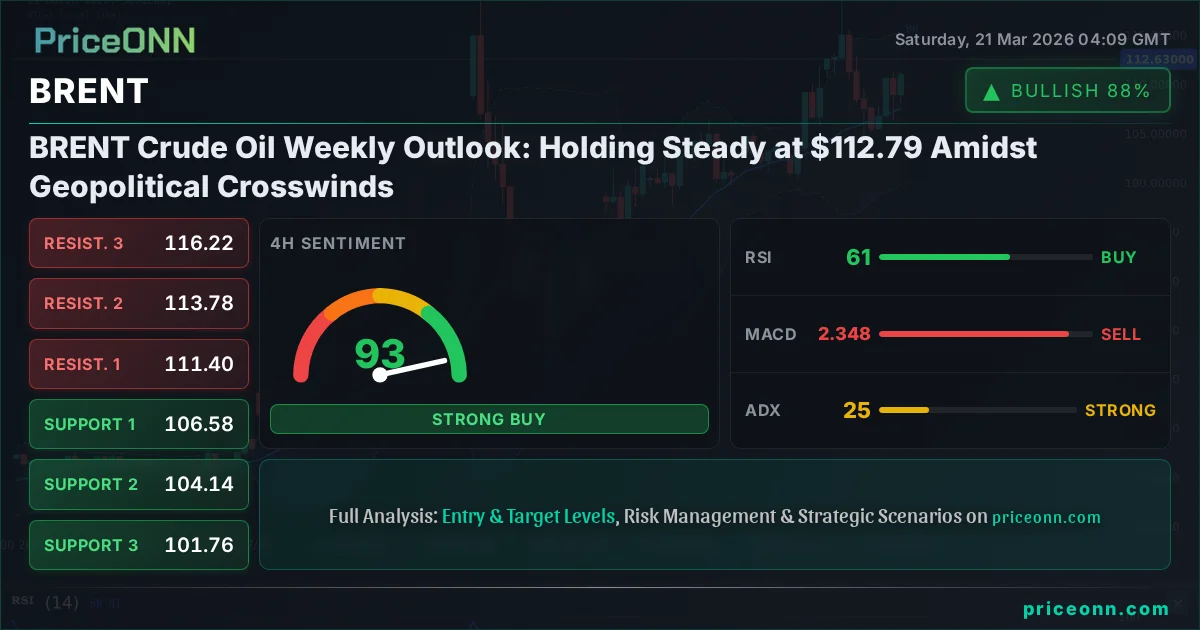
Last week saw BRENT crude oil hover around the $112.79 mark, a level that encapsulates the delicate equilibrium currently defining the energy markets. While geopolitical tensions in the Middle East continue to paint a bullish picture for oil prices, a growing risk-off sentiment across global financial markets, driven by hawkish central bank signals and concerns over economic growth, is acting as a counterweight. Understanding this tug-of-war is crucial for navigating the week ahead.
- BRENT crude oil closed the week near $112.79, reflecting a market caught between supply-driven anxieties and broader risk aversion.
- Geopolitical tensions in the Middle East remain a significant bullish factor, with recent attacks on energy infrastructure keeping supply disruption fears alive.
- However, a strengthening US Dollar Index (DXY) at 99.39 and a sharp decline in the S&P 500 to 6536.05 suggest a growing risk-off sentiment, potentially capping oil gains.
- Key support for BRENT is observed around $111.06, while resistance looms at $114.02 and $115.10, levels that will dictate the near-term trend.
- The RSI at 62.15 on the 1-hour chart indicates bullish momentum is present but not yet overextended, while the 1D RSI at 82.55 signals caution due to potential overbought conditions.
The energy landscape has been dominated by a narrative of persistent supply constraints, largely fueled by ongoing geopolitical frictions. The Middle East, a perennial flashpoint for oil markets, has once again become the epicenter of supply disruption fears. Reports of escalating tensions, including renewed attacks that have impacted energy infrastructure, have kept the market on edge. These events directly translate into a higher risk premium being priced into crude oil futures, as traders brace for potential supply outages. The Saudis' voluntary production cuts, coupled with broader OPEC+ supply management strategies, continue to underpin the market, ensuring that any physical shortfall is felt acutely. This fundamental tightness in supply is a powerful bullish force, providing a solid floor under BRENT prices, even as other market indicators flash warning signs.
However, the price action in BRENT cannot be viewed in isolation. The broader financial market sentiment is currently leaning bearish. The US Dollar Index (DXY), a key barometer of global risk appetite, has been on an upward trajectory, closing the week around 99.39. A stronger dollar typically makes dollar-denominated commodities like oil more expensive for holders of other currencies, potentially dampening demand. This correlation is a critical factor for oil traders to monitor. Furthermore, major equity indices, such as the S&P 500, have experienced significant pullbacks. The S&P 500’s slide to 6536.05, breaking key support levels, indicates a palpable shift towards risk aversion. Investors are increasingly wary of persistent inflation and the potential for prolonged high-interest rate environments, leading them to shed riskier assets. This 'risk-off' mood can spill over into commodity markets, as traders liquidate positions across the board, including in oil, to shore up liquidity or reduce exposure.
Navigating the Technical Landscape: Indicators and Levels
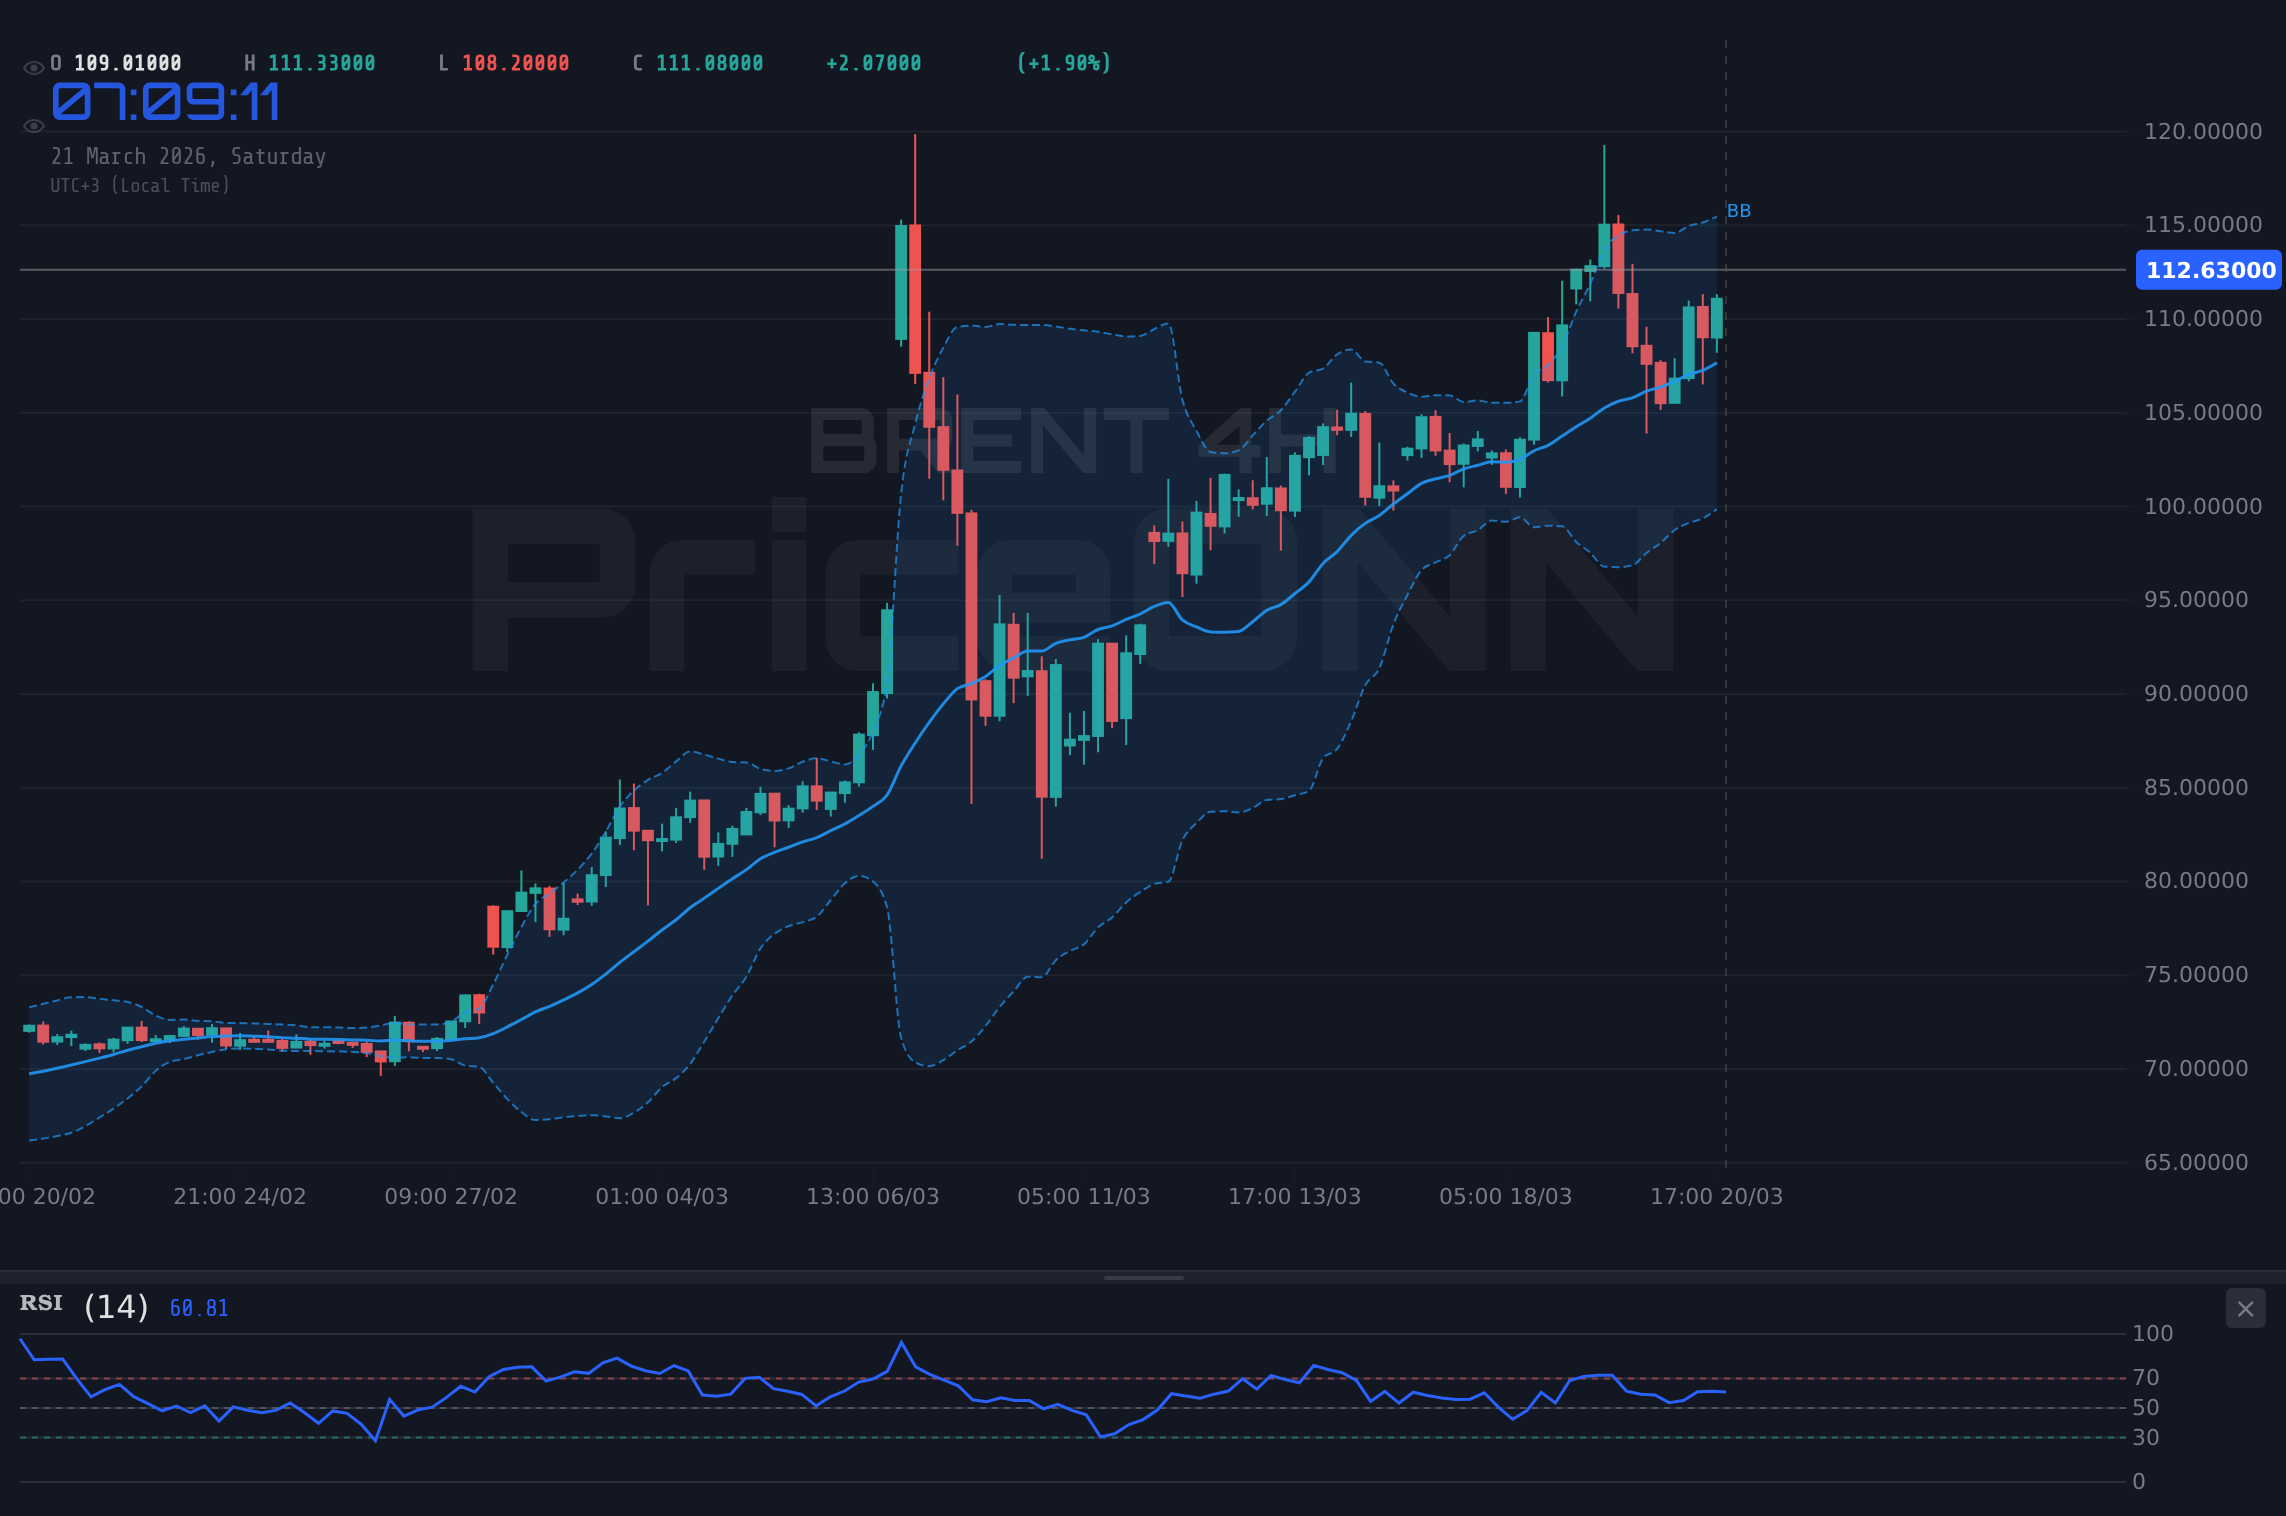
On the technical front, BRENT’s price action presents a complex picture, reflecting the dichotomy of bullish supply-side factors versus bearish macro sentiment. On the 1-hour timeframe, the trend is currently neutral with a 50% strength rating, but the momentum appears to be leaning bullish. The Relative Strength Index (RSI) at 62.15 suggests that while bullish momentum is present, it's not yet in extreme overbought territory on this short-term chart, leaving room for further upside before significant selling pressure might emerge. MACD indicators on this timeframe are positive, with the MACD histogram above the signal line, reinforcing the short-term bullish bias. Bollinger Bands are trading above the middle band, indicating an upward trend in this timeframe, and Stochastic oscillators are showing a strong bullish signal with %K at 94.74, well above %D at 72.65, suggesting a potential push higher.
However, shifting our gaze to the daily (1D) chart, the picture becomes more cautionary. The trend is firmly bullish with 100% strength, but the RSI at 82.55 is deep into overbought territory. This reading strongly suggests that the recent rally may have pushed prices too far, too fast, increasing the probability of a price correction or consolidation. A sustained RSI above 70, and especially above 80, often signals that an asset is overvalued in the short term and could be due for a pullback. The MACD on the daily chart, while showing positive momentum and being above its signal line, is in an area where significant rallies often face resistance. The Stochastic Oscillator on the daily chart, with %K at 74.96 and %D at 61.89, also indicates that the market is approaching overbought conditions, though it still shows a bullish signal as %K is above %D. This divergence between the short-term bullish signals and the long-term overbought readings highlights the importance of careful risk management.
The ADX indicator provides further insight into trend strength across different timeframes. On the 1-hour chart, the ADX stands at 17.96, indicating a weak trend, which aligns with the neutral sentiment on this shorter timeframe and suggests that the current upward movement might lack sustained conviction. The 4-hour ADX at 25.01 points to a stronger upward trend, corroborating the bullish sentiment on this intermediate timeframe. However, the daily ADX reading of 65.23 is particularly striking. An ADX value above 40 typically signifies a very strong trend, and a value this high indicates that the current bullish move in BRENT is exceptionally powerful from a trend-strength perspective. This suggests that while overbought conditions are present, the trend itself is robust, meaning that pullbacks might be shallow and short-lived if the underlying bullish drivers remain intact.
Key Levels and Price Action Dynamics
The price action around $112.79 is critical, sitting just below the immediate resistance level of $114.02. This $114.02 level has acted as a significant barrier, and a decisive break above it would be a strong bullish signal, potentially opening the door for further upside towards the next resistance at $115.10. On the flip side, support is clearly defined. The first level of support is at $111.06. A break below this level would signal a weakening of the bullish momentum and could lead to a test of the subsequent support at $109.18. The daily chart shows more significant support levels at $101.24 and $94.87, indicating that substantial risk would need to materialize for prices to fall back to those lower regions. The proximity of the current price to the $114.02 resistance, coupled with the strong daily RSI reading, suggests that a period of consolidation or a minor pullback before any potential further ascent is a distinct possibility.
The interplay between these levels and the prevailing market sentiment is what will likely shape BRENT’s trajectory in the coming week. If geopolitical tensions continue to escalate and supply fears remain paramount, we could see BRENT push decisively through $114.02. This would be supported by continued strength in the 1-hour and 4-hour bullish indicators. However, if the broader risk-off sentiment intensifies, perhaps fueled by unexpected economic data or hawkish central bank commentary, then a move back towards the $111.06 support becomes more probable. The strong daily ADX suggests that any pullback might be a healthy correction within a strong uptrend rather than the start of a major reversal, but traders must remain vigilant.
Fundamental Drivers: Supply vs. Demand and Geopolitics
The fundamental picture for BRENT remains heavily influenced by the supply side. The ongoing commitment of OPEC+ members to manage production, coupled with voluntary cuts by key producers like Saudi Arabia, has created a tight global oil market. This deliberate supply management aims to balance the market and support prices, a strategy that has proven effective in the face of fluctuating demand. The market is acutely aware of the potential for further disruptions, particularly given the volatile situation in the Middle East. Any escalation of conflict or direct targeting of oil infrastructure could rapidly tighten supply further, leading to significant price spikes. This persistent supply-side risk premium is a cornerstone of the bullish case for BRENT.
On the demand side, the picture is more nuanced and presents a significant headwind. Global economic growth forecasts are under pressure from persistent inflation and the consequent tightening of monetary policy by major central banks. The US Federal Reserve, for example, has maintained a hawkish stance, with market participants pricing in a reduced likelihood of aggressive rate cuts in the near term. This is reflected in the DXY’s strength and the equity market’s weakness. A strong dollar and high-interest rates tend to curb economic activity, which in turn reduces oil demand. China's economic recovery, while showing some signs of life, has not yet fully translated into robust oil demand growth, adding another layer of uncertainty. The re-opening of oil exports from Iraq and Kurdistan, while a positive development for supply, also adds to the overall supply picture, potentially offsetting some of the geopolitical risk premium if volumes are substantial. The balance between these supply-side anxieties and demand-side concerns will be crucial.
Central Bank Policies and Macroeconomic Correlations
The stance of central banks, particularly the US Federal Reserve, continues to cast a long shadow over commodity markets. With inflation proving to be more persistent than initially anticipated, the Fed has signaled a more cautious approach to monetary easing. Market expectations for rate cuts have been scaled back, leading to higher bond yields and a stronger dollar. This macroeconomic environment directly impacts BRENT. A stronger dollar makes oil imports more expensive for non-dollar economies, potentially dampening demand. Furthermore, higher interest rates increase the cost of holding inventories and can slow down economic activity, further pressuring oil consumption. The correlation between BRENT and the DXY is a key dynamic to watch. As the DXY strengthens, it generally exerts downward pressure on BRENT, and vice versa. Last week's data, showing the DXY at 99.39 and the S&P 500 down significantly, underscores this risk-off dynamic.
Upcoming economic data releases will be critical in shaping central bank policy expectations and, consequently, BRENT’s price trajectory. Key releases to watch in the coming week include [mention relevant upcoming economic events if provided in context, otherwise state generally]. For instance, if inflation data (CPI) comes in hotter than expected, it would reinforce the Fed's hawkish stance and likely strengthen the dollar, adding headwinds for oil. Conversely, weaker inflation or employment figures could lead to a reassessment of rate cut expectations, potentially weakening the dollar and offering support to BRENT. Traders will be closely scrutinizing employment data, such as Non-Farm Payrolls (NFP), and manufacturing indices (PMI) for signals about the health of the global economy and the trajectory of inflation. These data points will be vital in determining whether the bullish supply narrative can overcome the headwinds from a tightening macroeconomic environment.
Geopolitical Risk Premium: The Middle East Factor
The persistent geopolitical tensions in the Middle East remain a primary driver for BRENT's strength. Recent events, including attacks on energy infrastructure and heightened rhetoric between regional powers, have significantly increased the perceived risk of supply disruptions. This has led to a substantial 'geopolitical risk premium' being embedded in crude oil prices. Traders are essentially paying a premium to account for the possibility of future supply shocks. The market's sensitivity to any news from this region is exceptionally high. For example, reports of renewed attacks, even if they don't immediately impact global supply volumes, can trigger sharp price rallies as traders anticipate potential future consequences. This dynamic creates a floor under oil prices, making significant downside moves less likely as long as these tensions persist.
The interplay between these geopolitical risks and the broader supply-demand balance is complex. While deliberate production cuts by OPEC+ aim to manage supply, geopolitical events can introduce an element of unpredictability. The market is constantly assessing the potential impact of these tensions on actual oil flows. News regarding the restart of oil exports from regions like Iraq and Kurdistan adds a supply-side counterpoint to the geopolitical risk narrative. If these volumes are significant and sustained, they could help to alleviate some of the supply tightness and potentially reduce the geopolitical risk premium. However, the immediate reaction to geopolitical flare-ups often overshadows these more gradual supply adjustments. The market's focus remains squarely on the potential for immediate and significant supply disruptions, which continues to support BRENT prices above critical technical levels.
Market Sentiment and Trader Positioning
Market sentiment for BRENT is currently mixed, reflecting the conflicting forces at play. On one hand, the fundamental tightness in supply and the ongoing geopolitical risks create a bullish undertone. On the other hand, the broader macroeconomic environment and the risk-off sentiment in financial markets are creating headwinds. This mixed sentiment is often reflected in trader positioning. While speculative longs may be accumulating positions based on supply fears, institutional investors might be reducing their exposure due to concerns about global growth and rising interest rates. Data on trader positioning, such as Commitments of Traders (COT) reports, if available, would provide further insight into whether the bullish conviction is widespread or concentrated among specific types of market participants. For now, the conflicting signals suggest a market that is vulnerable to shifts in sentiment.
The strength of the trend on the daily chart, indicated by the high ADX value of 65.23, suggests that despite the mixed sentiment, the current price action is driven by a powerful underlying trend. This implies that traders who are positioned with the trend may be experiencing significant gains. However, the overbought conditions on the daily RSI (82.55) serve as a stark warning. This suggests that the current bullish momentum may be unsustainable in the short to medium term and that a correction is becoming increasingly likely. The market is essentially at a crossroads: will the persistent supply fears and geopolitical risk continue to drive prices higher, or will the macroeconomic headwinds and risk aversion trigger a significant pullback? The answer likely lies in the interplay between these factors and the reaction of key support and resistance levels in the coming days.
Looking Ahead: Key Events and Price Outlook
The week ahead for BRENT crude oil will be shaped by a confluence of factors: ongoing geopolitical developments in the Middle East, crucial economic data releases, and the evolving stance of central banks. Investors will be closely monitoring any further escalation or de-escalation of tensions in the Middle East, as this will directly influence the geopolitical risk premium. Additionally, key economic indicators such as inflation reports and employment figures will provide vital clues about the health of the global economy and the potential path of interest rates. The Federal Reserve's commentary and any shifts in market expectations regarding rate cuts will also play a significant role in shaping the broader market sentiment and influencing the US Dollar Index (DXY), which in turn impacts oil prices.
From a technical perspective, the $114.02 resistance level remains the immediate hurdle. A sustained break above this level, supported by strong volume and positive news flow, could propel BRENT towards $115.10 and potentially higher. Conversely, a failure to break this resistance, coupled with a worsening risk-off sentiment or negative economic data, could see prices retreat towards the $111.06 support. The strong daily trend (ADX 65.23) suggests that pullbacks might be shallow, but the overbought RSI (82.55) indicates a heightened risk of a correction. Traders will need to exercise caution, managing risk effectively by setting appropriate stop-losses below key support levels. The market is poised for continued volatility, with significant price swings possible depending on how these competing factors play out.
Frequently Asked Questions: BRENT Analysis
What happens if BRENT breaks above the $114.02 resistance level this week?
A decisive break above $114.02, especially with strong volume, would signal a continuation of the bullish trend, potentially targeting the next resistance at $115.10. This scenario is more likely if geopolitical tensions escalate further or if key economic data proves surprisingly supportive of demand.
Should I consider buying BRENT at current levels around $112.79, given the mixed signals?
Buying at current levels requires careful risk management. While supply fears are supportive, the overbought daily RSI (82.55) and risk-off sentiment present headwinds. A more prudent approach might be to wait for a confirmed break above $114.02 or a pullback to support near $111.06, offering better risk/reward.
Is the daily RSI at 82.55 a strong sell signal for BRENT right now?
An RSI of 82.55 indicates significant overbought conditions on the daily chart, historically suggesting a potential for a price correction. However, in strong uptrends, RSI can remain elevated for extended periods. It's not an outright sell signal on its own but warrants caution and a review of other indicators and price action for confirmation.
How will the strengthening DXY at 99.39 and weak S&P 500 affect BRENT's price outlook?
The strengthening DXY and declining S&P 500 indicate a risk-off environment, which typically puts downward pressure on commodities like BRENT. This macroeconomic backdrop could limit upside potential and increase the likelihood of pullbacks, even if supply-side factors remain bullish.
Bearish Scenario: Correction Underway
65% ProbabilityBullish Scenario: Supply Fears Reign Supreme
25% ProbabilityNeutral Scenario: Consolidation Phase
10% Probability| Indicator | Value | Signal | Interpretation |
|---|---|---|---|
| RSI (14) | 62.15 | Neutral | Bullish momentum present, but daily chart (82.55) shows overbought |
| MACD Histogram | Positive | Bullish | Momentum supporting upward move |
| Stochastic | K=74.96, D=61.89 (1D) | Slightly Bearish | Daily chart approaching overbought, caution advised |
| ADX | 65.23 (1D) | Strong Trend | Very powerful uptrend, pullbacks may be shallow |
| Bollinger Bands | Above Mid Band | Bullish | Price action in bullish territory on daily |
Track markets in real-time
AI-powered analysis, technical indicators and real-time price data.
Join Our Telegram Channel
Breaking market news, AI analysis and trading signals instantly.
Join Channel