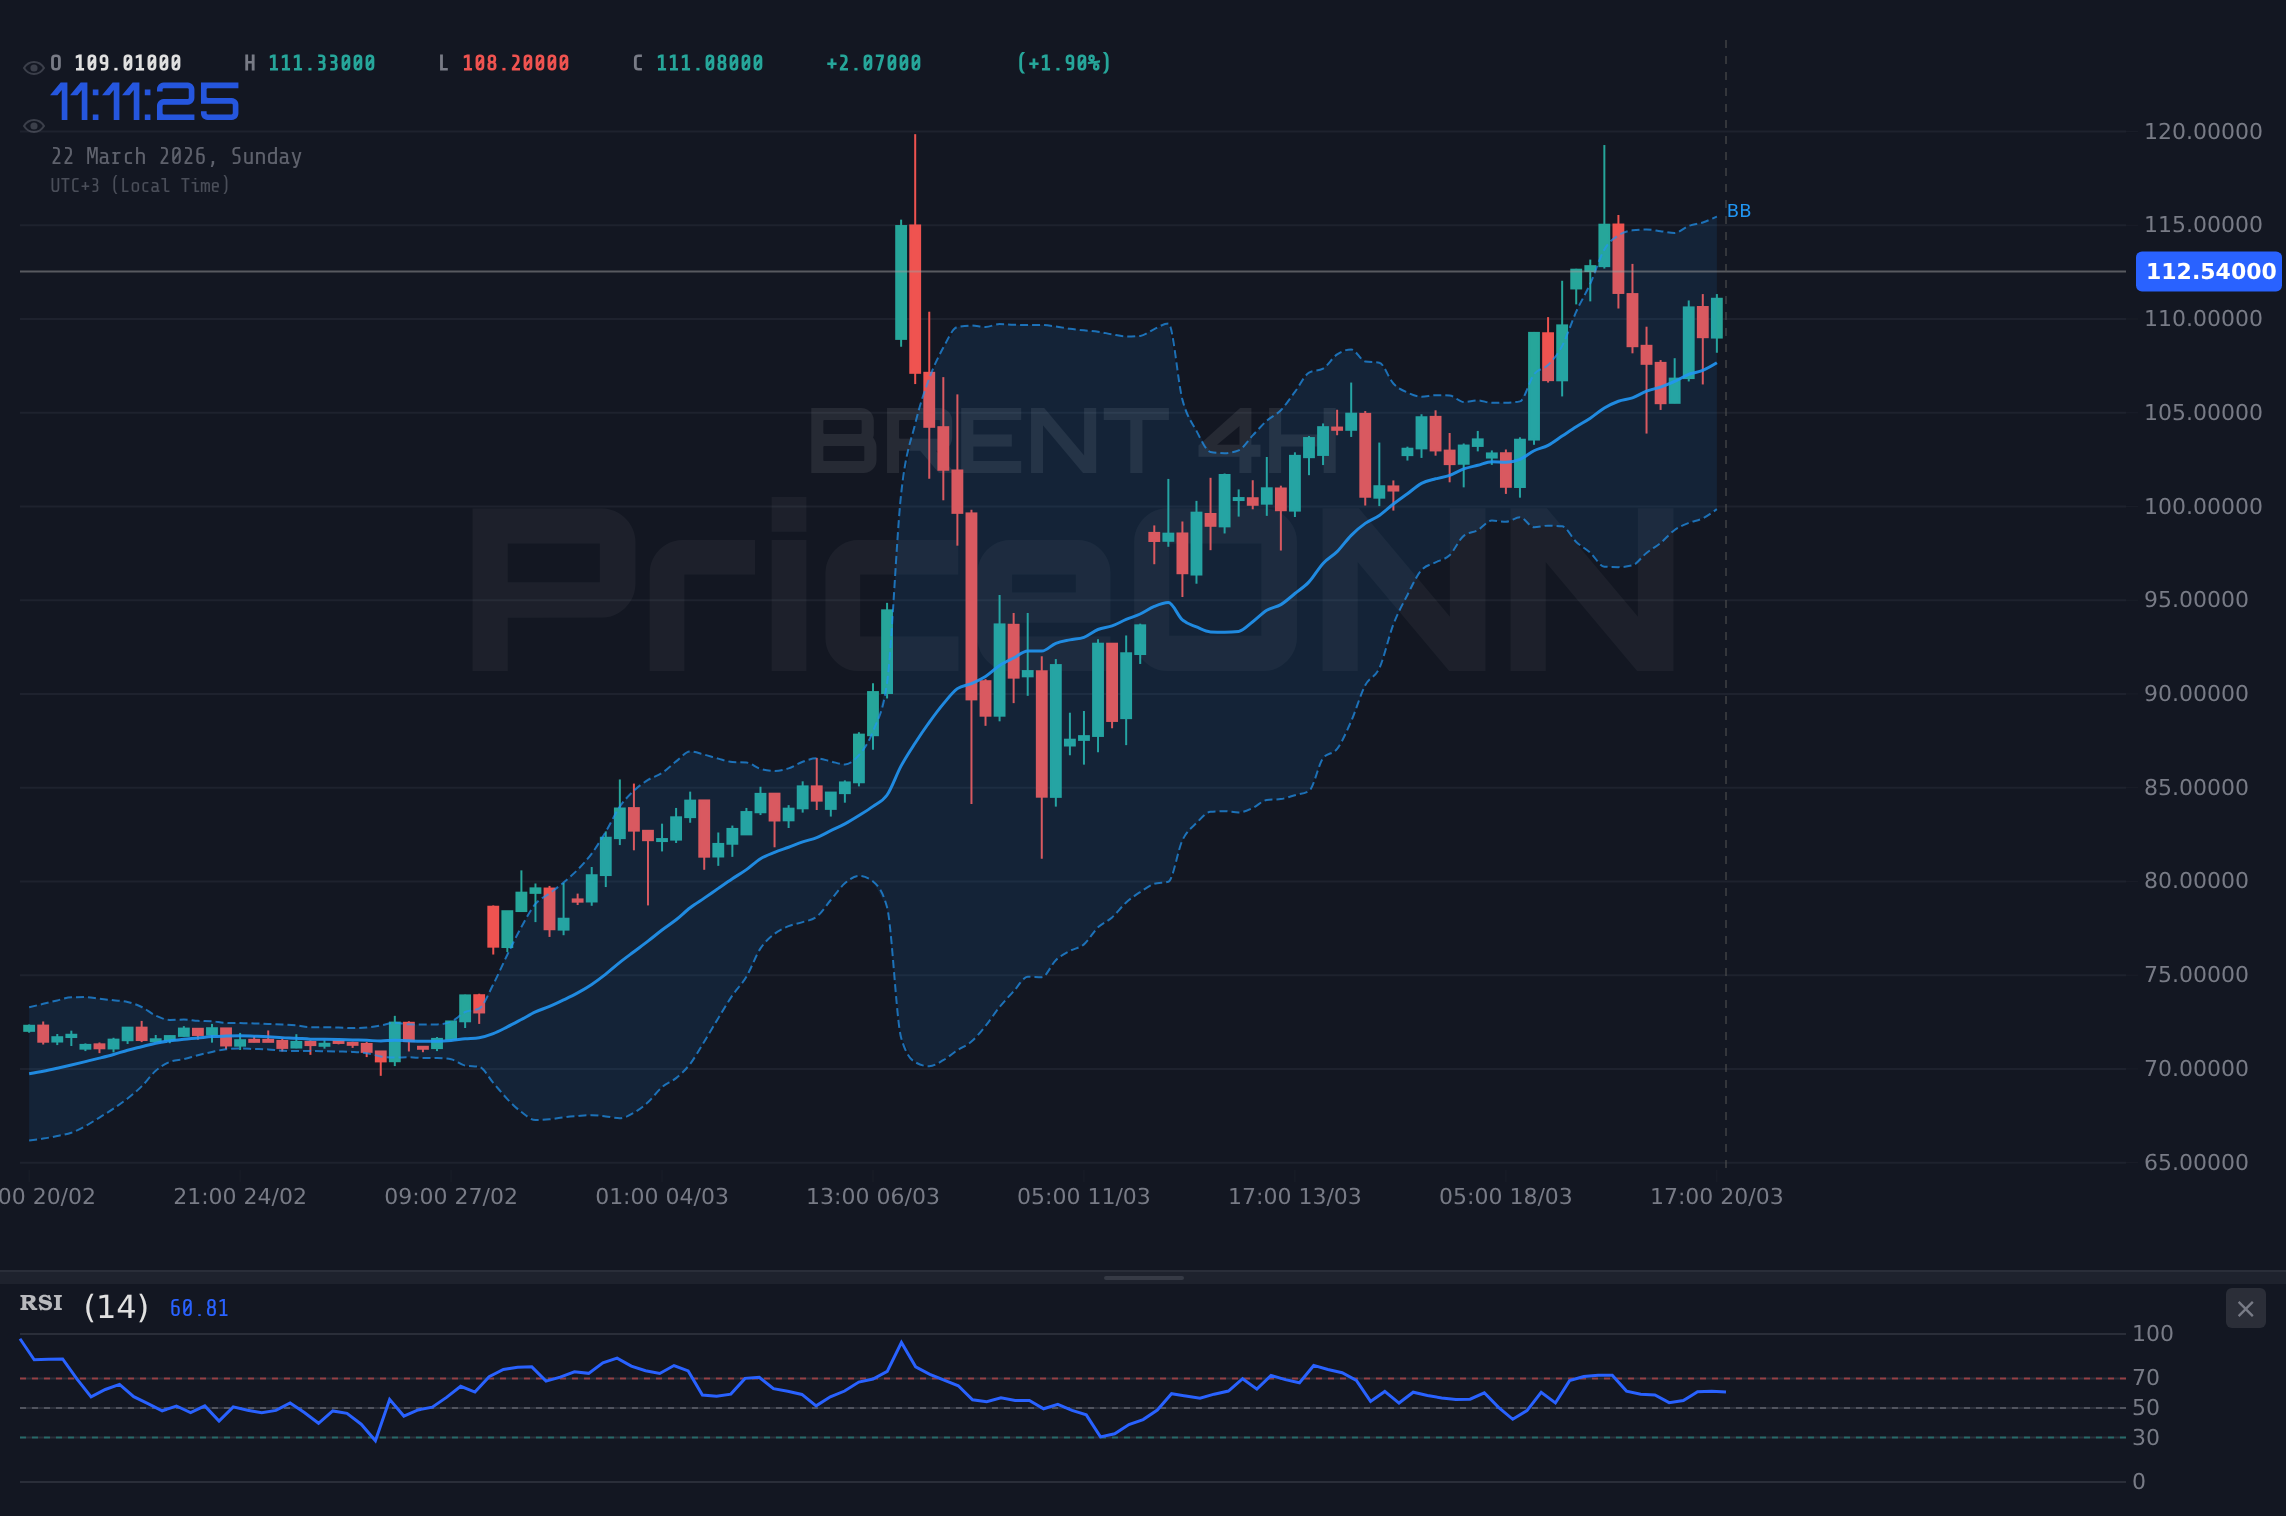
Last week, BRENT crude staged a remarkable ascent, decisively breaking the $112.54 mark and closing near the week's highs. This surge wasn't a mere blip; it was a powerful statement from the oil market, driven by a confluence of escalating geopolitical risks and robust demand indicators that have pushed prices to levels not seen in months. As traders eye the next move, the critical question is whether this momentum is sustainable or if current levels represent a peak before a potential pullback. The narrative of a global gas glut has been shattered, replaced by concerns over supply disruptions, particularly following the recent attack on Qatar's Ras Laffan energy hub. This event, alongside ongoing tensions in the Middle East, has undeniably shifted market sentiment, highlighting the fragility of energy supply chains in a world already grappling with inflationary pressures and the insatiable energy demands of the AI boom.
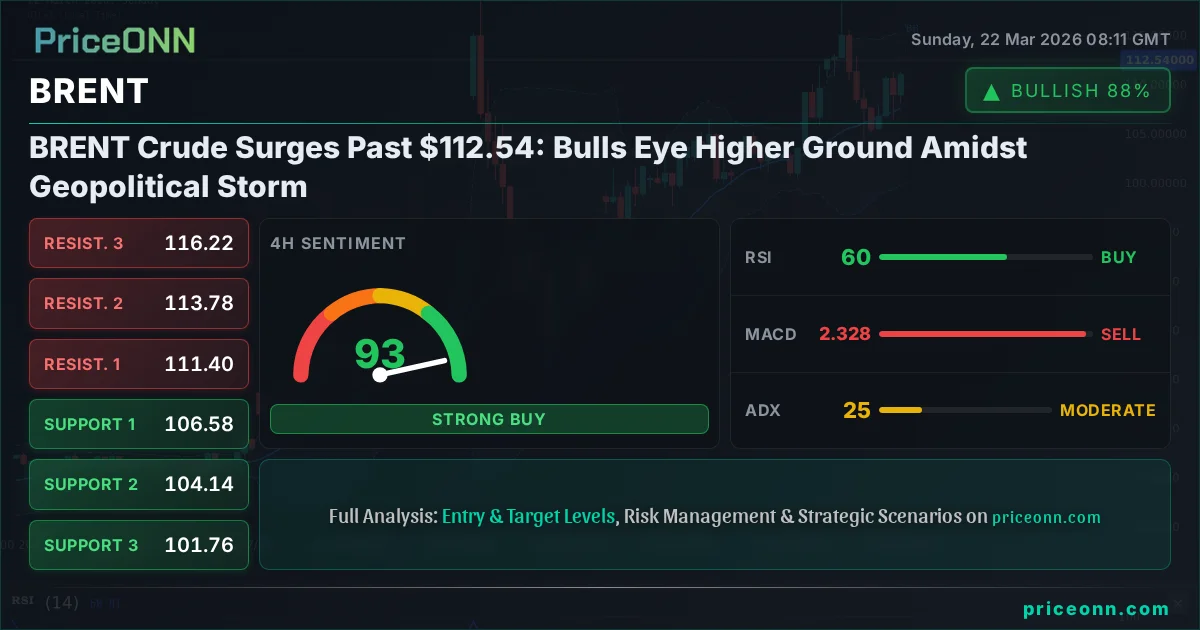
- BRENT crude closed the week at $112.54, marking a significant upward move driven by geopolitical tensions and strong demand.
- Critical resistance is now seen around $116.63, while the immediate support lies at $111.06, tested during the past week.
- The ADX at 24.95 on the 4H chart indicates a moderate trend, suggesting further upside potential if key levels are breached.
- The widening Brent-WTI spread, exacerbated by Middle East supply concerns, is a key factor supporting BRENT's relative strength.
The energy landscape is undeniably volatile, and last week provided a stark reminder of this. BRENT's impressive rally past $112.54 wasn't an isolated event; it occurred within a broader context of shifting market dynamics. Geopolitical tensions in the Middle East, particularly the incident at Qatar's Ras Laffan energy hub, have reignited fears of supply disruptions. This, coupled with persistent global demand, especially from the burgeoning AI sector's appetite for power, has created a perfect storm for oil prices. We're moving away from the 'gas abundance' narrative and squarely into an era where supply security is paramount. This shift is palpable in the market's reaction, with traders pricing in a higher risk premium for crude.
Looking at the broader market correlations, the Dollar Index (DXY) has shown some mixed signals, but its overall strength typically exerts downward pressure on commodities like BRENT. However, the current geopolitical premium seems to be overriding typical inverse relationships. The S&P 500 and Nasdaq, acting as risk appetite barometers, have experienced pullbacks. This risk-off sentiment would normally favor safe-haven assets and potentially weigh on oil, but the specific supply-side risks dominating the energy complex are proving to be a stronger driver. This divergence is key: while broader markets might signal caution, the specific supply fears in oil are creating a unique bullish environment.
The narrative surrounding oil supply has undergone a significant transformation recently. What was once a discussion about a potential global LNG glut has rapidly pivoted to concerns over actual supply availability. The attack on the Ras Laffan energy hub in Qatar, a major global LNG export facility, has dramatically altered this outlook. This incident underscores the vulnerability of critical energy infrastructure and has sent ripples through the market, prompting a reassessment of supply security. It's a potent reminder that geopolitical stability is a fragile foundation upon which global energy markets are built. The implications are clear: any disruption, real or perceived, can trigger significant price volatility, especially when demand remains robust.
The AI Energy Demand Factor
The insatiable hunger for energy driven by the artificial intelligence revolution cannot be overstated. Massive data centers, the backbone of AI, require colossal amounts of electricity. This escalating demand is straining existing power grids and forcing a re-evaluation of energy sources. While nuclear power is gaining traction as a stable, low-carbon option, and discussions around fusion intensify, the immediate demand is still largely met by existing fossil fuel infrastructure. This underlying demand trend provides a structural tailwind for oil prices, ensuring that even minor supply-side shocks can have an outsized impact. The Alaskan oil bonanza, with record lease sales, signals renewed investor confidence in oil production, but this is a longer-term play and does little to alleviate immediate supply concerns driven by geopolitical events.
Technical Picture: BRENT at the Crossroads
From a technical standpoint, BRENT crude closed last week at $112.54, a significant level that marked a decisive move past prior resistance. On the 1-hour timeframe, the trend is showing strong downward momentum (91% strength), but the ADX at 31.58 indicates a strong trend, which, when combined with the RSI nearing oversold territory (29.46), suggests a potential for a reversal or at least a pause. However, the 4-hour chart paints a more definitive picture of strength, with a 100% trend strength and an extremely high ADX of 62.89, indicating a very strong downtrend that has been in place. Yet, the RSI here is deeply oversold at 19.3, hinting at a potential for a sharp snap-back rally. The stochastic oscillators on both the 1H and 4H charts are deeply in oversold territory, further supporting the idea of a potential short-term bounce.
The daily chart, however, presents a more neutral picture (50% trend strength) with an ADX of 19.51, signifying a weaker trend and potentially more range-bound conditions or the early stages of a new trend. The RSI at 29.67 on the daily is also deeply oversold, aligning with the shorter timeframes and suggesting that a confluence of oversold conditions across multiple timeframes might be building. This presents a classic dilemma for traders: do you bet on the continuation of the strong downtrend indicated by the higher ADX values on shorter timeframes, or do you anticipate a reversal based on the deeply oversold indicators across all charts? The current price of $112.54 sits precariously between these signals, making immediate entry decisions challenging without further confirmation.
The MACD indicator across all timeframes shows negative momentum, with the MACD line below the signal line. This suggests that while the price might be oversold, the underlying momentum still favors sellers in the short term. However, the extreme readings on the RSI and Stochastic oscillators cannot be ignored. These indicators often precede significant price reversals. The Bollinger Bands on the daily chart are also showing the price trading below the lower band, a condition often associated with oversold markets or the potential for a mean reversion move back towards the middle band. The key takeaway here is the conflict between the strong trend strength indicated by ADX on shorter timeframes and the deeply oversold conditions across all timeframes. This suggests that while the downtrend has been powerful, the market may be ripe for a significant correction or bounce.
Navigating the Brent-WTI Spread Dynamics
A crucial element influencing BRENT's performance is its spread against West Texas Intermediate (WTI). Recent market news highlights a sharp widening of this spread, with BRENT outpacing WTI, particularly amidst Middle East tensions. This divergence is significant because it suggests that the specific supply risks affecting global benchmarks like BRENT (which is more sensitive to international disruptions) are currently outweighing factors influencing the more domestically focused WTI. The restart of oil exports from Iraq and Kurdistan, while potentially adding supply, seems to be having a muted impact on BRENT's upward trajectory, underscoring the market's focus on immediate geopolitical threats rather than longer-term supply increases.
The price action shows BRENT surging past $114 at points last week, while WTI lagged, creating an 11-year high in the spread. This suggests a 'flight to quality' or, more accurately, a 'flight to perceived supply security' in the global oil market. Traders are willing to pay a premium for crude perceived to be less vulnerable to immediate geopolitical disruptions. This dynamic directly impacts BRENT's price, providing it with a supportive undercurrent. Understanding this spread is vital for traders aiming to capitalize on the nuances of the oil market. The fact that BRENT is climbing while WTI lags indicates that the market is pricing in a global risk premium, not just a regional one.
The implications of this widening spread are multifaceted. It suggests that global demand remains robust, and the market is actively discounting potential future supply disruptions. While some analysts might point to increased production from Alaska or the potential for increased output from various regions, the immediate fear premium embedded in BRENT's price is hard to ignore. This premium is a direct response to the current geopolitical climate, where any escalation in the Middle East or disruptions to major export hubs can have swift and severe consequences on global oil availability. The market is essentially 'pricing for risk' more aggressively than it has in recent memory.
The Week Ahead: Levels to Watch and Potential Scenarios
As we look towards the upcoming week, the $112.54 level for BRENT crude now acts as a key pivot. A sustained hold above this price could encourage further upside, targeting the immediate resistance at $114.02. If this level is breached with conviction, especially with increased volume, the next significant hurdle would be $115.10, and potentially the psychologically important $116.63 level. These resistance levels are where we might see profit-taking or a temporary stall in the upward momentum, especially if broader market sentiment shifts towards risk aversion.
Conversely, a failure to hold above $112.54 could see a retracement towards the support at $111.06. A break below this level would invalidate the immediate bullish outlook and could open the door for a more significant pullback towards $109.18 and subsequently $108.10. The ADX on the 4-hour chart remains very high at 62.89, indicating that the current trend, whether up or down, has significant strength. This means that if a breakout occurs above resistance, the move could be sharp and swift. Similarly, a breakdown below support could lead to a rapid decline.
The daily chart's ADX of 19.51 suggests that the longer-term trend might be consolidating or just beginning. This could mean that the current upward move is the start of a new trend, or it could be a sharp counter-trend rally within a broader sideways or even downward phase. The oversold conditions across all timeframes are a significant factor. A bounce from these levels is technically plausible. However, the geopolitical backdrop remains the dominant theme. Any significant escalation or de-escalation in the Middle East will likely dictate the direction more than technical indicators alone.
Bearish Scenario: Profit-Taking & Geopolitical De-escalation
25% ProbabilityNeutral Scenario: Consolidation Around Key Levels
40% ProbabilityBullish Scenario: Supply Shock Continues
35% ProbabilityThe Role of Central Banks and Macroeconomic Data
While geopolitical events currently dominate the oil market narrative, macroeconomic factors and central bank policies remain critical underlying drivers. The Federal Reserve's stance on interest rates, for instance, continues to influence the DXY and, by extension, commodity prices. If the Fed maintains a hawkish tone or hints at further tightening, it could strengthen the dollar, potentially capping oil price gains. Conversely, any indication of a pause or pivot could support commodities. We are seeing mixed signals from Fed officials, with some emphasizing the persistence of inflation while others acknowledge the need for caution given the current economic climate. Traders will be closely watching employment data and inflation reports for clues on the Fed's next move.
The impact of AI-driven energy demand is also a structural factor that central banks must consider. While their primary mandate is price stability, the long-term implications of energy security and the transition to cleaner sources are becoming increasingly relevant. The current geopolitical situation, which is driving up oil prices, also adds to inflationary pressures, complicating the central banking calculus. This creates a feedback loop: higher energy prices can fuel inflation, prompting tighter monetary policy, which could theoretically dampen demand, but the current supply-side shock is proving more potent. The market's reaction to upcoming economic data releases will be crucial in determining whether these macro forces can counteract the immediate bullish impetus in oil.
The recent record-breaking lease sale in Alaska's National Petroleum Reserve, generating $163.7 million, signals renewed investor confidence in oil production. However, this is a long-term play and does not address the immediate supply concerns stemming from the Middle East. The market is currently pricing in a significant risk premium, driven by fears of further disruptions. This premium is not easily erased by long-term production increases. It highlights the ongoing tension between the structural demand growth, particularly from AI, and the persistent supply-side vulnerabilities, both geopolitical and operational.
Market Sentiment and Risk Appetite
Market sentiment surrounding BRENT crude has clearly shifted towards a 'risk-on' stance for the commodity itself, despite broader market pullbacks. The fear of supply shortages is overriding typical risk-off behavior that would favor safe-haven assets over commodities. This is evident in the strong upward momentum observed, even as equity indices like the S&P 500 and Nasdaq have seen declines. Traders are differentiating between the specific risks in the energy sector and the general market risk appetite. The technical indicators, particularly the deeply oversold readings on RSI and Stochastic across multiple timeframes, suggest that the market is anticipating a potential bounce or reversal, which could be amplified if geopolitical tensions continue to simmer or escalate.
The ADX values, especially the extremely high readings on the 4-hour chart (62.89), indicate that the recent move, while potentially oversold, has been exceptionally strong. This suggests that any reversal could also be sharp. The key will be to watch how price action behaves around the critical levels of $111.06 (support) and $114.02 (resistance). A decisive break above $114.02, particularly with increasing volume, would signal a continuation of the bullish momentum, potentially targeting $115.10 and beyond. Conversely, a failure to hold $112.54 and a subsequent break below $111.06 would likely trigger stop-losses and could lead to a more significant retracement, testing the $109.18 support level. The market is currently at a critical juncture, and the next few trading sessions will be pivotal in determining the short-to-medium term direction.
The resilience shown by BRENT crude in the face of broader market weakness is a testament to the powerful supply-side narrative currently at play. The Middle East remains the primary focus, and any news from that region will likely be the dominant catalyst. The market's interpretation of these events - whether they are perceived as short-term disruptions or long-term threats to supply - will heavily influence price action. Given the deep oversold conditions on shorter timeframes, a short-term bounce is technically plausible, but the sustainability of any rally will depend on the geopolitical situation and continued robust demand, particularly from the AI sector.
Frequently Asked Questions: BRENT Analysis
What happens if BRENT crude breaks above the $115.10 resistance level?
If BRENT crude decisively breaks above the $115.10 resistance level, especially with strong volume and positive geopolitical news, it could signal a continuation of the bullish trend. The next key target would likely be the $116.98 resistance, and potentially higher if market sentiment remains strongly bullish and supply concerns persist.
Is the current BRENT price of $112.54 a good entry point given the oversold RSI?
While the RSI is deeply oversold across multiple timeframes (around 29.46 on 1H, 19.3 on 4H, and 29.67 on 1D), entering at $112.54 carries risk due to the strong downtrend momentum indicated by ADX. A more conservative approach would be to wait for confirmation, such as a close above $114.02 or a clear bullish reversal pattern forming.
How does the widening Brent-WTI spread impact BRENT's price outlook?
The widening Brent-WTI spread, currently at an 11-year high, indicates that global oil supply risks are being priced more aggressively into BRENT than into WTI. This suggests a premium for supply security in the international market, providing a supportive underpinning for BRENT prices, even amidst broader market volatility.
How will potential Fed rate decisions influence BRENT prices this week?
Any hawkish signals from the Fed regarding interest rates could strengthen the US Dollar (DXY), potentially capping oil price gains. Conversely, a dovish stance or signs of a rate pause could support commodities like BRENT. Traders should monitor upcoming Fed commentary and economic data for clues on monetary policy direction.
Technical Outlook Summary
| Indicator | Value | Signal | Interpretation |
|---|---|---|---|
| RSI (14) | 29.46 | Oversold | Suggests potential for bounce, but confirms strong selling pressure. |
| MACD Histogram | -15.20 | Negative Momentum | Sellers remain in control on shorter timeframes. |
| Stochastic | K=13.94, D=13.99 | Oversold | Extreme oversold readings across timeframes increase bounce probability. |
| ADX | 31.58 | Strong Trend | Indicates significant trend strength on 1H, requires caution for counter-trend trades. |
| Bollinger Bands | $4501.45 | Below Lower Band | Price trading below the lower band signals oversold conditions or a strong downtrend. |
Key Levels to Watch
Support Levels
Resistance Levels
Track markets in real-time
AI-powered analysis, technical indicators and real-time price data.
Join Our Telegram Channel
Breaking market news, AI analysis and trading signals instantly.
Join Channel