The specter of stagflation, a chilling economic scenario combining stagnant growth with high inflation, has returned to haunt global markets. Nowhere is this more evident than in the energy complex, where BRENT crude oil has not only breached the psychological $100 per barrel mark but has now rocketed to $110.33. This dramatic surge, fueled by a confluence of geopolitical tensions and persistent inflationary undertones, is forcing investors and policymakers alike to re-evaluate their strategies. The question on everyone's mind is no longer just about supply disruptions, but about the broader economic implications of oil prices at these elevated levels. Can the global economy withstand such a shock, or are we on the cusp of a significant downturn exacerbated by soaring energy costs? This analysis delves into the multifaceted drivers behind BRENT's ascent, its correlation with other major markets, and the critical technical levels that traders and investors must monitor in the coming week.
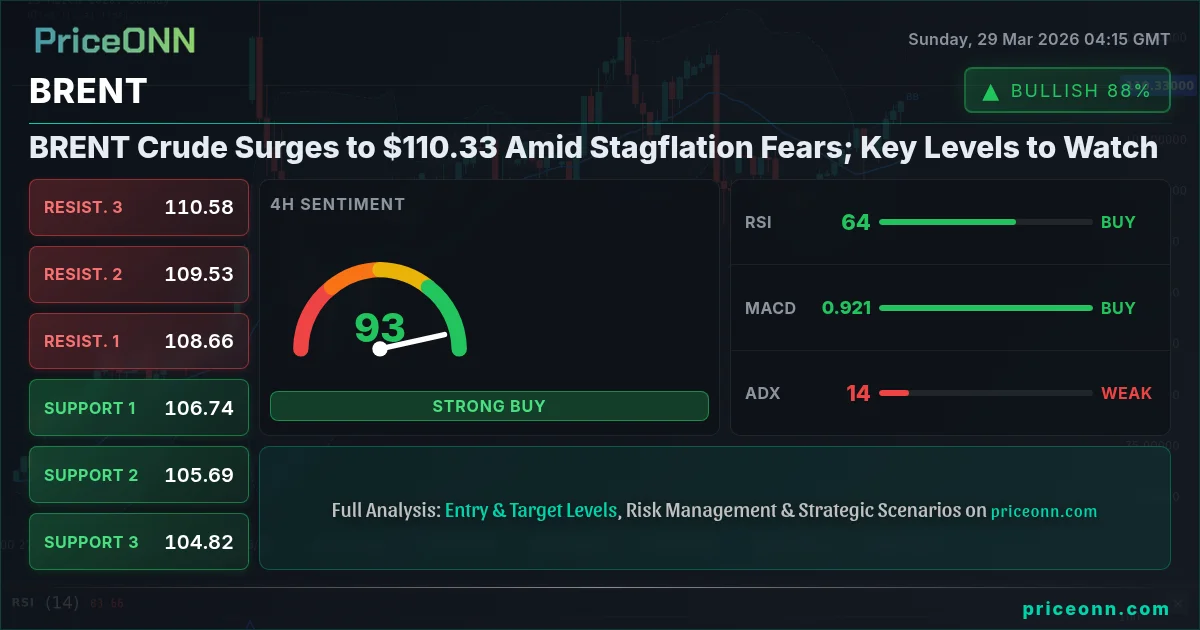
- BRENT crude oil is trading at $110.33, reflecting a sharp 6.48% daily gain.
- Stagflationary fears are intensifying, driven by rising oil prices and Treasury yields, impacting global risk appetite.
- Key support for BRENT is identified at $108.01, with immediate resistance looming at $110.77.
- The ADX indicator at 14.32 suggests a ranging market, but the strong daily trend and RSI at 69.18 indicate upward momentum.
The surge in BRENT crude past $110.33 is more than just a price movement; it's a potent signal of underlying economic anxieties. Recent news reports, including those from Reuters and Bloomberg, have highlighted the growing concern over a potential resurgence of 1970s-style stagflation. This economic malaise, characterized by a toxic mix of sluggish economic growth and runaway inflation, is precisely the kind of environment that chills investment and consumer spending. The escalating geopolitical turmoil in the Middle East, a region critical for global oil supply, has undoubtedly played a pivotal role. Reports suggest the International Energy Agency (IEA) is raising alarms about potential global energy shortages, a narrative that naturally pushes oil prices higher. Furthermore, the surprising hesitancy of U.S. oil producers to ramp up expansion, despite soaring prices, suggests that supply-side responses may be muted, further supporting the bullish case for oil in the short to medium term. This delicate balance between demand, supply, and geopolitical risk creates a volatile environment, making BRENT's price action a crucial barometer for the global economic health.
Navigating the Stagflationary Storm: Intermarket Correlations
Understanding BRENT's trajectory requires looking beyond the oil markets themselves and examining its intricate relationship with other major asset classes. The Dollar Index (DXY), currently trading around 99.79, often moves inversely to commodities like oil. A strengthening dollar can act as a drag on oil prices by making it more expensive for holders of other currencies. However, the current narrative is more complex. While the DXY shows a bullish trend with an ADX of 31.93 on the daily chart, indicating strong upward momentum, its correlation with oil might be temporarily weakened by the overriding stagflationary fears. Investors seeking a hedge against inflation are increasingly turning to commodities, including oil, regardless of dollar strength. This dynamic is further amplified by the performance of U.S. equities. The S&P 500, trading at 6355.66, and the Nasdaq 100 at 23076.09, have both experienced significant daily drops of over 2% and 2.3% respectively. This decline in risk appetite typically signals a move towards safe-haven assets. While gold often benefits, the current inflationary environment, coupled with geopolitical risk, also supports oil as a potential inflation hedge. The interplay between rising Treasury yields, which signal inflation expectations and tighten financial conditions, and the demand for inflation-protected assets like oil, creates a complex web of correlations that traders must meticulously unravel.
The correlation analysis extends to the bond market as well. Rising Treasury yields, a common feature during periods of elevated inflation expectations, can increase the cost of capital for businesses and consumers, potentially dampening economic growth. This is the crux of the stagflationary dilemma: rising prices coupled with slowing economic activity. For oil, higher yields can present a mixed bag. On one hand, they reflect inflationary pressures that typically boost commodity prices. On the other hand, they signal tighter monetary policy and potentially slower future demand, which could cap oil prices. The current market data shows ADX indicators for major indices like SP500 and Nasdaq at 47.68 and 45.07 respectively on the daily timeframe, indicating strong downward trends. This risk-off sentiment could, paradoxically, support oil prices if it's driven by supply-side shocks (like Middle East conflict) rather than purely demand destruction. The narrative is crucial here: is the market selling equities because of inflation fears, or because of an impending global slowdown? The former scenario often benefits commodities like BRENT, while the latter spells trouble for all risk assets.
When analyzing BRENT, always consider the DXY's trend strength (ADX > 25) and the SP500's daily volatility. A strong DXY and a sharp equity sell-off often create a 'risk-off' environment that can either boost oil prices (if supply-driven) or crush them (if demand-driven).
Technical Picture: A Divergence of Signals?
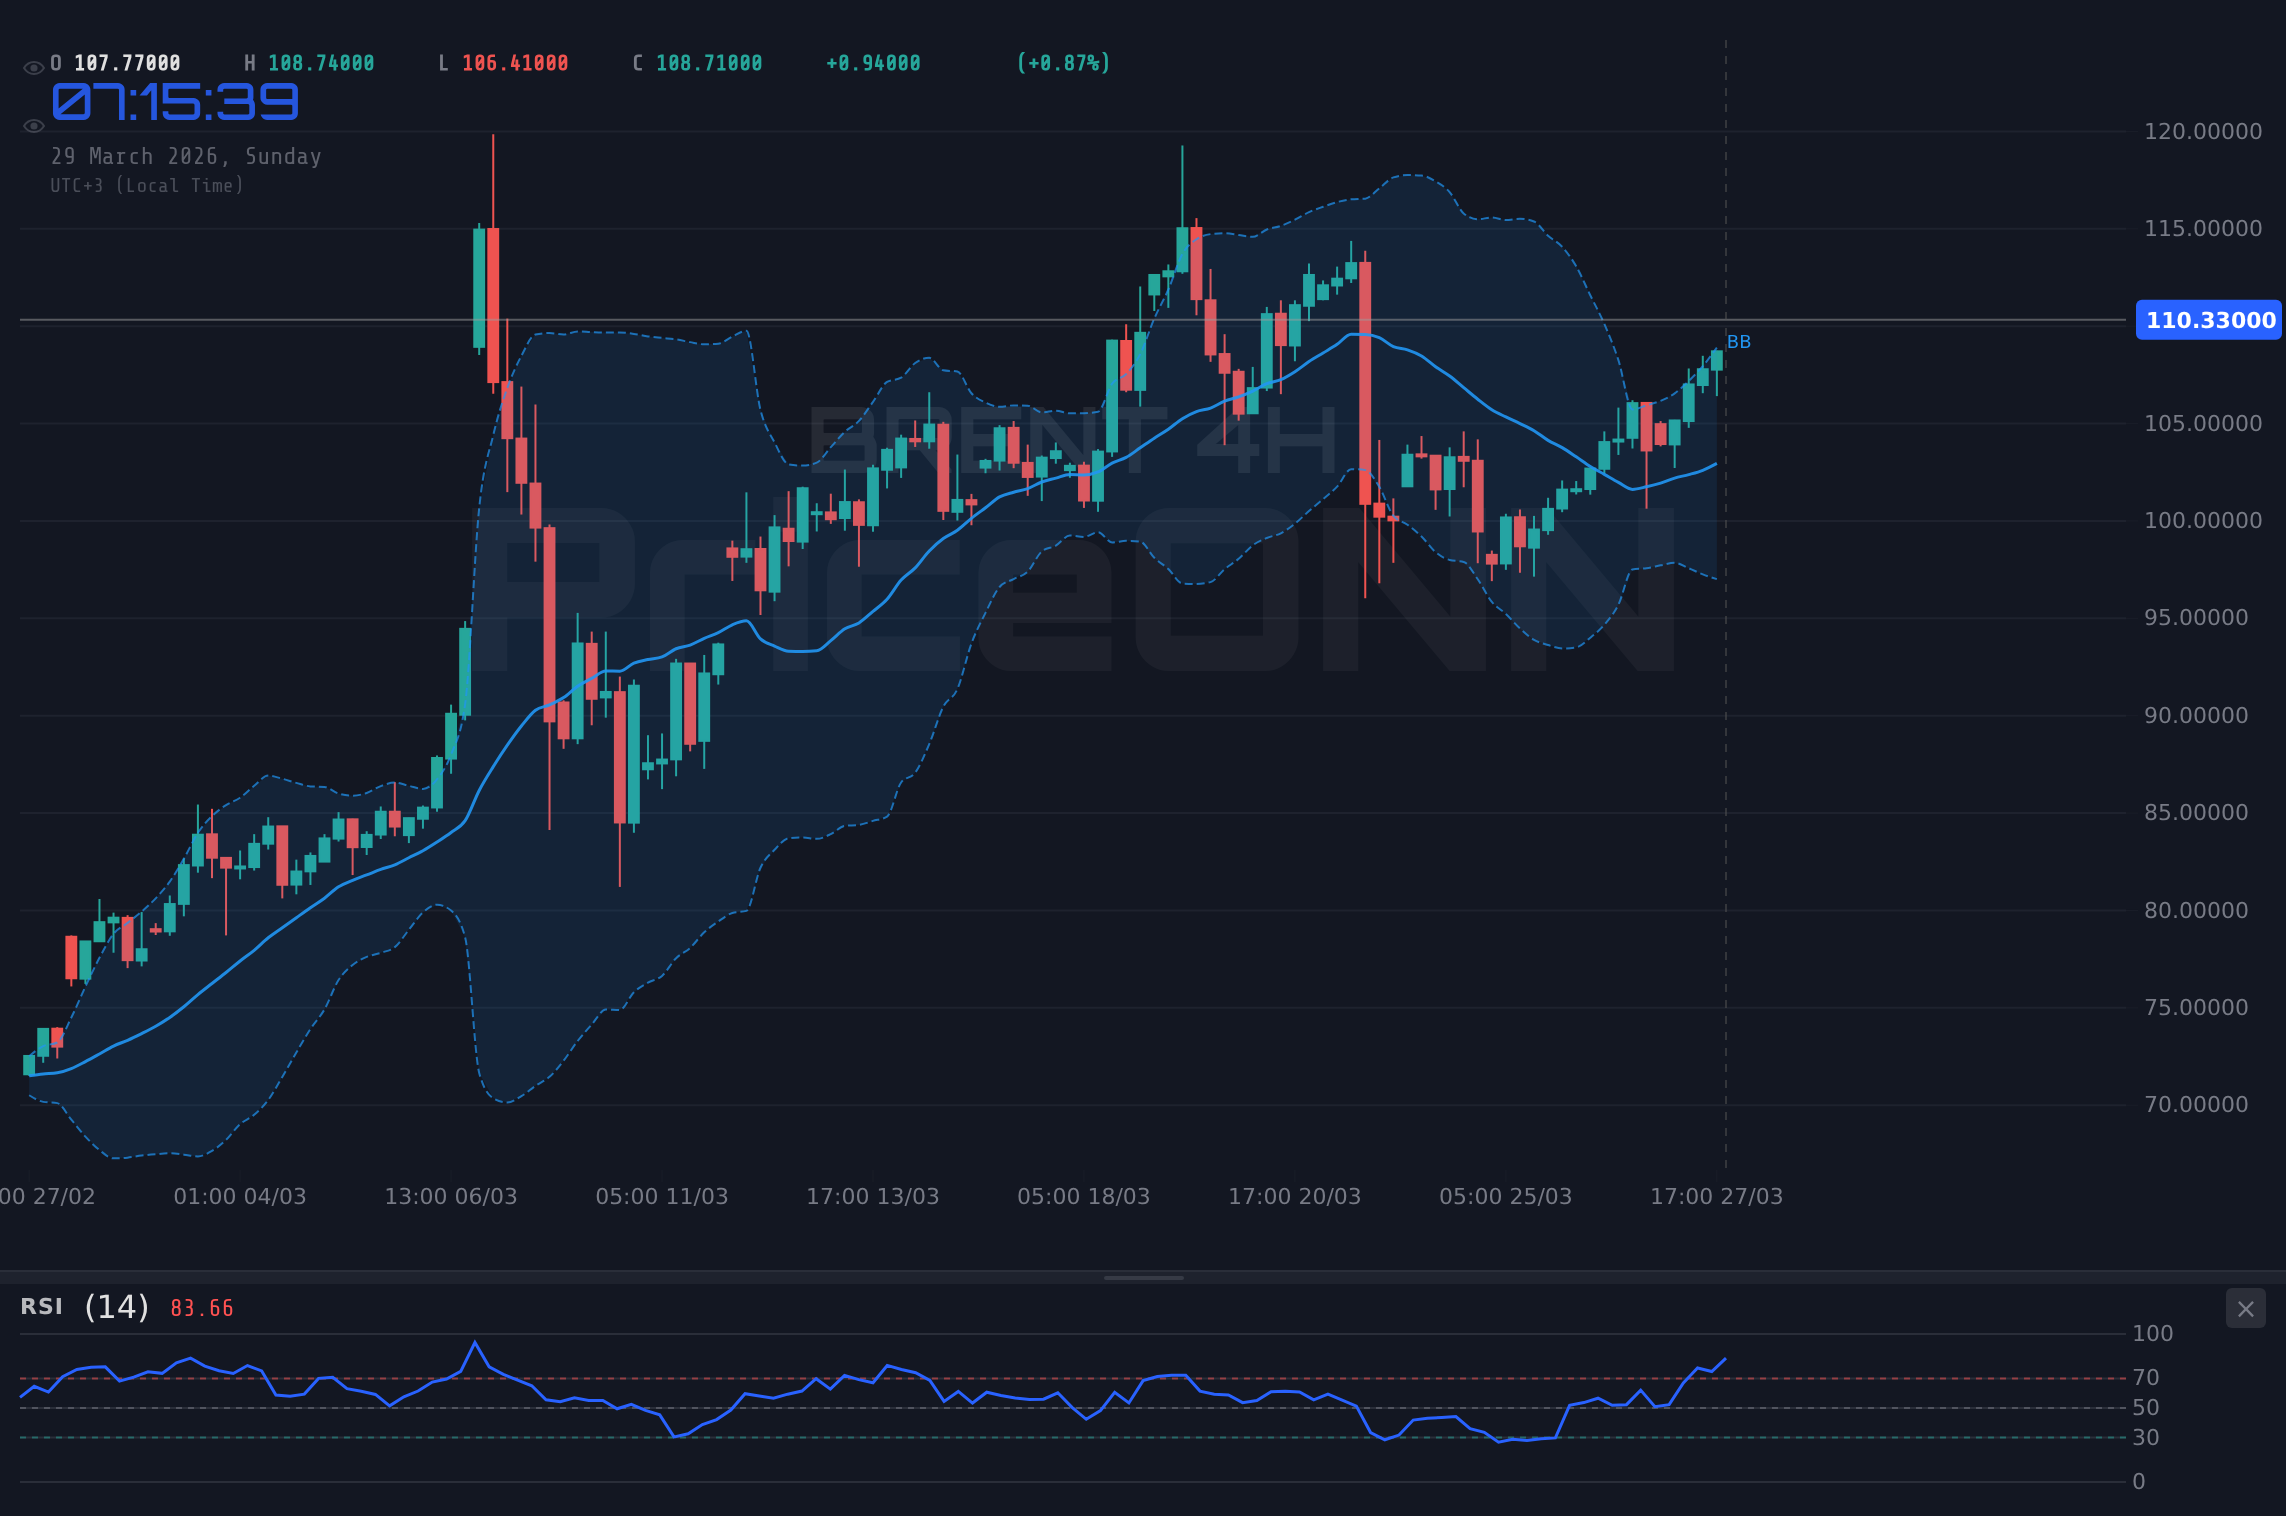
From a technical standpoint, BRENT crude presents a fascinating, albeit complex, picture. The daily chart shows a strong upward trend, evidenced by the ADX reading of 62.63 – a level indicating a very strong trend. The RSI(14) at 69.18 is comfortably in the upper range, suggesting bullish momentum, though it's not yet in the extreme overbought territory that might signal an imminent reversal. However, the Stochastic indicator on the daily chart (K=39.39, D=46.4) shows a bearish signal as %K has crossed below %D, hinting at potential cooling momentum. This divergence between the RSI's bullish lean and the Stochastic's bearish cross is a classic sign of caution.
Zooming into the shorter timeframes reveals further nuances. On the 1-hour chart, the trend is classified as strong (Power: 95%) and bullish, with an RSI of 78.32 – firmly in overbought territory. This suggests that the immediate upward push might be facing sellers. The MACD is positive, and the price is trading above the middle Bollinger Band, reinforcing the short-term bullish bias. However, the Stochastic on the 1H chart (K=89.61, D=85.89) is also in extreme overbought conditions, indicating a potential for a short-term pullback. This is where the ADX reading of 19.28 becomes important; it signifies a weak trend on the 1-hour timeframe. This implies that the current bullish momentum might lack the conviction for a sustained breakout, making it susceptible to sharp reversals. For scalpers and short-term traders, the overbought indicators on the 1H chart suggest caution against chasing the rally higher without further confirmation or a retracement.
The 4-hour timeframe offers a slightly different perspective. The trend is currently classified as neutral (Power: 50%), but the ADX at 14.32 indicates a weak trend, suggesting choppy or ranging conditions. This is a critical observation for swing traders. While the daily trend is strong, the 4-hour ADX suggests that the market may be consolidating before the next major move. The RSI here is at 64.46, in the neutral zone but trending upwards, while the Stochastic (K=93.27, D=82.7) is deeply overbought, mirroring the 1-hour chart's warning signs. This conflict across timeframes – a strong daily trend, but weak and overbought signals on shorter frames – highlights the importance of patience. It suggests that while the long-term bias might be bullish, the path higher could be volatile, with significant pullbacks possible before any sustained rally resumes. The current price of $110.33 sits just below the 4-hour resistance of $110.77, making this level a crucial short-term pivot point.
The divergence between the daily RSI (69.18) and the daily Stochastic (K=39.39, D=46.4) is a key warning sign. While the price is making new highs, the underlying momentum might be weakening, suggesting that the current rally could be vulnerable to a correction, especially if key support levels fail.
Geopolitical Tensions and Supply Shocks: The War Premium
The most significant driver behind BRENT's recent surge is undoubtedly the escalating geopolitical risk premium. The Middle East, a region that supplies a substantial portion of the world's crude oil, is once again at the center of global security concerns. Reports from outlets like CNBC and the Financial Times have detailed heightened tensions, raising fears of potential supply disruptions. Whether it's direct conflict, sanctions, or disruptions to shipping routes like the Strait of Hormuz, any instability in this region has an immediate and pronounced effect on oil prices. The IEA's warnings about potential energy shortages are not merely speculative; they are based on the real possibility of production cuts or export blockades. This uncertainty creates a 'fear premium' in the oil market, where prices rise not just on current supply-demand fundamentals, but on the anticipation of future shortages. This premium can be notoriously volatile, adding another layer of complexity for traders attempting to price BRENT accurately. The market's reaction demonstrates that in an environment already grappling with inflation, any threat to energy supply is amplified, leading to rapid price increases.
Furthermore, the broader geopolitical landscape contributes to this risk-on sentiment for commodities. The ongoing conflict in Eastern Europe continues to cast a shadow over global energy markets, particularly impacting European energy security. While sanctions and market adjustments have somewhat mitigated the immediate impact compared to the initial shock, the underlying vulnerability remains. This prolonged uncertainty keeps a baseline level of support under oil prices. Additionally, broader geopolitical friction, such as U.S.-China relations or other regional conflicts, can indirectly influence oil markets by affecting global trade, economic growth expectations, and overall risk sentiment. When investors perceive a higher global risk environment, they often flock to tangible assets like oil and gold as perceived safe havens or inflation hedges, pushing their prices up. The current price of $110.33 for BRENT reflects not just the immediate supply concerns but also the broader geopolitical instability that makes future supply projections highly uncertain.
The market is pricing in a significant geopolitical risk premium. Any escalation in the Middle East or Eastern Europe could easily push BRENT prices towards $120 or higher, while de-escalation could lead to a sharp correction.
- Energy Market AnalystEconomic Undercurrents: Inflation, Rates, and Growth Pains
The surge in BRENT crude is intrinsically linked to the broader macroeconomic environment, particularly inflation dynamics and central bank policies. As highlighted in recent market news, the resurgence of stagflationary fears is a major concern. Rising oil prices directly contribute to inflation across the economy, impacting transportation costs, manufacturing, and consumer goods. This feeds into broader inflation metrics like CPI and PPI. The current economic calendar shows mixed signals. While some past USD data points like the 'Actual: 210 | Forecast: 211 | Previous: 205' suggest a slight cooling in certain sectors, the persistent upward pressure from energy costs cannot be ignored. The challenge for central banks, such as the Federal Reserve and the European Central Bank (ECB), is immense. They are caught between trying to tame inflation, which would typically involve raising interest rates, and the risk of exacerbating an economic slowdown. The current Treasury yields, reflected in the rising DXY and strong ADX on daily charts, indicate that markets are pricing in this inflationary pressure and potentially a more hawkish stance from central banks, or at least a prolonged period of higher rates.
This environment creates a delicate balancing act. Higher interest rates increase borrowing costs, which can dampen economic activity and, consequently, oil demand. However, if the primary driver of inflation is supply-side shocks, like those seen in the energy markets due to geopolitical events, then simply raising rates might not be effective in controlling prices and could instead worsen stagflation. The market's reaction to upcoming economic data releases, such as any scheduled for EUR or GBP, will be crucial. For instance, if upcoming inflation figures come in hotter than expected, it could further solidify stagflation concerns, potentially leading to more aggressive monetary tightening and a demand slowdown. Conversely, signs of cooling inflation or weakening economic growth could lead to expectations of rate cuts, which might provide some relief to commodity prices. The BRENT price of $110.33 is currently trading in a range where it significantly impacts inflation forecasts, making it a key variable in central bank decision-making. The interplay between energy prices, inflation expectations, and monetary policy remains the dominant theme for the global economy.
The current stagflationary environment presents a lose-lose scenario for central banks. Fighting inflation with higher rates risks recession, while easing policy could fuel even higher inflation. This policy dilemma adds to market uncertainty and volatility, particularly for commodities like BRENT.
Market Sentiment and Trader Psychology
Understanding market sentiment is crucial for interpreting BRENT's price action. The prevailing mood appears to be one of increasing caution, bordering on fear, driven by the stagflation narrative and geopolitical instability. This is reflected in the significant sell-off in equity markets (SP500 and Nasdaq down over 2% daily) and the strengthening DXY. In such an environment, investors often shift from risk-on to risk-off assets. While traditional safe havens like gold might benefit, oil is also finding demand as an inflation hedge, especially when supply-side factors are the primary concern. The RSI on the daily chart, at 69.18, indicates strong upward momentum but is approaching overbought territory, suggesting that the current bullish sentiment might be reaching a fever pitch. However, the ADX of 62.63 on the daily chart signals a very strong trend, implying that momentum could sustain the rally despite overbought conditions on shorter timeframes.
Trader psychology plays a significant role in amplifying price movements. The fear of missing out (FOMO) can drive prices higher during strong rallies, while panic selling can accelerate downturns. Given the conflicting signals across different timeframes – strong daily trend versus overbought conditions and weaker trends on intraday charts – there's a clear division in market sentiment. Short-term traders might be wary of chasing the rally above $110.33 due to overbought indicators, while longer-term investors, focused on the inflation-hedge narrative and geopolitical risks, might see dips as buying opportunities. The ADX reading of 14.32 on the 4-hour chart is particularly telling; it suggests that the market may be consolidating or ranging in the short term, despite the strong daily trend. This means that while the overall direction might be up, the path could be characterized by sharp, unpredictable swings as different trader types react to conflicting signals and news events. Patience and risk management become paramount in such a choppy environment.
What Different Traders Should Watch
For scalpers, the immediate focus is on the 1-hour chart. The overbought Stochastic (K=89.61, D=85.89) and RSI (78.32) suggest looking for short-term pullbacks. A break below the 1-hour support at $108.01 could signal a temporary reversal, offering a shorting opportunity targeting the next support at $107.33. Confirmation would be needed, perhaps a MACD crossover or a break below the 1-hour middle Bollinger Band.
Swing traders should pay close attention to the 4-hour chart and the key level around $110.77 (resistance). A sustained break above this level, confirmed by increased volume and a break of the 4-hour ADX's weak trend signal, could open the door for higher targets. Conversely, failure to break $110.77 and a subsequent fall below the 4-hour support at $108.01 would invalidate the bullish short-term outlook, potentially signaling a move down towards $106.74. The divergence between daily and shorter-term indicators requires careful navigation.
Long-term investors, particularly those focused on inflation hedging, will be watching the broader geopolitical landscape and the sustainability of the stagflationary narrative. For them, the daily chart's strong trend (ADX 62.63) is more relevant. They might view any significant pullbacks towards the $100-$105 range as potential accumulation zones, provided the geopolitical risks remain elevated and inflation continues to be a concern. However, a sustained break below the daily support at $100.77 would signal a significant shift, potentially indicating that demand destruction fears are outweighing supply concerns.
Historical Context: Lessons from the 1970s and Beyond
The current anxieties surrounding stagflation echo the challenging economic conditions of the 1970s. That decade was marked by soaring oil prices, driven by OPEC supply shocks, coupled with persistent inflation and sluggish economic growth. The lessons learned from that era are stark: stagflation is a particularly difficult economic environment to manage. Central banks struggled to combat inflation without triggering deep recessions, and fiscal policy often proved ineffective. The oil shocks of the 1970s led to significant adjustments in energy consumption, investment in alternative energy sources, and a fundamental reshaping of the global energy landscape. While today's circumstances are not identical – globalized markets, different monetary policy tools, and technological advancements play a role – the core challenge of balancing inflation control with growth support remains. The current surge in BRENT crude to $110.33 is a stark reminder of how vulnerable the global economy can be to energy price shocks, especially when inflation is already a concern.
Looking at more recent history, the COVID-19 pandemic and the subsequent supply chain disruptions created a different, yet similarly inflationary, shock. The rapid recovery in demand, coupled with constrained supply, led to a surge in prices across various commodities. While that period was characterized more by demand-pull inflation, the current situation is increasingly leaning towards cost-push inflation, driven by energy and geopolitical factors. This makes the current inflationary environment more stubborn and potentially more damaging to growth. The resilience shown by oil prices, even in the face of global economic headwinds, underscores the critical role of energy supply in maintaining price stability. The fact that BRENT has climbed past $110.33, while major indices are falling, highlights this dichotomy. It suggests that while risk assets are being punished for fear of recession, inflation hedges are being rewarded due to supply concerns and persistent price pressures. Understanding these historical parallels helps contextualize the current market dynamics and the potential risks ahead.
The 1970s stagflation serves as a cautionary tale. The combination of supply shocks (like oil embargoes) and persistent inflation created a difficult economic landscape. Today's rising oil prices and inflation risks suggest that similar challenges, though perhaps in a different form, could be on the horizon if supply issues are not resolved.
Key Levels and Price Action Scenarios for BRENT
The current price action for BRENT crude at $110.33 presents distinct scenarios for traders and investors, heavily dependent on key technical levels and evolving geopolitical news. The daily chart shows a strong upward trend (ADX 62.63), suggesting that the path of least resistance is higher, but the shorter-term indicators are flashing warnings.
Bearish Scenario: Profit-Taking Pressure Mounts
65% ProbabilityNeutral Scenario: Consolidation Around $110
25% ProbabilityBullish Scenario: Upside Momentum Continues
10% ProbabilityThe immediate focus for traders will be on the $108.01 support level on the 1-hour chart. A failure to hold this level, especially with increasing volume and negative news flow, could trigger a cascade of selling as shorter-term traders exit their positions. This would align with the bearish scenario, targeting $107.33 and potentially $106.74. On the other hand, if BRENT can consolidate above $110.33 and eventually push through the 4-hour resistance at $110.77, it would signal a continuation of the bullish trend, potentially opening the path towards the daily resistance level at $111.91. However, given the overbought conditions on shorter timeframes and the weak trend indicated by the 4-hour ADX (14.32), such a breakout would need strong confirmation, likely from a significant geopolitical development or a shift in market sentiment.
The Path Forward: Risks and Opportunities
Looking ahead, the trajectory of BRENT crude will likely remain highly sensitive to geopolitical developments in the Middle East and Eastern Europe, as well as inflation data and central bank policy responses. The current price of $110.33 reflects a significant risk premium, and any de-escalation of tensions could lead to a sharp correction. Conversely, further escalation could propel prices significantly higher, potentially testing levels not seen in years. The battle between supply-driven inflation, which favors higher oil prices, and demand-destruction fears, which would cap them, will continue to dominate market narratives.
For investors and traders, the current environment demands a high degree of caution and strategic positioning. The conflicting signals across different timeframes and indicators suggest a market that is volatile and potentially prone to sharp reversals. Patience is key. Waiting for clear confirmation signals, managing risk diligently, and understanding the broader macroeconomic context are essential for navigating these choppy waters. The potential for stagflation means that traditional correlations may break down, and assets that typically move together might diverge. Therefore, a flexible approach, focusing on price action and confirmed technical levels, will be crucial for identifying opportunities and mitigating risks in the volatile energy markets.
While volatility is high, the strong daily trend and persistent geopolitical risks suggest that dips could present buying opportunities for long-term investors focused on inflation hedging, especially if they occur near key support levels like $108.01 or $106.74.
Frequently Asked Questions: BRENT Analysis
What happens if BRENT breaks below the $108.01 support level?
A break below $108.01 on the 1-hour chart, especially with negative news flow, would invalidate the immediate bullish outlook. This could trigger further selling pressure, targeting the next support at $107.33, as short-term traders exit positions.
Is BRENT at $110.33 a buy right now, considering the overbought RSI?
Buying BRENT at $110.33 is risky due to the overbought RSI (69.18 daily, 78.32 on 1H) and conflicting signals on shorter timeframes. A more prudent approach would be to wait for a pullback to a support level like $108.01 or confirmation of a sustained breakout above $110.77.
How does the ADX reading of 14.32 on the 4-hour chart impact BRENT's trend analysis?
An ADX of 14.32 on the 4-hour chart indicates a weak trend or ranging market, suggesting consolidation. This contrasts with the strong daily trend (ADX 62.63), implying that while the longer-term direction may be up, the path could be volatile and choppy, with potential for sharp reversals.
How will upcoming inflation data affect BRENT crude prices around $110.33?
If upcoming inflation data comes in hotter than expected, it could reinforce stagflation fears and support BRENT prices, potentially pushing them higher on supply concerns. Conversely, signs of cooling inflation might lead to expectations of slower demand, capping oil prices.
Technical Outlook Summary
| Indicator | Value | Signal | Interpretation |
|---|---|---|---|
| RSI (14) | 69.18 | Neutral | Approaching overbought territory, watch for pullbacks. |
| MACD Histogram | Positive | Bullish | Momentum favors upside, but watch for divergence. |
| Stochastic | K=39.39, D=46.4 | Bearish | Bearish cross in oversold zone; watch for confirmation. |
| ADX | 62.63 | Bullish | Very strong trend; expect continuation or sharp reversal. |
| Bollinger | Middle Band Break | Bullish | Price above mid-band suggests upward pressure. |
Key Levels
Support Levels
Resistance Levels
Track markets in real-time
AI-powered analysis, technical indicators and real-time price data.
Join Our Telegram Channel
Breaking market news, AI analysis and trading signals instantly.
Join Channel