The global oil market is at a critical juncture as Brent crude futures trade precariously close to the $99.65 mark. This level is not just a psychological barrier but a significant price point that reflects a complex interplay of escalating geopolitical risks, particularly in the Middle East, and the market's anticipation of critical OPEC+ supply decisions. The recent surge in oil prices, with Brent futures climbing over 2% to $98.25 and WTI crude following suit, underscores the heightened sensitivity of the energy market to supply disruptions and potential policy shifts from major producers. As traders digest these cross-currents, understanding the underlying drivers and potential scenarios becomes paramount for navigating this volatile landscape.
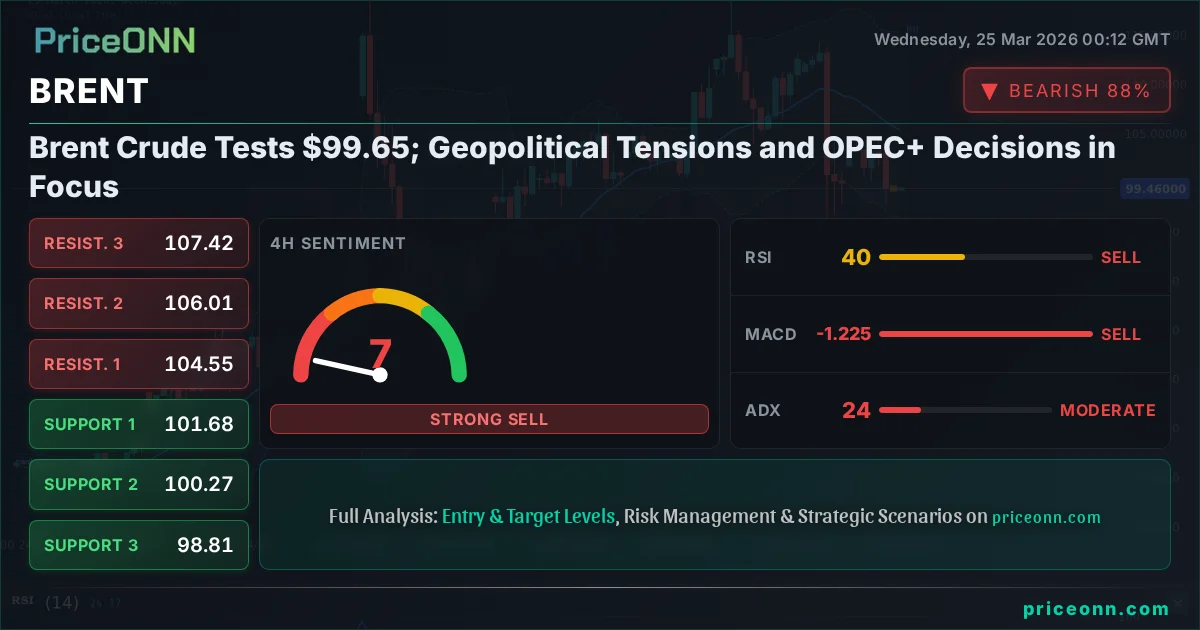
- Brent crude is currently trading at $99.65, hovering near key resistance levels.
- Escalating Middle East tensions and anticipation of OPEC+ supply decisions are driving market sentiment.
- Key technical support for Brent sits at $92.58, with significant resistance identified at $110.93.
- The 1-hour chart shows a weak trend (ADX 34.34), while the daily chart indicates a strong uptrend (ADX 63.98).
The current price action for Brent crude at $99.65 is emblematic of a market grappling with both immediate supply-side shocks and longer-term demand considerations. Geopolitical instability, particularly the ongoing tensions in the Middle East, has historically been a potent catalyst for oil price spikes. Reports of rising US-Iran tensions and concerns over the passage through the Strait of Hormuz have directly contributed to the recent upward momentum, pushing oil prices over 3% higher in a single session. This heightened risk premium is a clear signal that market participants are pricing in potential supply disruptions, even if those disruptions haven't materialized on a large scale yet. The fear of conflict impacting major oil-producing regions or critical shipping lanes is enough to send speculative money into the market, driving prices higher.
The Geopolitical Tightrope Walk
The narrative of escalating Middle East tensions has become a dominant factor in recent oil price movements. Reports from sources like Reuters and Bloomberg highlighting heightened US-Iran tensions and potential threats to the Strait of Hormuz passage are not just news items; they are direct inputs into trading algorithms and investor sentiment. The Strait of Hormuz is a critical chokepoint, responsible for the transit of a significant portion of the world's oil supply. Any perceived threat to its stability immediately introduces a substantial risk premium into crude oil prices. This isn't just about actual supply loss; it's about the fear of it. Traders are often quick to price in worst-case scenarios, leading to rapid price increases that may not be fully justified by current physical supply deficits but reflect the potential for future disruptions. This dynamic creates a 'risk-on' sentiment for oil prices, often correlating with a 'risk-off' sentiment in broader financial markets as investors seek refuge in tangible assets.
This geopolitical backdrop is further complicated by the upcoming OPEC+ meeting. The cartel and its allies have demonstrated a willingness to adjust production levels to support prices, and market participants are keenly watching for any signals of further voluntary cuts or extensions of existing ones. Saudi Arabia's previous voluntary cuts, for instance, have been instrumental in tightening the market. If similar measures are announced or hinted at, it could provide a significant tailwind for Brent prices, potentially pushing them towards the $110.93 resistance level identified on the daily chart. Conversely, any indication of wavering commitment to production management or a surprise increase in output could trigger a sharp sell-off, testing the $92.58 support.
Supply-Side Dynamics: OPEC+ and Beyond
The decisions made by OPEC+ carry immense weight in the global oil market. This group, led by Saudi Arabia and Russia, has proven adept at managing supply to influence price levels. The current market environment, characterized by geopolitical uncertainty and mixed demand signals, puts them in a delicate position. On one hand, higher prices provide revenue that many member nations rely on. On the other hand, sustained high prices could stifle global economic growth and encourage faster production increases from non-OPEC+ sources, particularly US shale producers. The current ADX reading on the daily chart at 63.98 indicates a very strong uptrend, suggesting that the market is currently favoring higher prices, a sentiment that OPEC+ might seek to capitalize on, or conversely, temper to avoid overheating.
Beyond OPEC+, the supply picture is also influenced by other major producers. US shale production, while showing signs of slowing growth according to some analyses, remains a significant factor. Record production levels in the past have acted as a ceiling on price rallies. However, the current geopolitical premium might be overshadowing these production figures for now. Inventory levels also play a crucial role. While specific inventory data wasn't provided in the market context, general trends of inventory drawdowns typically support higher prices, while builds suggest weaker demand or oversupply. Traders closely monitor weekly inventory reports from the EIA and API for clues about the physical balance of the market. A significant inventory build could quickly dampen the bullish sentiment fueled by geopolitical fears.
Demand-Side Signals: A Mixed Bag
While supply-side concerns are currently dominating the narrative, demand for oil remains a critical, albeit more complex, factor. China's economic performance, a key driver of global oil demand, continues to be a focal point. While there are signs of economic reopening and potential recovery, the pace and sustainability of this rebound are subject to ongoing debate. Reports from sources like Bloomberg often analyze China's manufacturing PMI and consumption data, providing insights into its oil appetite. A robust Chinese recovery would undoubtedly lend support to Brent prices, potentially helping them challenge higher resistance levels. Conversely, any signs of economic slowdown in China or other major economies could put a damper on demand expectations, even amidst geopolitical supply fears.
In Europe, the energy situation remains a delicate balancing act. While the continent has reduced its dependence on Russian gas, its reliance on US LNG has created a new form of dependency. This shift impacts overall energy dynamics and can indirectly influence oil demand as power generation and industrial processes adapt. The economic health of major consuming nations, including the US and the Eurozone, is also crucial. If central banks continue to signal hawkish monetary policies, or if inflation proves more persistent than expected, it could lead to slower economic growth, thereby capping oil demand. The RSI on the 1-hour chart at 67.48 suggests a rising trend but is not yet in overbought territory, indicating room for further upward movement if demand signals strengthen. However, the RSI of 49.36 on the 4-hour chart and 35.42 on the daily chart suggest that from a medium-to-long-term perspective, demand might not be robust enough to sustain significantly higher prices without additional supply shocks.
Cross-Market Correlations: DXY, Equities, and Yields
Understanding the broader market context is essential. The US Dollar Index (DXY) often exhibits an inverse correlation with oil prices, especially when geopolitical tensions are high and the dollar is seen as a safe-haven asset. With the DXY currently trading at 98.88 and showing a general upward trend on the daily chart (ADX 32.74), it presents a potential headwind for oil prices. A stronger dollar makes oil more expensive for holders of other currencies, which can dampen demand. The DXY's movement towards 99.50, as reported recently, buoyed by rising Treasury yields and hawkish Federal Reserve signals, reinforces this dynamic. This correlation suggests that any sustained dollar strength could limit the upside for Brent, even if geopolitical fears persist.
Equity markets also provide crucial context. The SP500 is currently trading at 6604.6, showing a daily increase, but its longer-term trend on the daily chart indicates a strong downtrend (ADX 45.34). Similarly, the Nasdaq 100 is also in a significant downtrend on the daily timeframe. A 'risk-off' sentiment in equities, where investors flee riskier assets for safer havens, can sometimes spill over into commodities, although oil's unique role as both a commodity and a geopolitical hedge can complicate this relationship. If the broader equity markets continue to show weakness, it might signal a slowdown in global economic activity, which would negatively impact oil demand expectations and potentially cap Brent's ascent. The Stochastic indicator showing a K > D crossover on the daily chart for Brent suggests a potential bullish signal, but this needs to be viewed within the context of broader market risk appetite.
Treasury yields are another key correlation. Rising yields can signal expectations of higher inflation or tighter monetary policy, both of which can influence oil prices. Higher yields can also make holding non-yielding assets like gold less attractive relative to bonds, but their impact on oil is more complex, often tied to economic growth expectations. The interplay between the dollar, equities, and yields creates a dynamic environment where oil prices must contend with a multitude of macro forces, not just supply and demand fundamentals.
Technical Landscape: Short-Term Strength vs. Long-Term Caution
Examining the technical indicators for Brent crude reveals a mixed picture, leaning towards short-term bullishness driven by immediate catalysts, but with underlying caution from longer-term perspectives. On the 1-hour chart, the trend is decidedly bullish with a high strength (77%), supported by a RSI of 67.48, positive MACD momentum, and Stochastic K > D crossover. This suggests that the recent upward move has momentum. However, the ADX at 14.82 indicates a weak trend, implying that this short-term rally might lack conviction and could be susceptible to reversals. The Bollinger Bands are trading above the upper band, which can signal overbought conditions or a strong breakout, but the weak ADX suggests the former is more likely in the short term.
The 4-hour timeframe presents a more neutral picture, with a trend strength of 50%. While the RSI is around 49.36 and trending downwards, the MACD shows positive momentum. The Stochastic K=79.41, D=61.5 indicates a bullish signal, but the ADX at 53.22 is concerning, signaling a very strong downtrend in this timeframe. This divergence between momentum indicators and trend strength suggests a potential battleground. Prices are hovering around the middle band of the Bollinger Bands, indicating a period of consolidation or indecision. The general signal for the 4-hour timeframe is neutral, reflecting this ambiguity.
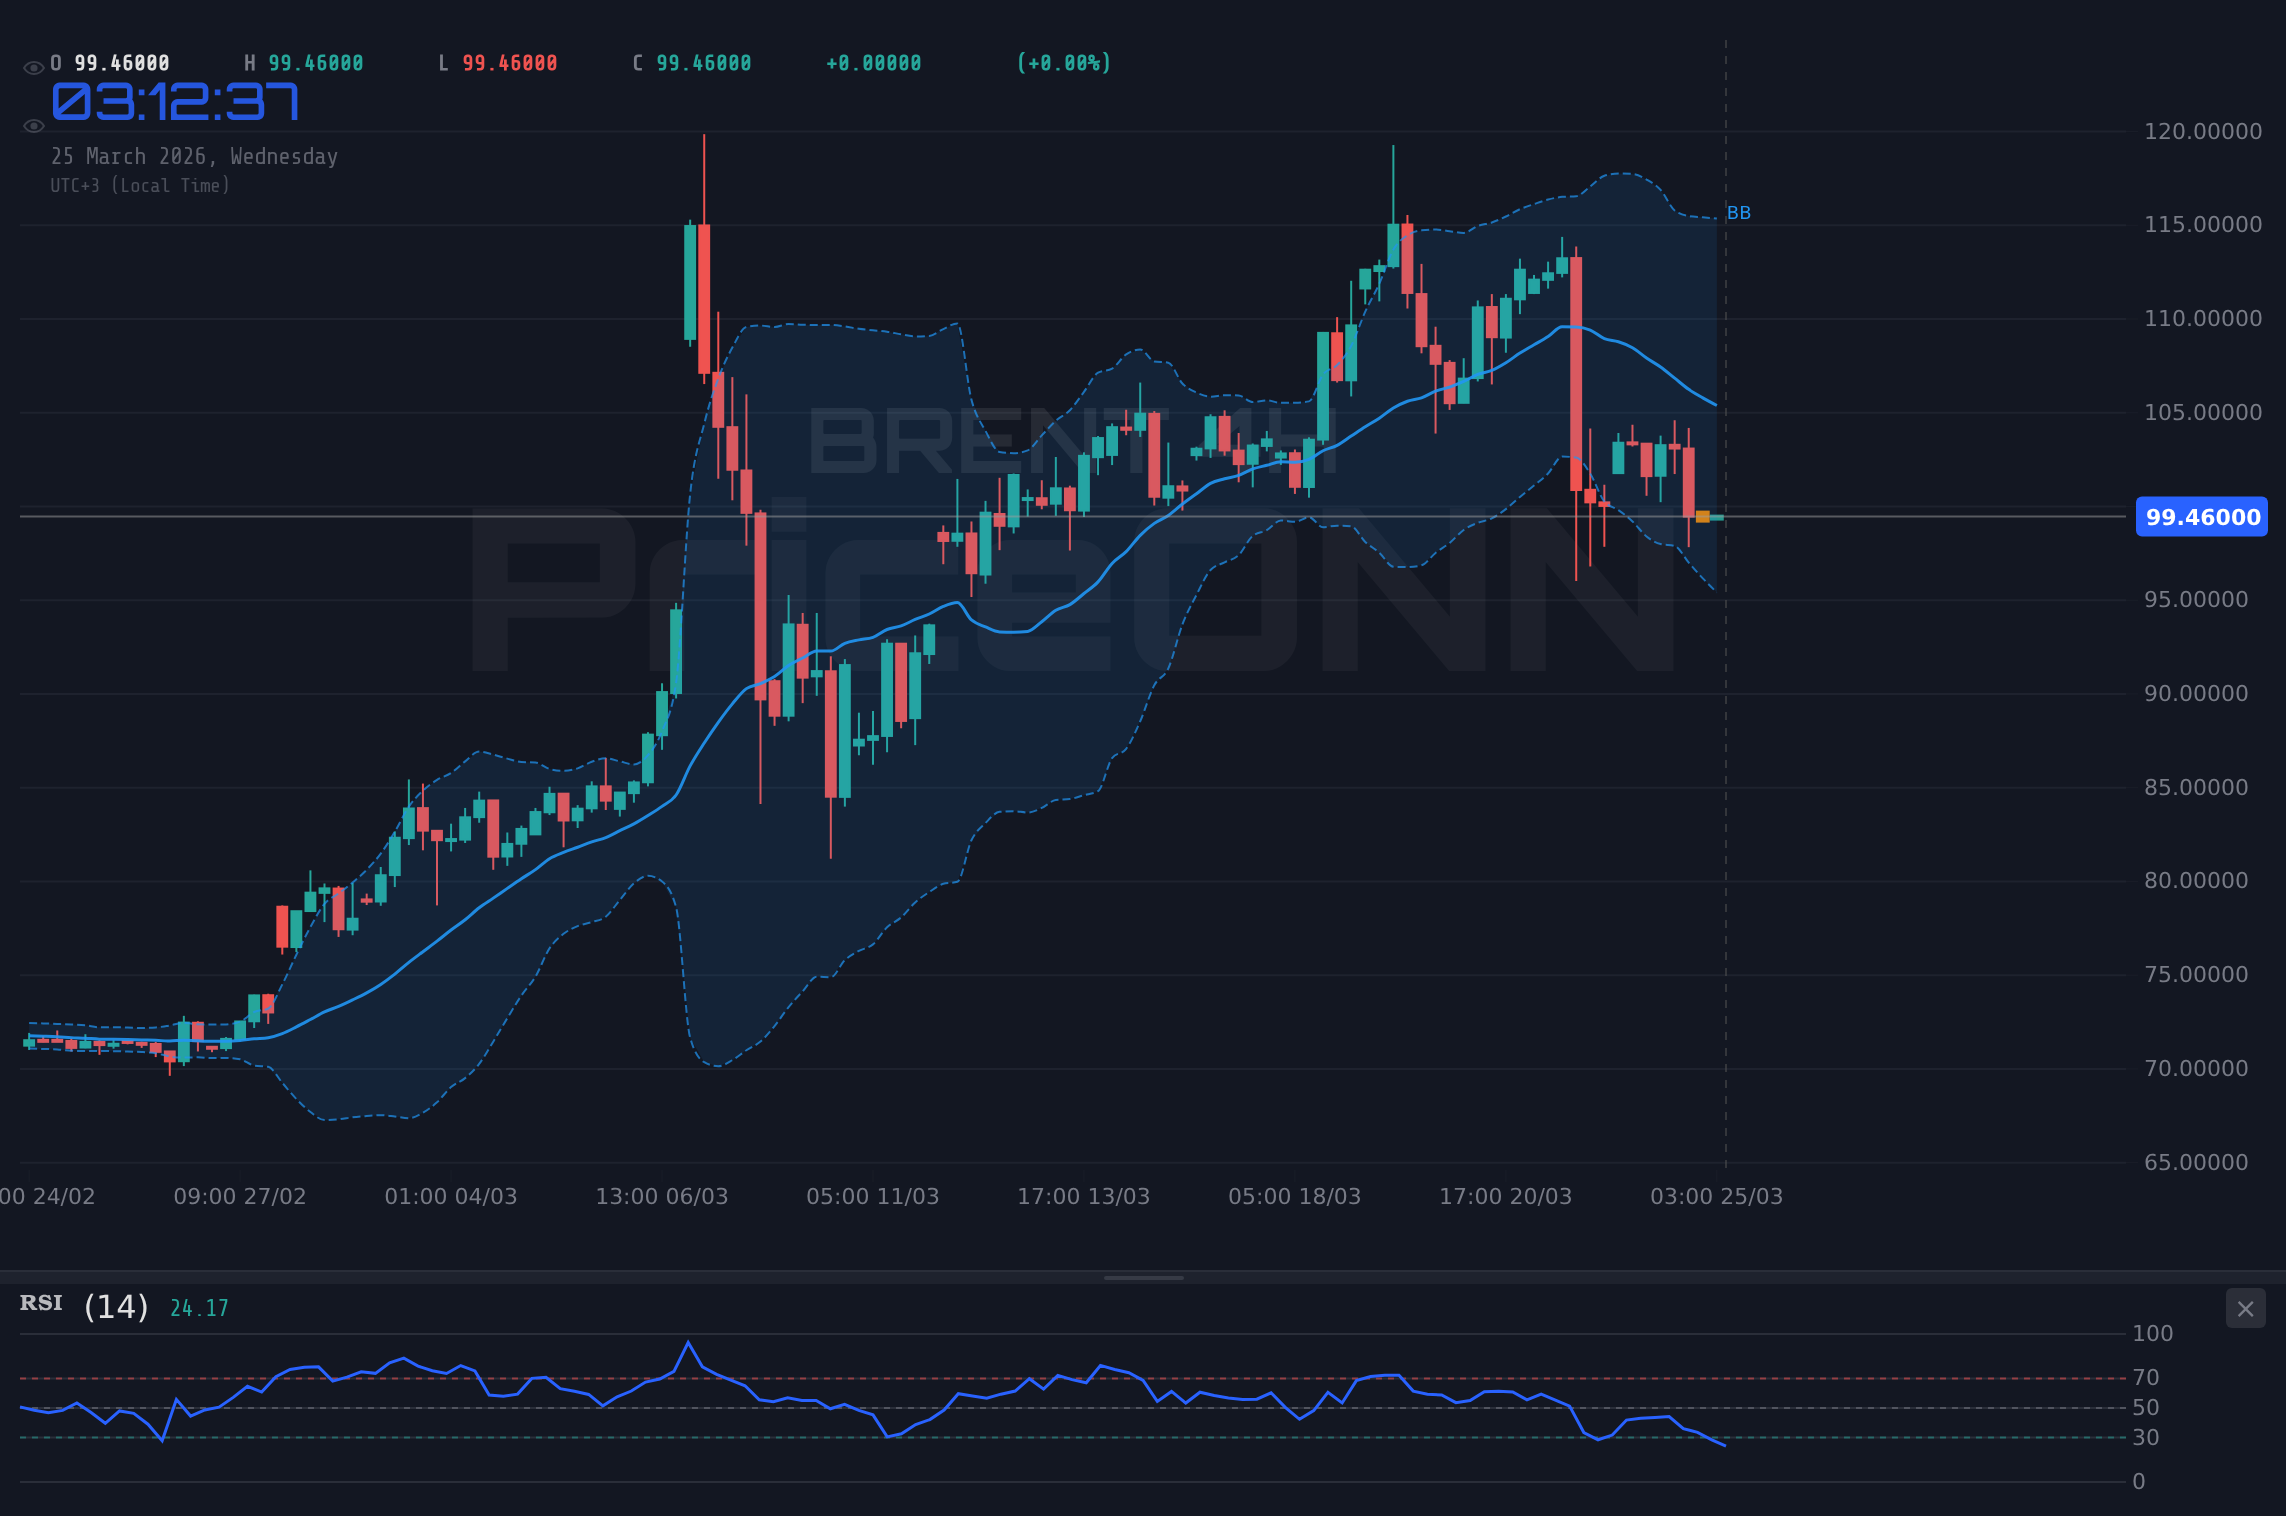
The daily chart paints a more cautious outlook. The trend is classified as neutral with 50% strength, but the ADX at 25.59 indicates a strong downtrend. The RSI is at 35.42, well within neutral territory and trending downwards, suggesting bears have the upper hand in the longer term. The MACD is showing negative momentum, and prices are trading below the middle Bollinger Band, reinforcing a bearish bias. However, the Stochastic K=23.79, D=13.82 is showing a bullish signal, indicating a potential for a short-term bounce from oversold conditions. This conflict between the daily trend and momentum indicators highlights the importance of the current price level around $99.65. A failure to break higher could see prices test the daily support at $92.58, while a sustained move above resistance at $104.55 (4H resistance) could signal a shift in the longer-term trend.
Navigating the Scenarios: A Trader's Roadmap
Given the current market conditions, several scenarios are plausible. The immediate focus remains on the $99.65 price point. A break above the nearest resistance levels, particularly the 4-hour resistance at $104.55, could trigger a move higher, potentially targeting the daily resistance at $110.93. This bullish scenario would likely be fueled by confirmation of further OPEC+ production cuts or a significant escalation in Middle East tensions. However, the weak ADX on the 1-hour chart and conflicting signals on the daily timeframe suggest that such a move might face strong headwinds. The probability for this bullish scenario is estimated at 35%, contingent on clear catalysts.
Conversely, a breakdown below the current price action, specifically closing below the 1-hour support at $92.58, could open the door for a steeper decline. This bearish scenario could be triggered by de-escalation in the Middle East, a surprisingly dovish stance from OPEC+, or signs of weakening global demand. The daily chart's bearish undertones, with RSI at 35.42 and negative MACD momentum, lend credence to this possibility. The target for such a move could be the next significant support level at $85.13. The probability for this bearish scenario is estimated at 45%, reflecting the cautious long-term technical picture and potential for demand-side concerns to resurface.
A neutral or consolidation scenario is also highly probable, especially if geopolitical tensions remain elevated but do not translate into immediate supply disruptions, and OPEC+ makes no significant policy changes. In this case, Brent crude might trade within a range, likely between the immediate support at $92.58 and resistance around $104.55. This sideways movement could allow for a clearer technical picture to emerge, perhaps with indicators aligning more consistently across different timeframes. The probability for this neutral scenario is estimated at 20%. Patience will be key for traders, allowing the market to digest incoming news and provide clearer directional signals.
Bearish Scenario: Geopolitical De-escalation or Demand Fears
45% ProbabilityNeutral Scenario: Range-Bound Consolidation
20% ProbabilityBullish Scenario: Supply Shock or OPEC+ Action
35% ProbabilityFrequently Asked Questions: BRENT Analysis
What happens if BRENT breaks below $92.58 support?
A break below the $92.58 support level on the 1-hour chart could signal a shift towards the bearish scenario. This would likely be confirmed by negative momentum on the daily MACD and RSI trending lower, potentially targeting $85.13 and then $74.23.
Should I buy BRENT at current levels near $99.65 given the bullish signals on the 1H chart?
Buying at $99.65 requires caution due to conflicting signals across timeframes. The 1H chart shows bullish momentum (RSI 67.48, Stochastic K>D), but the daily chart indicates a strong downtrend (ADX 25.59). A high-probability entry would require confirmation, such as a break above $104.55, with invalidation below $92.58.
Is the RSI at 35.42 on the daily chart a sell signal for BRENT?
An RSI of 35.42 on the daily chart suggests that prices are not overbought and could potentially move lower. However, it is not an extreme oversold reading, and coupled with negative MACD momentum and a strong daily downtrend (ADX 25.59), it indicates bearish pressure rather than an immediate buy signal. It suggests bears are in control.
How will the upcoming OPEC+ decision affect BRENT price action near $99.65?
An announcement of significant production cuts by OPEC+ could trigger a bullish breakout, pushing BRENT towards the $110.93 resistance. Conversely, a failure to agree on cuts or an indication of increased production could lead to a sharp sell-off, testing the $92.58 support. The market is highly sensitive to these supply decisions.
Volatility creates opportunity - those prepared will be rewarded.
While the immediate path for Brent crude remains uncertain, disciplined risk management and a focus on clear technical levels will be crucial. The market's sensitivity to geopolitical events and OPEC+ policy suggests that significant price swings are possible, offering opportunities for astute traders.
Track markets in real-time
AI-powered analysis, technical indicators and real-time price data.
Join Our Telegram Channel
Breaking market news, AI analysis and trading signals instantly.
Join Channel