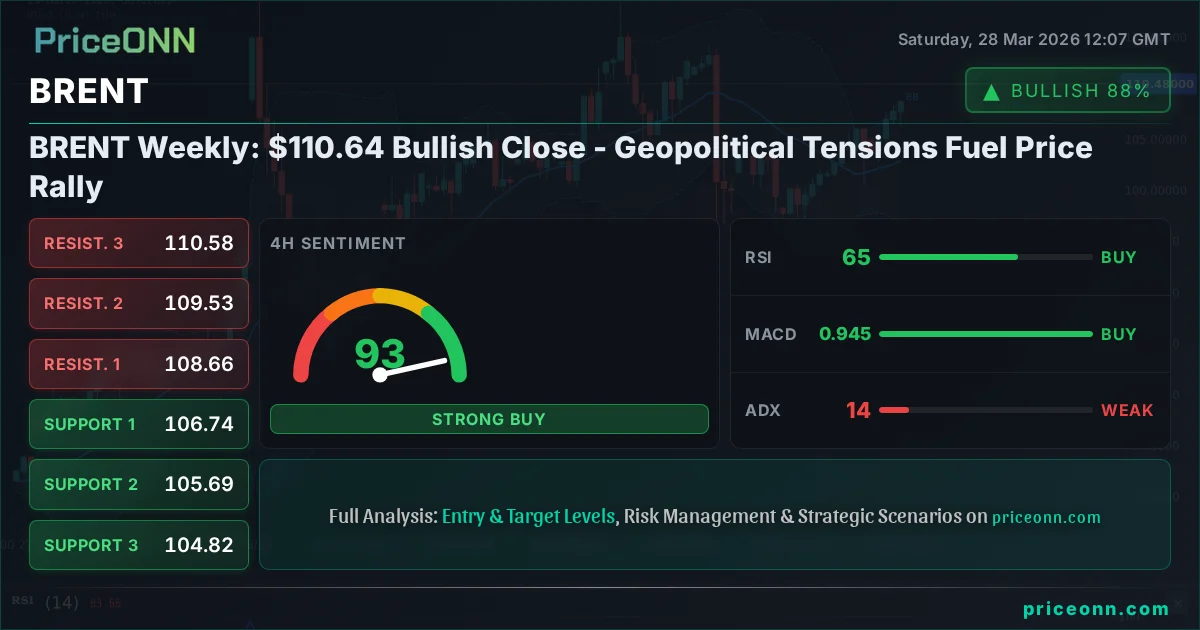
The oil market is once again at a critical juncture, with Brent crude futures closing last Friday at a robust $110.64. This significant bullish move, representing a substantial weekly gain, was primarily fueled by escalating geopolitical tensions in the Middle East, specifically the recent developments surrounding Iran and the Strait of Hormuz. As traders digest these events, the market is sharply divided: bulls see further upside potential driven by supply disruption fears, while bears point to potential overextension and the possibility of de-escalation or alternative supply routes. This analysis delves into the competing narratives, examining the fundamental drivers, technical signals, and macroeconomic correlations that are shaping the outlook for Brent crude in the coming week.
- Brent crude closed the week at $110.64, marking a significant bullish advance driven by Middle East tensions.
- The RSI at 69.37 on the daily chart suggests upward momentum, but caution is warranted as it approaches overbought territory.
- Key support sits at $100.77, while resistance is eyed near $111.91; a decisive break of either level will be crucial.
- Geopolitical risk premium is evident, with the DXY at 99.91 reflecting broader market uncertainty and safe-haven demand.
Last week was a testament to how swiftly geopolitical events can impact commodity markets. The aggressive cyber-attacks and subsequent military responses in the Middle East, particularly concerning Iran's actions near the Strait of Hormuz, injected a substantial risk premium into crude oil prices. This is not merely a speculative surge; it's a direct response to perceived threats against a critical chokepoint for global oil supply. The market's reaction was swift and decisive, pushing Brent prices from the lower end of its weekly range towards the upper bounds, ultimately closing near the week's highs. This price action highlights the market's sensitivity to supply-side shocks and the enduring influence of geopolitical instability on energy security.
The Bull Case: Supply Disruption Fears Dominate
The bullish argument for Brent crude is deeply rooted in the immediate threat to supply. Iran's assertive actions, which reportedly led to the closure of the Strait of Hormuz, immediately put approximately 30% of globally traded oil at risk. This strait is a vital artery for crude oil exports from major Middle Eastern producers, including Saudi Arabia, Iraq, and the UAE. Any sustained disruption, or even the credible threat of one, forces traders to price in a significant supply deficit. The market's response, a sharp rally of over 6.7% for Brent and 7.69% for WTI within the week, reflects this immediate pricing-in of risk. Furthermore, the news from Ukraine about drone strikes threatening Russian oil exports adds another layer of supply-side anxiety, suggesting that global oil production faces multifaceted challenges.
From a fundamental perspective, this supply-side shock comes at a time when global oil inventories, while not critically low, are not abundant enough to absorb a significant, prolonged disruption without a substantial price increase. The market has been slowly drawing down inventories, and the prospect of further draws due to geopolitical events is a potent bullish catalyst. Saudi Arabia's recent voluntary production cuts, aimed at supporting prices, also contribute to a tighter market balance, leaving less spare capacity to offset any sudden supply shortfalls. This combination of reduced spare capacity and immediate supply threats creates a fertile ground for sustained upward price pressure, at least in the short to medium term.
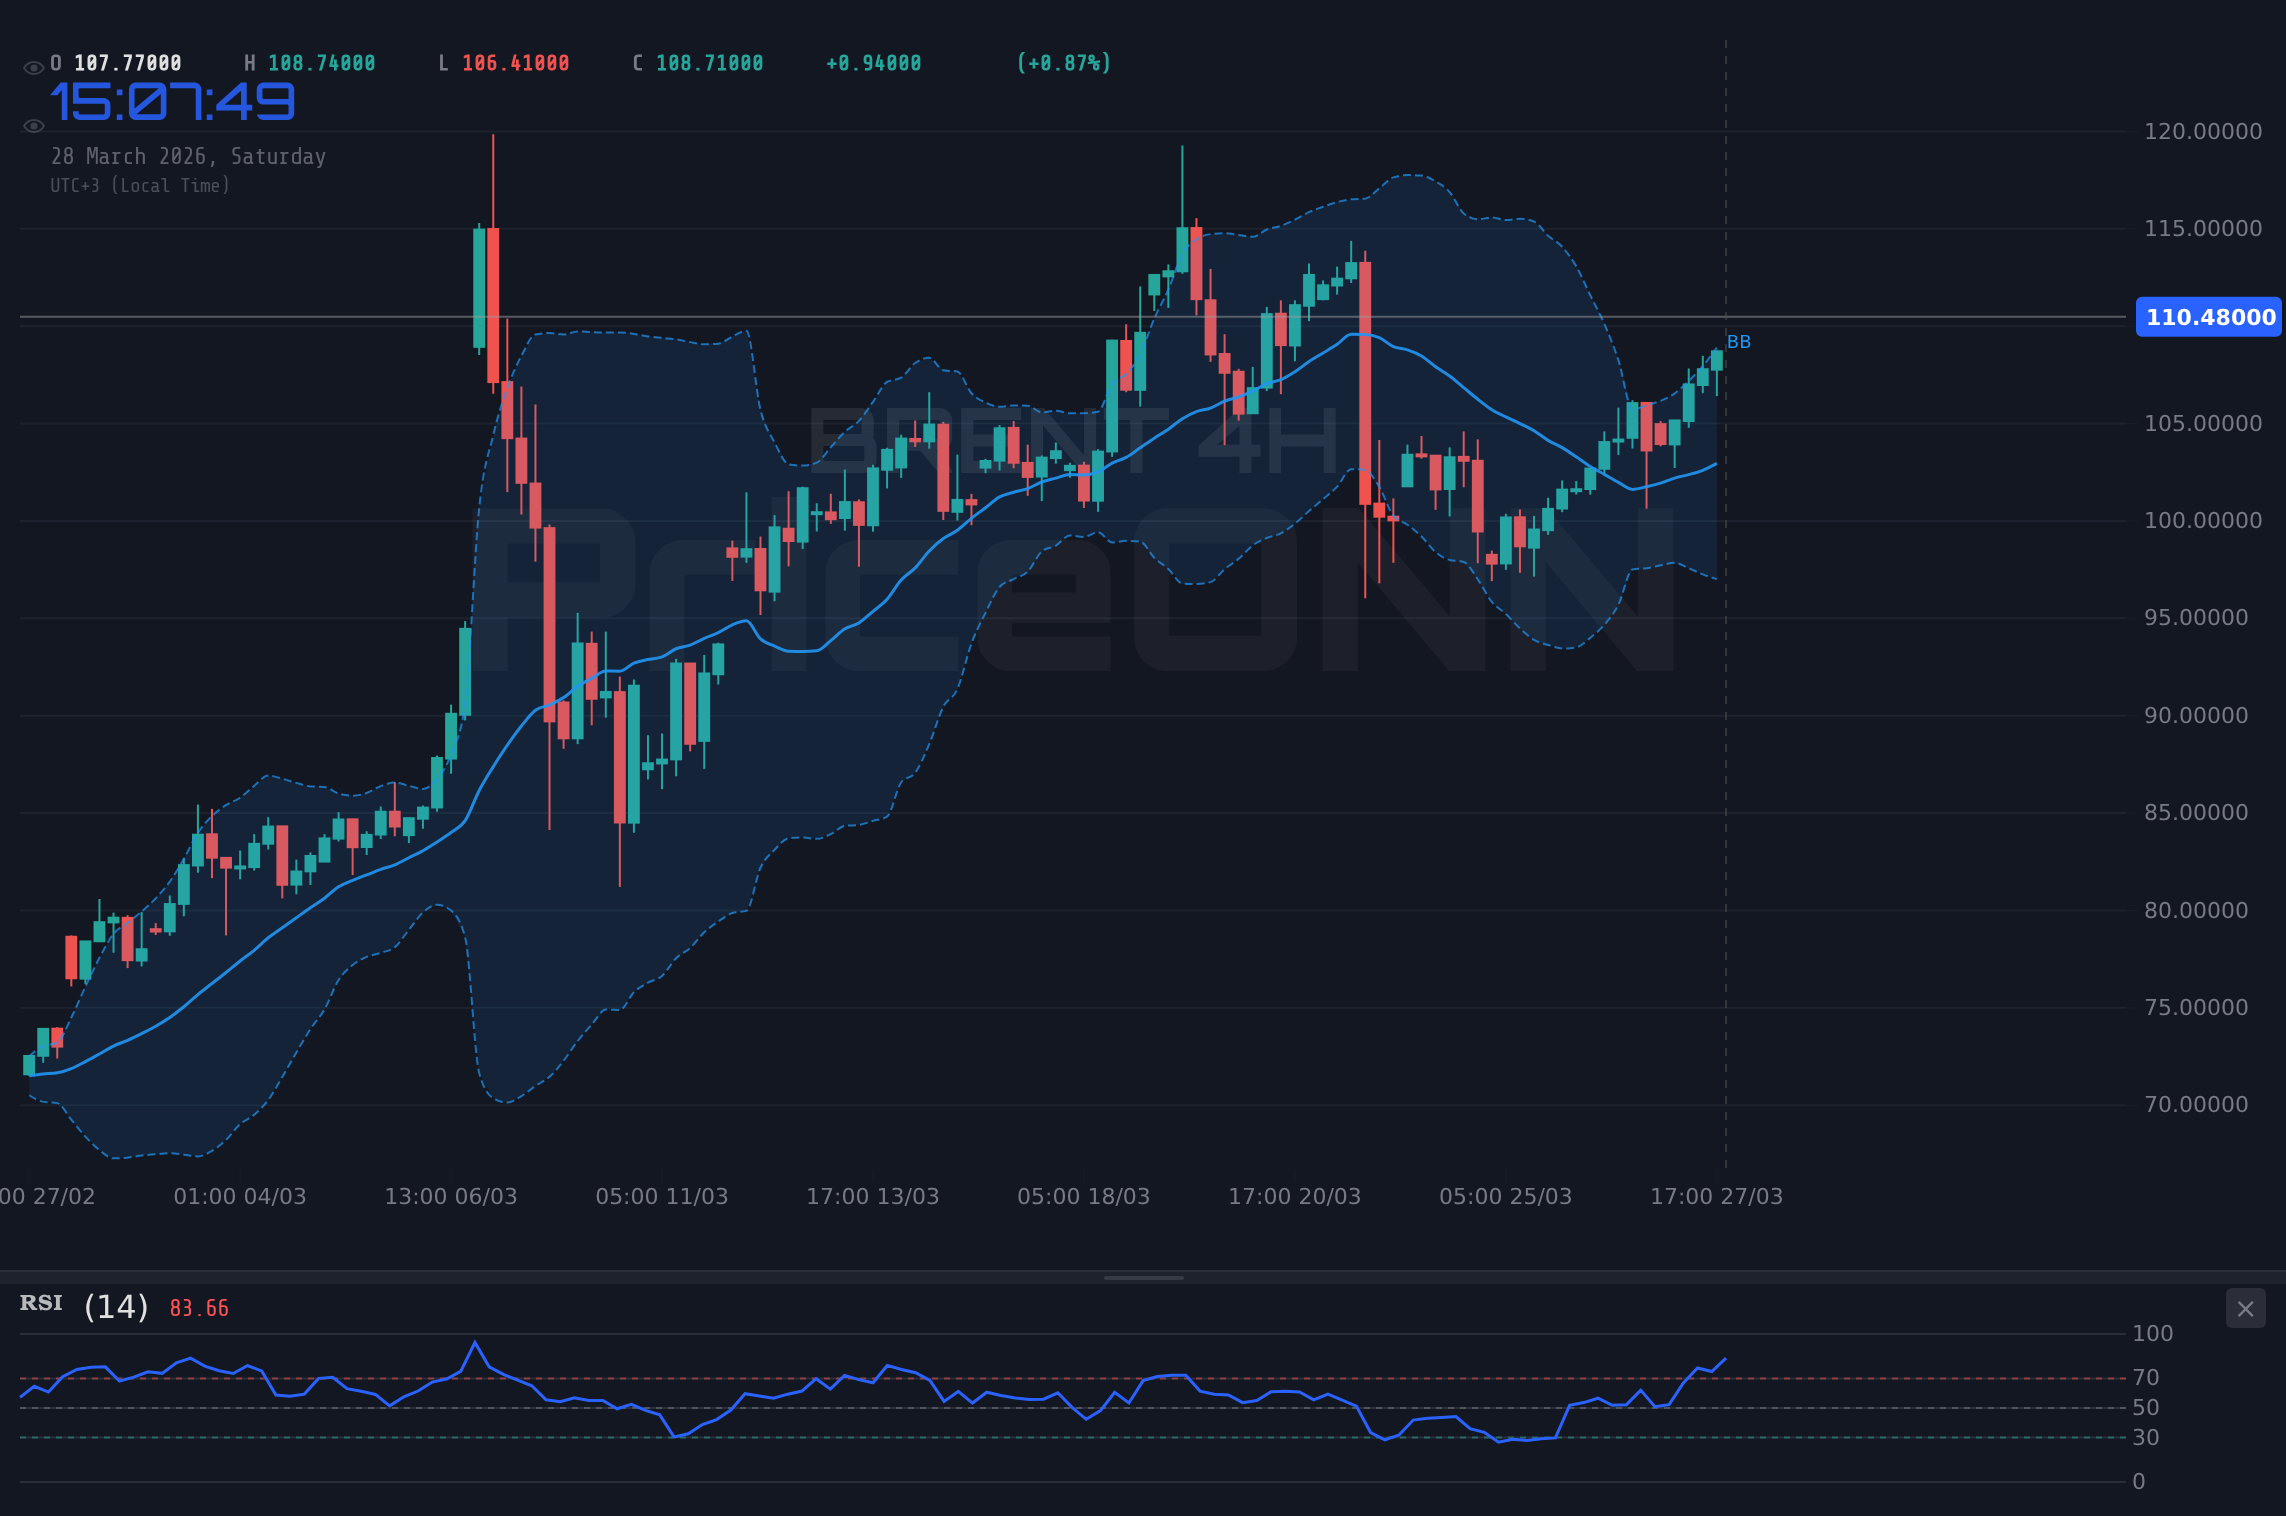
Technically, the daily chart for Brent shows a strong bullish reversal after a period of consolidation. The price has decisively broken above the mid-Bollinger Band and is now challenging the upper band, indicating strengthening upward momentum. The RSI, while currently at 69.37, is still below the critical 70 level, suggesting there is room for further upside before entering extreme overbought territory, though the upward trajectory is clear. The MACD indicator is showing positive momentum, with the MACD line above the signal line, further supporting the bullish narrative. The ADX at 62.64 on the daily timeframe is exceptionally high, indicating a very strong trend is in play, though such extreme readings can sometimes precede sharp reversals or consolidations. However, the immediate technical picture favors the bulls, especially after the decisive breakout from the recent trading range.
The 1-hour and 4-hour charts also paint a predominantly bullish picture, with strong upward trends and positive momentum indicators. The 1H ADX at 19.33 suggests a weaker trend compared to the daily, but the overall signal across multiple timeframes leans towards bullish continuation in the immediate short term. The Stochastic oscillator on the 1H chart shows %K (91.38) above %D (86.18), indicating overbought conditions, which could signal a pause or minor pullback, but the prevailing trend on higher timeframes suggests these pullbacks might be buying opportunities.
Bullish Scenario: Geopolitical Premium Expands
65% ProbabilityThe Bear Case: De-escalation Hopes and Technical Overextension
Conversely, the bears are quick to point out that geopolitical premiums can be volatile and prone to rapid unwinding. History is replete with examples where market reactions to perceived threats have been overblown, only to reverse sharply when de-escalation occurs or when alternative supply routes are quickly established. The Strait of Hormuz, while critical, is not the only pathway for oil. Furthermore, the global economy is not currently in a demand-boom phase that could easily absorb sustained high prices without significant demand destruction. If inflation concerns resurface strongly due to high energy costs, central banks might be forced to adopt more hawkish stances, potentially dampening economic growth and, consequently, oil demand.
The bears also highlight the technical overextension that could be developing. While daily indicators show a strong uptrend, the RSI nearing 70 and the extremely high ADX reading on the daily chart (62.64) are warning signs. These levels can indicate that the market is becoming overheated and vulnerable to a sharp correction. The Stochastic oscillator on the 1H chart is already showing overbought conditions, which could precede a pullback. A failure to decisively break through the $110.77 resistance level could signal a topping pattern, leading to profit-taking and a move back towards lower support levels. The 4H chart's ADX of 14.41, indicating a weak trend on that timeframe despite the daily strength, could also suggest that the current move lacks broad conviction.
Moreover, the global macroeconomic backdrop adds a layer of complexity. While the immediate focus is on supply disruptions, the underlying demand picture remains a key factor. If the current geopolitical events lead to a significant global economic slowdown or recession, demand for oil could contract sharply, negating the impact of supply fears. The strengthening US Dollar, as indicated by the DXY trading near 99.91, could also act as a headwind for oil prices, making dollar-denominated commodities more expensive for holders of other currencies. This correlation between a strong dollar and weaker oil prices is a long-standing one, and any sustained dollar strength could cap upside potential.
The market's reaction to upcoming economic data will be crucial. If key economic releases, such as inflation figures or employment data from major economies, indicate weakening demand, it could quickly shift the narrative from supply-driven rallies to demand-destruction concerns. The bears are watching for any signs that the current price surge is unsustainable and ripe for a correction, especially if the geopolitical situation stabilizes or if global demand falters.
Bearish Scenario: Geopolitical Premium Unwinds
25% ProbabilityBridging the Gap: Technicals and Market Sentiment
The technical indicators present a somewhat conflicting picture when viewed across different timeframes, which is typical during periods of heightened geopolitical uncertainty. The daily timeframe clearly favors the bulls, with strong momentum and a confirmed uptrend. However, the shorter timeframes, particularly the 1-hour chart, show signs of overbought conditions and potential for consolidation or a minor pullback. The Stochastic oscillator on the 1H chart, with %K below %D, specifically signals a potential short-term reversal or pause. This divergence between longer-term bullish trends and shorter-term overbought signals suggests that the market might be consolidating its recent gains before the next major move.
The ADX readings are particularly noteworthy. The extremely high daily ADX of 62.64 indicates a very powerful, albeit potentially overextended, trend. Conversely, the 1H ADX at 19.33 and the 4H ADX at 14.41 signal much weaker trends on those timeframes. This discrepancy suggests that while the daily trend is strong, the conviction behind the intraday and intra-session moves might be waning, or that the market is entering a phase of consolidation before the next leg higher or a correction. Traders are likely watching these conflicting signals closely, waiting for confirmation from price action before committing to significant positions.
Market sentiment, as reflected in news flow and trader commentary, is heavily tilted towards supply disruption fears. The narrative of 'war premium' is dominant, pushing aside concerns about global demand for now. However, this sentiment can shift rapidly. Should diplomatic efforts lead to a de-escalation, or if economic data starts to signal a significant slowdown, sentiment could flip quickly. The strength of the US Dollar, currently trading around 99.91, is a subtle counter-narrative that bears might latch onto. A stronger dollar typically puts downward pressure on dollar-denominated commodities like oil, and if the geopolitical risk premium fades, this correlation could reassert itself.
The role of OPEC+ cannot be ignored. While their recent production cuts have supported prices, any indication from the group about adjusting output in response to market conditions could significantly influence BRENT's trajectory. However, with current tensions, the group may be inclined to let the price rally continue, especially if supply disruptions materialize.
Neutral Scenario: Consolidation Amidst Uncertainty
10% ProbabilityThe Verdict: Cautious Optimism for Bulls
Considering the current market data and the prevailing narrative, the scales appear to tip slightly in favor of the bulls, albeit with significant caveats. The immediate threat to oil supply from the Middle East is a potent fundamental driver that cannot be ignored. The price action last week, with Brent closing at $110.64, confirms that the market is actively pricing in this risk premium. The bullish signals on the daily timeframe, supported by strong momentum and a clear uptrend, suggest that the path of least resistance may continue to be upwards in the short term.
However, the overbought conditions on shorter timeframes and the extremely high daily ADX warrant caution. This is not a green light for unchecked bullishness. Traders should be mindful of the potential for sharp pullbacks and the inherent volatility associated with geopolitical events. The market's reaction to any de-escalation efforts or significant shifts in global economic outlook could quickly alter the trajectory. The correlation with the DXY, currently at 99.91, also presents a potential headwind if the dollar continues its strengthening trend.
The key levels to watch remain critical. A sustained hold above $110.77 resistance could open the door for further gains towards $111.91 and potentially $115.00. Conversely, a failure to hold $109.39, followed by a break below the $106.74 support, would invalidate the immediate bullish outlook and suggest a move lower, potentially targeting $105.69.
Ultimately, the market is caught between the immediate fear of supply disruption and the longer-term concerns about global demand and potential economic slowdowns. The bullish case is currently dominant due to the tangible threat in the Middle East. However, vigilance is required. The price action in the coming days, particularly whether it can sustain levels above $110.64 and break higher, will be telling. Traders must manage risk diligently, acknowledging the high volatility and the potential for rapid sentiment shifts. The market is clearly signaling that geopolitical risk is back on the table, and until that narrative changes, oil prices are likely to remain elevated, with Brent testing higher levels if supply fears persist.
The weekly review highlights a market driven by fear and supply-side anxiety. While the daily technicals support further upside, the overbought conditions on shorter timeframes and the extreme ADX readings suggest that a period of consolidation or a sharp pullback is a distinct possibility. The key will be how price action behaves around the $110.77 resistance and $106.74 support levels. The ongoing geopolitical narrative provides a strong underpinning for prices, but any sign of de-escalation or a significant slowdown in global demand could lead to a rapid unwinding of the current risk premium. For now, the bulls appear to have the upper hand, but the market remains on a knife's edge.
Frequently Asked Questions: BRENT Analysis
What happens if BRENT holds above $110.77 resistance after closing at $110.64?
If BRENT sustains a move above the $110.77 resistance level, it signals strong bullish conviction driven by supply fears. This would likely trigger further buying, targeting the next significant resistance at $111.91, with potential for a move towards $115.00 if the geopolitical premium continues to expand.
Should I buy BRENT at current levels around $110.64, given the RSI at 69.37?
Buying at current levels requires caution. While the daily trend is bullish, the RSI at 69.37 suggests it's approaching overbought territory, indicating potential for a short-term pullback. A confirmation of bullish momentum above $110.77 would be a stronger signal, but risk management is paramount given the volatility.
Is the high daily ADX at 62.64 a sell signal for BRENT right now?
An ADX of 62.64 indicates an extremely strong trend, which is bullish in this context. However, such high readings can also signal an overextended market vulnerable to sharp corrections. It's not a direct sell signal but warrants vigilance for potential trend exhaustion or consolidation.
How will the DXY at 99.91 affect BRENT prices this week?
The DXY trading around 99.91 reflects broader market uncertainty and potentially a strengthening dollar. A strong dollar typically exerts downward pressure on dollar-denominated commodities like BRENT. If geopolitical tensions ease and risk appetite shifts, the dollar's strength could become a more significant headwind for oil prices.
Track markets in real-time
AI-powered analysis, technical indicators and real-time price data.
Join Our Telegram Channel
Breaking market news, AI analysis and trading signals instantly.
Join Channel